BJ's Restaurants Inc. (NASDAQ:BJRI) today reported record revenues
and net income for the third fiscal quarter of 2005 ended Oct. 4,
2005. Highlights for the third quarter, compared to the same
quarter last year, were as follows: -- Revenues increased 45% to
$47.6 million -- Comparable restaurant sales increased 5.5% -- Net
income increased 92% to $2.3 million -- Diluted net income per
share increased approximately 64% to $0.10 "We were very pleased
with our third quarter 2005 financial results," said Jerry
Deitchle, president and CEO. "Our 5.5% comparable sales increase
for the quarter represented our 36th consecutive quarter of growth
in comparable restaurant sales since the company's IPO in 1996.
Additionally, we continue to be pleased with our positive sales
momentum outside of our home state of California. The nine
restaurants in our comparable base that are located outside of
California achieved a 7.1% increase in comparable restaurant sales
for the quarter. These solid sales increases provide a strong
testimonial to BJ's ability to build its favorable reputation and
gain market share in new markets over time." The company opened
three new restaurants during the month of October 2005 (San Bruno,
CA; Sugar Land, TX, and San Mateo, CA), bringing its total
restaurant openings to nine for 2005 and thereby successfully
achieving its stated goal to open eight or more restaurants during
the year. The company currently expects to open as many as 11 new
restaurants during 2006. Signed leases or letters of intent are in
hand for all of the potential 2006 openings, and several signed
letters of intent are already in hand for potential 2007 openings.
"We will continue to execute our restaurant growth plan in a
careful, controlled manner with the goal of achieving a
high-quality 20% to 25% annual capacity increase for the next
several years," commented Deitchle. As previously announced, the
results for both the fiscal third quarter and nine periods ended
Oct. 4, 2005, included two additional days of operations when
compared to the same periods of the prior year. Effective in the
third quarter, we changed our fiscal week-end from Sunday to
Tuesday. This change was completed to facilitate operational
efficiencies by transferring certain administrative tasks away from
the weekends when our restaurants are busiest. Fiscal 2005 will end
on Tuesday, Jan. 3, 2006. Investor Conference Call and Webcast BJ's
Restaurants Inc. will conduct a conference call on its third
quarter earnings release today, Oct. 27, 2005, at 2 p.m. (Pacific).
The company will provide an online Internet simulcast, as well as a
replay, of the conference call. The link to the simulcast and
rebroadcast can be found on the company's Web site at
www.bjsrestaurants.com. The rebroadcast will be available following
the live broadcast and continue for 30 days. BJ's Restaurants Inc.
currently owns and operates 44 casual dining restaurants under the
BJ's Restaurant and Brewery, BJ's Restaurant and Brewhouse or BJ's
Pizza & Grill brand names. BJ's restaurants offer an innovative
and broad menu featuring award-winning, signature deep-dish pizza
complemented with generously portioned salads, sandwiches, soups,
pastas, entrees and desserts. Quality, flavor, value, moderate
prices and sincere service remain distinct attributes of the BJ's
experience. The company operates 11 microbreweries which produce
and distribute BJ's critically acclaimed handcrafted beers
throughout the chain. The company's restaurants are located in
California (30), Texas (6), Arizona (3), Oregon (3), Colorado (1)
and Nevada (1). The company also has a licensing interest in a BJ's
Restaurant in Lahaina, Maui. Visit BJ's Restaurants Inc. on the Web
at http://www.bjsrestaurants.com. Certain statements in the
preceding paragraphs and all other statements that are not purely
historical constitute "forward-looking statements" for purposes of
the Securities Act of 1933 and the Securities and Exchange Act of
1934, as amended, and are intended to be covered by the safe
harbors created thereby. These forward-looking statements involve
known and unknown risks, uncertainties and other factors which may
cause actual results to be materially different from those
projected or anticipated. Factors that might cause such differences
include, but are not limited to: (i) our ability to manage an
increasing number of new restaurant openings, (ii) construction
delays, (iii) labor shortages, (iv) minimum wage increases (v) food
quality and health concerns, (vi) factors that impact California,
where 30 of our current 44 restaurants are located, (vii)
restaurant and brewery industry competition, (viii) impact of
certain brewery business considerations, including without
limitation, dependence upon suppliers and related hazards, (ix)
consumer trends, (x) potential uninsured losses and liabilities,
(xi) fluctuating commodity costs including food and energy, (xii)
trademark and servicemark risks, (xiii) government regulations,
(xiv) licensing costs (xv) beer and liquor regulations, (xvi) loss
of key personnel, (xvii) inability to secure acceptable sites,
(xviii) limitations on insurance coverage, (xix) legal proceedings,
(xx) other general economic and regulatory conditions and
requirements, (xxi) and numerous other matters discussed in the
company's filings with the Securities and Exchange Commission. BJ's
Restaurants Inc. undertakes no obligation to update or alter its
forward-looking statements whether as a result of new information,
future events or otherwise. Further information concerning the
company's results of operations for third quarter 2005 will be
provided in the company's Form 10-Q filing, to be filed with the
Securities and Exchange Commission by Nov. 14, 2005. -0- *T
Selected Unaudited Consolidated Financial Data (Dollars in
thousands except for per share data) For the Thirteen Weeks Ended
------------------------------- Statement of Income Data: Oct. 4,
2005 Sept. 26, 2004 --------------- --------------- Revenues
$47,578 100.0% $32,867 100.0% Costs and expenses: Cost of sales
12,695 26.7 8,668 26.4 Labor and benefits 17,496 36.8 11,813 35.9
Occupancy 3,039 6.4 2,463 7.5 Operating expenses 5,426 11.4 3,715
11.3 General and administrative 3,135 6.6 2,474 7.5 Depreciation
and amortization 1,835 3.9 1,330 4.0 Restaurant opening expense 899
1.9 804 2.4 Gain from sale of Pietro's restaurants - - - - --------
------ -------- ------ Total cost and expenses 44,525 93.7 31,267
95.0 -------- ------ -------- ------ Income from operations 3,053
6.3 1,600 5.0 Other income: Interest income, net 369 0.8 110 0.3
Other income, net 4 - 42 0.1 -------- ------ -------- ------ Total
other income 373 0.8 152 0.4 -------- ------ -------- ------ Income
before income tax expense 3,426 7.1 1,752 5.4 Income tax expense
1,117 2.3 549 1.7 -------- ------ -------- ------ Net income $
2,309 4.8% $ 1,203 3.7% ======== ====== ======== ====== Net income
per share: Basic $ 0.10 $ 0.06 Diluted $ 0.10 $ 0.06 Weighted
average number of shares outstanding: Basic 22,682 19,455 Diluted
24,001 20,538 Selected Unaudited Consolidated Financial Data
(Dollars in thousands except for per share data) For the
Thirty-Nine Weeks Ended -------------------------------- Statement
of Income Data: Oct. 4, 2005 Sept. 26, 2004 ----------------
--------------- Revenues $128,956 100.0% $91,159 100.0% Costs and
expenses: Cost of sales 34,364 26.6 23,701 26.0 Labor and benefits
46,888 36.4 32,574 35.7 Occupancy 8,501 6.6 6,919 7.6 Operating
expenses 14,318 11.1 9,987 11.0 General and administrative 8,942
6.9 7,207 7.9 Depreciation and amortization 4,902 3.8 3,671 4.0
Restaurant opening expense 3,003 2.3 1,813 2.0 Gain from sale of
Pietro's restaurants - - (1,658) (1.8) --------- ------ --------
------ Total cost and expenses 120,918 93.7 84,214 92.4 ---------
------ -------- ------ Income from operations 8,038 6.3 6,945 7.6
Other income: Interest income, net 762 0.6 334 0.4 Other income,
net 121 0.1 156 0.2 --------- ------ -------- ------ Total other
income 883 0.7 490 0.6 --------- ------ -------- ------ Income
before income tax expense 8,921 7.0 7,435 8.2 Income tax expense
2,885 2.2 2,453 2.7 --------- ------ -------- ------ Net income $
6,036 4.8% $ 4,982 5.5% ========= ====== ======== ====== Net income
per share: Basic $ 0.28 $ 0.26 Diluted $ 0.26 $ 0.24 Weighted
average number of shares outstanding: Basic 21,934 19,473 Diluted
23,163 20,546 Selected Balance Sheet Information (Dollars in
thousands) Balance Sheet Data (end of period): Oct. 4, Jan. 2, 2005
2005 (Unaudited) ----------- --------- Cash, cash equivalents and
short-term investments $52,217 $19,541 Total assets $152,283
$100,866 Total long-term debt, including current portion $0 $0
Shareholders' equity $127,398 $78,780 Supplemental Information (1)
For the Thirteen For the Thirty- Weeks Ended Nine Weeks Ended
----------------------------------- Oct. 4, Sept. 26, Oct. 4, Sept.
26, 2005 2004 2005 2004 -----------------------------------
Comparable restaurant sales % change 5.5% 2.9% 4.4% 4.6%
Restaurants opened during period 1 2 6 4 Restaurants open at
period-end 41 33 41 33 Restaurant operating weeks 542 423 1,494
1,233 (1) excludes the one licensed restaurant *T
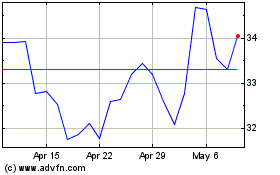
BJs Restaurants (NASDAQ:BJRI)
Historical Stock Chart
From Jun 2024 to Jul 2024

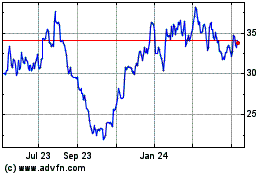
BJs Restaurants (NASDAQ:BJRI)
Historical Stock Chart
From Jul 2023 to Jul 2024
