Berry Petroleum Company (NYSE:BRY) reported net income of $17.7
million, or $0.34 per diluted share, for the first quarter of 2010.
Oil and gas revenues were $148 million during the quarter and
discretionary cash flow totaled $70 million.
Items that affected net income for the quarter included a
non-cash loss on hedges, transaction costs and non-cash items
related to the Company’s Permian acquisition and dry hole costs. In
total, for the first quarter of 2010, these items decreased net
income by approximately $2.1 million, or $0.04 per diluted share
for an adjusted first quarter net income of $19.8 million, or $0.38
per diluted share.
For the first quarter of 2010 and fourth quarter of 2009,
average net production in BOE per day was as follows:
First Quarter Ended
March 31
Fourth Quarter Ended
December 31
2010 Production 2009 Production Oil (Bbls)
20,506 70% 19,999 69% Natural Gas (BOE)
8,885
30%
9,150
31%
Total BOE per day 29,391 100% 29,149 100%
Robert F. Heinemann, president and chief executive officer said,
“In addition to our solid financial results, Berry’s first quarter
of 2010 was notable due to closing our Permian acquisition, the
confirmation of the productivity of our Haynesville wells and an
important bolt-on acquisition which will expand our diatomite
development. Production for the first quarter of 2010 was 29,391
BOE/D, supported by a 500 BOE/D increase in crude oil volumes. We
expect total average production for 2010 to be between 32,250 BOE/D
and 33,000 BOE/D with increases throughout the balance of the year
coming from our capital program and from the integration of our
Permian basin assets. Our teams have continued to focus on
executing development activities that will generate strong margins,
and in the first quarter, we generated a competitive corporate
EBITDA margin of approximately $31 per BOE, with cash operating
margins from our California and Permian oil assets over $45 per
barrel.”
Acquisitions
In April 2010, the Company entered into an agreement with
Chevron U.S.A. Inc. to lease 90 acres directly adjacent to its N.
Midway-Sunset diatomite development in California. These leases
were acquired in exchange for a royalty on future production from
the property. This acquisition increases Berry’s diatomite acreage
by 20% and should raise the total oil in place under development to
approximately 350 MMBOE to 370 MMBOE. Mr. Heinemann stated “We are
excited to bring additional California assets into the portfolio
that can add meaningful value to Berry in the long-term. The
fundamentals for heavy oil remain strong supported by a long term
oil to gas price ratio of greater than 14 to 1 and we continue to
pursue additional acquisition opportunities in California.”
Operational Update
Michael Duginski, executive vice president and chief operating
officer, stated, “We are pleased with the overall execution of our
2010 capital program. We benefited in the first quarter from our
focus on the development of our oil assets where production
increased by 2% over last quarter. Our consumption of natural gas
to generate steam increased from approximately 34,000 MMBtu/D in
the fourth quarter of 2009 to approximately 37,000 MMBtu/D in the
first quarter of 2010 as we continued the development of our heavy
oil assets and initiated several steam flood pilots. We closed on
our first Permian basin acquisition on March 5, 2010 and our fully
staffed Permian asset team took over operations at closing.
Subsequently, we closed on our previously announced 3,200 acre
Permian acquisition on April 6th. We are currently running a one
rig program in the Permian and plan to increase production over the
course of the year. We have drilled three horizontal Haynesville
wells to date and have completed the first well with an initial
production rate of approximately 10.3 MMcf/D and 30-day average
production of 9.0 MMcf/D.”
2010 Guidance
For 2010 the Company is issuing the following guidance:
Anticipated Range per BOE in 2010 ($/BOE) $60 WTI/$4 HH
$60 WTI/$5 HH $75 WTI/$6 HH Operating costs-oil and
gas production $17.00 - $18.00 $18.00 - $19.00 $19.00 - $20.00
Production taxes 1.75 - 2.25 1.75 - 2.25 $2.00 - $2.50 DD&A
12.00 - 14.00 G&A 4.00 - 4.50 Interest expense 5.00 - 6.50
Total $40.75 - $46.25
Explanation and Reconciliation of Non-GAAP Financial
Measures
Discretionary Cash Flow
Three Months Ended 3/31/10 3/31/09 Net cash provided
by operating activities $ 63.5 $ 8.1 Add back: Net increase
(decrease) in current assets 14.2 12.9 Add back: Net decrease
(increase) in current liabilities including book overdraft
(7.3 ) 60.3 Discretionary cash flow $ 70.4 $ 81.3
Reconciliation of First Quarter Net Income
Three Months Ended 3/31/10 Adjusted net income $ 19.8 After tax
adjustments: Non-cash hedge losses (0.9 ) Dry hole costs (0.8 )
Acquisition related items (0.4 ) Net income, as reported $
17.7
Teleconference Call
An earnings conference call will be held Wednesday, April 28,
2010 at 10:00 a.m. Eastern Time (8:00 a.m. Mountain Time). Dial
1-800-295-3991 to participate, using passcode 45990326.
International callers may dial 617-614-3924. For a digital replay
available until May 5, 2010 dial 1-888-286-8010 (passcode
98276042). Listen live or via replay on the web at www.bry.com.
About Berry Petroleum Company
Berry Petroleum Company is a publicly traded independent oil and
gas production and exploitation company with operations in
California, Colorado, Texas and Utah. The Company uses its web site
as a channel of distribution of material company information.
Financial and other material information regarding the Company is
routinely posted on and accessible at
http://www.bry.com/index.php?page=investor.
Safe harbor under the “Private Securities Litigation Reform
Act of 1995”
Any statements in this news release that are not historical
facts are forward-looking statements that involve risks and
uncertainties. Words such as “expect,” "would," "will," "target,"
"goal," and forms of those words and others indicate
forward-looking statements. Important factors which could affect
actual results are discussed in PART 1, Item 1A. Risk Factors of
Berry's 2009 Form 10-K filed with the Securities and Exchange
Commission on February 25, 2010 under the heading "Other Factors
Affecting the Company's Business and Financial Results" in the
section titled "Management's Discussion and Analysis of Financial
Condition and Results of Operations.”
CONDENSED INCOME STATEMENTS (In thousands, except per share
data) (unaudited)
Three Months
03/31/10
12/31/09
Revenues Sales of oil and gas
$ 147,807 $
132,574 Sales of electricity
9,933 10,033 Gas
marketing
8,272 5,160 Gain (loss) on derivatives
1,603 (51 ) Gain (loss) on sale of assets
- (2 ) Interest and other, net
164 435 Total
167,779
148,149 Expenses Operating costs – oil
& gas
47,036 45,295 Operating costs – electricity
9,670 9,329 Production taxes
5,204
3,733 Depreciation, depletion & amortization - oil &
gas
35,907 35,648 Depreciation, depletion &
amortization - electricity
795 743 Gas Marketing
7,786 5,082 General and administrative
13,835
12,094 Interest
17,447 14,722 Transaction
costs on acquisitions, net of gain
727 - Dry hole,
abandonment, impairment & exploration
1,369 5,216
Bad debt expense
-
- Total
139,776 131,862
Income (loss) before income taxes
28,003
16,287 Income tax provision (benefit)
10,334 3,668
Income (loss) from continuing operations
17,669
12,619 Income (loss) from discontinued operations, net of
tax
- 385 Net income (loss)
$ 17,669
$ 13,004
Basic net income (loss) from continuing operations per share
$ 0.34 $ 0.27 Basic net income (loss)
from discontinued operations per share
-
0.01 Basic net income (loss) per
share
$ 0.34
$ 0.28
Diluted net income (loss) from continuing operations per share
$ 0.34 $ 0.27 Diluted net income (loss)
from discontinued operations per share
-
0.01 Diluted net income (loss)
per share
$ 0.34
$ 0.28 Cash
dividends per share
$ 0.075 $ 0.075
Weighted average common shares: Basic
51,076 44,679
Diluted
51,440
45,042 CONDENSED BALANCE SHEETS
(In thousands) (unaudited)
3/31/10
12/31/09
Assets Current assets
$ 112,202 $
103,476 Property, buildings & equipment, net
2,269,848 2,106,385 Fair value of derivatives
2,369 735 Other assets
27,973 29,539
$ 2,412,392
$ 2,240,135 Liabilities
& Shareholders’ Equity Current liabilities
$
180,899 $ 152,137 Deferred taxes
251,913 237,161 Long-term debt
907,124
1,008,544 Other long-term liabilities
67,069
63,198 Fair value of derivatives
57,773 75,836
Shareholders’ equity
947,614
703,259 $
2,412,392 $
2,240,135 CONDENSED STATEMENTS OF CASH
FLOWS (In thousands) (unaudited)
Three
Months
03/31/10
12/31/09
Cash flows from operating activities: Net income
$
17,669 $ 13,004 Depreciation, depletion & amortization
(DD&A)
36,702 36,390 Amortization of debt issuance costs
and net discount
2,098 1,935 Gain on purchase of oil and
natural gas properties
(1,358 ) - Dry hole &
impairment
1,207 5,216 Commodity derivatives
2,476
(4,549 ) Stock based compensation
3,031 1,572 Deferred
income taxes
8,548 6,452 Other, net
- 1,240 Cash paid
for abandonment
(22 ) (737 ) Allowance for bad debt
- - Net changes in assets and liabilities including book
overdraft
(6,836 )
3,674 Net cash provided by
operating activities
63,515 64,197 Net cash used in
investing activities
(186,940 ) (50,865 ) Net cash
provided by financing activities
118,171
(8,996 ) Net
increase (decrease) in cash and cash equivalents
(5,254
) 4,336 Cash and cash equivalents at beginning of
year
5,311
975 Cash and cash equivalents at end of
period
$ 57
$ 5,311 COMPARATIVE OPERATING
STATISTICS (unaudited)
Three Months
03/31/10
12/31/09
Change
Oil and gas: Heavy Oil Production (Bbl/D)
17,752 17,280
Light Oil Production (Bbl/D)
2,754 2,719 Total Oil
Production (Bbl/D)
20,506 19,999 Natural Gas Production
(Mcf/D)
53,309
54,899 Net production-BOE per day
29,391
29,149 1 % Per BOE: Average sales price before hedges
$
57.06 $ 50.76 12 % Average sales price after hedges
$
55.99 $ 48.77 15 % Oil, per Bbl: Average WTI price
$ 78.88 $ 76.13 4 % Price sensitive royalties
(3.04 ) (2.64 ) Gravity differential and other
(8.12 ) (9.63 ) Crude oil hedges
(1.72
) (3.96 ) Correction to royalties payable
- (1.78
) Average oil sales price after hedging
$
66.00 $ 58.12 14 % Natural gas price: Average Henry
Hub price per MMBtu
$ 5.30 $ 4.17 27 % Conversion to
Mcf
0.27 0.21 Natural gas hedges
0.07 0.40 Location,
quality differentials, other
(0.15
) (0.13 ) Avg.
gas sales price after hedging
$ 5.49 $ 4.65 18 %
Operating costs
$ 17.78 $ 16.89 5 % Production
taxes
1.97
1.39 42 % Total operating costs
$
19.75 $ 18.28 8 % DD&A - oil and gas
$
13.57 $ 13.29 2 % General & administrative expenses
$ 5.23 $ 4.51 16 % Interest expense
$
6.60 $ 5.49 20 %
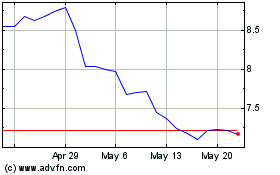
Berry (NASDAQ:BRY)
Historical Stock Chart
From May 2024 to Jun 2024

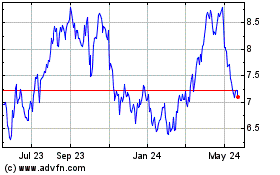
Berry (NASDAQ:BRY)
Historical Stock Chart
From Jun 2023 to Jun 2024
