FTSE All-World Developed... Key Figures
|
FTSE All-World Developed... Balance Sheet| %1$s Balance Sheet | | Sorry No Data Available |
|
 Share Price Performance| Share Price Performance | | Sample Period † | High | Low | | 1 week | 321.85 | 317.16 |
| 4 weeks | 321.85 | 300.71 |
| 12 weeks | 321.85 | 297.04 |
| 1 year | 321.85 | 255.67 |
Share Price Chart (5 years)| Share Price Chart (5 years) | 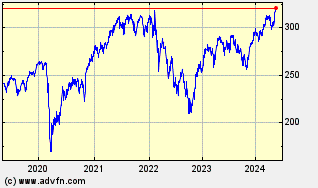 |
|
FTSE All-World Developed... Historic Returns| %1$s Historic Returns | | Giorni da oggi † | Open | Change | % | Open Avg. | Avg. Daily Vol [m] | Total Vol [m] | VWAP | | 1 week | 320.79 | -2.41 | -0.75 | 317.16 | - | | - |
| 4 weeks | 304.44 | 13.94 | 4.58 | 300.71 | - | | - |
| 12 weeks | 301.89 | 16.49 | 5.46 | 297.04 | - | | - |
| 26 weeks | 280.01 | 38.37 | 13.70 | 280.01 | - | | - |
| 1 year | 284.84 | 33.54 | 11.78 | 255.67 | - | | - |
| 3 years | 302.82 | 15.56 | 5.14 | 204.17 | - | | - |
| 5 years | 238.67 | 79.71 | 33.40 | 166.57 | - | | - |
| † periods calculated are whole weeks rather than calendar months | |
|
FTSE All-World Developed... Key Management Ratios
|
FTSE All-World Developed... Investment Ratios
|
FTSE All-World Developed... Financial Ratios
| Beta coefficients | | Beta (60-Mnth) | Beta (36-Mnth) | | Sorry No Data Available | Sorry No Data Available |
|
FTSE All-World Developed... Operating Ratios
|
FTSE All-World Developed... Dividends
|
|
FTSE All-World Developed... Fundamentals |
|
|
FTSE All-World Developed... Balance Sheet
|
FTSE All-World Developed... Cash Flow Statement
|
FTSE All-World Developed... Brokers| Broker infomation is not available for this class of share. |
|
| |
| |
| |
| |