Analyst Exposes Ethereum Ascending Support At $2,400 – Best Chance To Accumulate ETH?
November 01 2024 - 11:30AM
NEWSBTC
Ethereum is trading at $2,500, following a 9% pullback from recent
highs after it failed to establish a higher high above $2,820. This
retrace has sparked renewed interest among investors, with top
analyst and investor Carl Runefelt sharing a technical analysis
that points to a promising setup for accumulation. Runefelt
highlights a bullish pattern emerging in ETH’s price action,
indicating that this retracement could be a prime opportunity for
long-term holders to accumulate more Ethereum before a potential
rally. Related Reading: Bitcoin Consolidates Near ATH – Volume
Suggests A Big Move Ahead The coming days will be pivotal for
Ethereum as the crypto market closely watches Bitcoin’s attempt to
break its all-time highs. Should BTC achieve this feat, it would
confirm a new bull run, likely bringing Ethereum. The crypto
community is eagerly waiting to see if Ethereum can hold its ground
above $2,400 and eventually surpass resistance at $2,820,
potentially setting the stage for higher gains. Ethereum’s current
levels and consolidation phase suggest a decisive move could unfold
soon, making it a crucial time for ETH’s trajectory in the broader
market cycle. Ethereum Sideways Consolidation Ethereum has
been lagging behind Bitcoin and several other altcoins like Solana,
which have recently seen more robust price action. This
underperformance has drawn attention from analysts and investors
alike, including top analyst Carl Runefelt, who recently shared an
in-depth technical analysis on X. Runefelt highlights
Ethereum’s current formation around an ascending support level,
suggesting that ETH’s current price could present one of the best
accumulation opportunities before a potential rally. Runefelt’s
analysis points to a crucial ascending support level of around
$2,450, which has held steady despite Ethereum’s pullbacks,
maintaining a bullish structure. He emphasizes that if Ethereum
continues to trend down, this support could be an attractive entry
point for long-term investors looking to accumulate ETH while it’s
relatively undervalued. The chart formation suggests a
possible price floor, which, if buyers intervene, could catalyze a
move toward higher levels. Related Reading: Dogwifhat (WIF)
Prepares For A Bullish Breakout – Analyst Sets $3 Target On the
upside, Ethereum faces a key resistance at $2,800. Runefelt notes
that breaking this resistance could trigger a significant upward
move, potentially aligning ETH with broader market trends if BTC
breaks into new all-time highs. If Ethereum successfully
clears the $2,800 level, it would confirm the bullish pattern and
likely fuel a surge in price action. This breakout could signal
that Ethereum is ready to catch up to Bitcoin and outperform
altcoins, creating a more favorable outlook for ETH in the broader
market landscape. The next few days will be crucial for Ethereum’s
trajectory as it continues to hold above the ascending support
level. Traders and investors are watching closely to see if ETH can
break out of its recent underperformance and reclaim its position
as an altcoin leader. ETH Technical Details Ethereum is
trading at $2,505 after a failed attempt to hold above the 4-hour
200 moving average (MA) at $2,530. This slip below the 200 MA has
put ETH in a precarious position as it seeks new demand levels to
stabilize the recent retrace. The price is nearing a crucial
support level, and breaking below this area could trigger a
significant correction, adding considerable downside risk to
Ethereum’s current price action. For Ethereum to avoid a deeper
drop, finding support around the $2,450 mark is essential. If
buyers step in and manage to keep ETH above this level, it would
signal a positive shift in momentum. An even stronger bullish
indicator would be if ETH rebounds and pushes above the $2,550
level, which would help restore confidence in the asset and signal
a potential recovery phase. Related Reading: Dogecoin Metrics
Reveal Increasing Network Activity – Is DOGE Ready To Break Yearly
Highs? Such a move could mark the end of the retrace and position
ETH for further upside in the coming sessions. However, until the
price finds solid footing, ETH remains vulnerable to further
declines, making this a pivotal moment for the asset’s short-term
outlook. Featured image from Dall-E, chart from TradingView
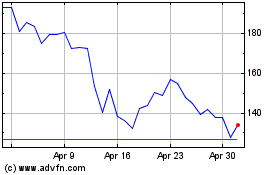
Solana (COIN:SOLUSD)
Historical Stock Chart
From Dec 2024 to Jan 2025

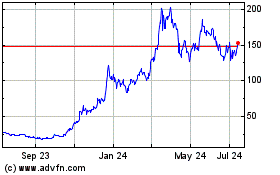
Solana (COIN:SOLUSD)
Historical Stock Chart
From Jan 2024 to Jan 2025
