Wake Up, This Stock is Under-Valued! - Analyst Blog
November 03 2011 - 10:55AM
Zacks
Wake Up, This Stock is Under-Valued!
Ken Nagy, CFA
On November 2, 2011, inTest Corporation
(INTT), an independent designer,
manufacturer and marketer of semiconductor automatic test equipment
interface solutions and temperature management products, reported
financial results for its fiscal 2011 third quarter and nine
months, ended September 30, 2011.
A solid third quarter by the Company resulted in quarterly revenues
increasing by 3.3 percent or $376,000 year over year to $11.681
million, which compares to revenues of $11.305 million for the
three months ended September 30, 2010.
inTest reported that third quarter bookings were $10.5
million, down from its second quarter 2011 bookings of $13.5
million but up year over year compared to its third quarter 2010
bookings of $9.8 million.
inTest’s third quarter 2011 net income soared $3.504 million
to $5.182 million from $1.678 million during the three months ended
September 30, 2010. Still, third quarter net earnings per share
would have resulted in $0.22 per diluted share absent the valuation
allowance as the impact of the reversal of the valuation allowance
increased diluted net earnings per share by $0.28 per diluted
share.
The jump in year over year net income was primarily due to improved
gross margin as well as a reversal of the valuation allowance
against deferred tax assets resulting in an income tax benefit of
$2.762 million in the third quarter of 2011 compared to an income
tax expense of $16,000 for the comparable quarter of 2010.
Gross margin increased year over year from 48.2 percent to 52.5
percent for the three months ended September 30, 2011.The increase
in gross margin was mainly due to a more favorable product mix in
the Company’s Mechanical Products segment.
Based on a weighted average number of diluted shares outstanding of
10.297 million, diluted net income per share resulted in $0.50 per
share. This compared to diluted net income per share of $0.17
on a weighted average number of diluted shares of 10.195 million
during the three months ended September 30, 2010.
inTest’s balance sheet continued to improve with cash and
equivalents increasing sequentially by $3.185 million to $12.064
million and working capital improving by $3.007 million to $18.618
million for the period ended September 30, 2011.
The increase in cash was due to strong cash collections during the
third quarter and management predicts that cash will increase to
between $14 to $15 million by December 31, 2011.
Similarly, total stockholder’s equity improved sequentially by over
25 percent or $5.146 million to $25.441 million.
Additionally, management reported that it anticipates net revenue
for its fourth quarter ended December 31, 2011 will be in the range
of $9.5 million to $10.5 million and that net earnings will be in
the range of $0.03 to $0.10 per diluted share.
The Company further believes that the diversification of its served
markets via its thermal group, improved efficiency and reduced
operating costs attributable to its relocation of facilities are
all strengths it can leverage moving forward. Along the same lines
the Company continues to expand upon its diversification strategy
by leveraging its thermal division and Sigma Systems
acquisition.
inTest believes it continues to make significant process in
diversifying its end market penetration through its thermal
products which offer an effective way to expand the Company’s
available markets by acquiring non semiconductor business in the
aerospace, automotive, medical and telecommunications markets.
As a result of this diversification strategy, non-semi related
bookings consisted of 18 percent of the Company’s consolidated
bookings at the beginning of the year which compares to third
quarter non-semi bookings comprising of 41 percent of
inTest’s consolidated bookings.
The Company expects this trend to continue and predicts that non
semiconductor related products will play an even greater role in
company’s success going forward.

The firm has a diversified portfolio that includes
non-semiconductor markets. This revenue should be a bit more
inelastic and run on a different cyclical time frame than the
semiconductor business. The firm’s goal is to grow Non-Semi revenue
to 50% of revenue. The potential for Non-Semi is enormous
because it incorporates any market that uses thermal. We
value the firm using several metrics
Enterprise Multiple
The enterprise multiple looks at a firm as a potential acquirer
would. The ratio takes debt into account, which is an item which
other multiples do not include. Enterprise value is calculated as
market cap plus debt, minority interest and preferred shares, minus
total cash and cash equivalents. The Firm’s Enterprise multiple is
2.54x compared to 4.79x for the industry. According to the
enterprise multiple INTT appears undervalued compared to
industry.

Two Stage Free Cash Flow to Equity Model
FCFE = Net Income - Net Capital Expenditure - Change in Net
Working Capital + New Debt - Debt Repayment
Assumptions
- The firm is expected to grow at a higher growth rate in
the first period.
- The growth rate will drop at the end of the first period to the
stable growth rate.
- The free cash flow to equity is the correct measure of expected
cash flows to stockholders. (rather than dividends)
Rationale for using the Model
As the non-semiconductor business ramps up to 50% of total revenues
we expect the firm to grow at a higher overall rate than the
industry. As These products mature and the firm faces more
competition we expect the growth rate to level off.
Weakness of the Model
As you add more layers to the model it is more sensitive to the
assumptions you make. The growth may look more “lumpy” than we have
it in the model.
Output
We used the following inputs:
- A 5-year period with an earnings growth rate
of 8.0% and a discount rate of 13.77%.
- A continuing period assumed to go on
forever, with earnings growing at 6% and a discount rate of
13.05%.
With these inputs we arrive at a target price of $7.23.
According to the model, the firm appears
undervalued.
Price to Earnings Multiples/ Price to Sales
Multiples
Due to its simplicity the Price/Earnings ratio is easily the most
widely used metric in all of finance. The first strength of the
model is that it is intuitive. It is simply the price paid for
current earnings. It can also act as a proxy for other firm
characteristics such as risk and growth. There is a downside to the
P/E ratio in that it has the potential to reflect investor’s mood
rather than the fundamentals of the firm. It also eliminates
assumptions about risk, growth, and retention ratio (something
discounted cash flow models account for.)
While not as popular as Price/Earnings or Price/BV, Price/Sales is
not influenced by accounting decisions in depreciation, inventory
and extraordinary charges. P/S multiples are much less volatile
than P/E multiples. However if the problem with the firm lies in
cost control the P/S ratio will not reflect this flaw.
The firm appears undervalued compared to the
industry.
.jpg)
*source for background and General information on valuation
models: Investment Valuation, Aswath Damodaran
Our price target of $7.00 per share is the average of 10.1x our
2011 EPS estimate and our two stage model. We would add shares at
these levels.
To view our most recent research reports and subscribe to
our daily morning email alert, visit http://scr.zacks.com/. Please
email scr@zacks.com with NGNM as the subject to request a copy
of the full research report.
Follow Zacks Small Cap Research on Twitter at
Twitter.com/ZacksSmallCap
INTEST CORP (INTT): Free Stock Analysis Report
Zacks Investment Research
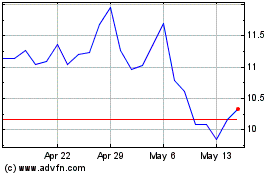
inTest (AMEX:INTT)
Historical Stock Chart
From Sep 2024 to Oct 2024

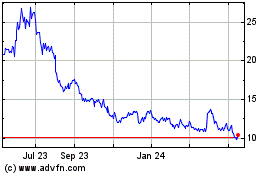
inTest (AMEX:INTT)
Historical Stock Chart
From Oct 2023 to Oct 2024
