inTEST: Focus on Valuation - Analyst Blog
May 03 2011 - 7:12AM
Zacks
Ken Nagy, CFA
inTEST: Focus on Valuation
Executive Summary
inTEST Corporation (INTT) is a
designer, manufacturer and marketer of mechanical, thermal and
electrical products that are used by semiconductor manufacturers in
conjunction with automatic test equipment, (ATE), in the testing of
integrated circuits, (ICs). Beyond its blue chip portfolio of
semiconductor manufacturers, the acquisition of Sigma has propelled
the firm to diversify into non-semi thermal testing products. This
has the effect of diversifying revenues and opens the company up to
new markets. In the test equipment world change is good; be it the
broad switch to mobile computing, the march to finer geometries, or
the growth of electronic content in automobiles more chip content
means more testing for inTEST.
Bullish signs
- Complexity in chips increasing. As
chips get smaller and more complex testing is more
important.
- Chip content spread out over mobile
phone, automobile, industrial goods rather than corporate IT.
- Semiconductor market outlook is
solid, not on par with 2010, yet still expect growth
- Non-semiconductor business has
potential for growth as well as revenue
diversification.
Bearish Signs
- More consumers in semiconductor than
ever before. Pressure of macro economy weakness. (although many
items price under $1,000.00)
- Firm is subject to the cyclical
nature of the semiconductor equipment industry. Until
non-semiconductor is large enough to offset.
Enterprise Multiple
The enterprise multiple looks at a firm as a potential acquirer
would. Enterprise value is calculated as market cap plus debt,
minority interest and preferred shares, minus total cash and cash
equivalents. The Firm’s Enterprise multiple is 4.24x compared to
7.88x for the industry. According to the enterprise
multiple INTT appears undervalued compared to
industry.
| Metric |
inTEST |
Industry Average |
| EV/EBITDA |
4.24 |
7.88 |
Two Stage Free Cash Flow to Equity Model
FCFE = Net Income - Net Capital Expenditure - Change in Net Working
Capital + New Debt - Debt Repayment
Assumptions
- The firm is expected to grow at a higher
growth rate in the first period.
- The growth rate will drop at the end of the
first period to the stable growth rate.
Rationale for using the Model.
As the non-semiconductor business ramps up to 50% of total revenues
we expect the firm to grow at a higher overall rate than the
industry. As These products mature and the firm faces more
competition we expect the growth rate to level off.
Weakness of the Model.
As you add more layers to the model it is more sensitive to the
assumptions you make. The growth may look more “lumpy” than we have
it in the model.
Output
We used the following inputs:
- A 5-year period with an earnings growth rate
of 8.0% and a discount rate of 13.77%.
- A continuing period assumed to go on
forever, with earnings growing at 6% and a discount rate of
13.05%.
With these inputs we arrive at a target price of $7.23.
According to the model, the firm appears
undervalued.
Price to Earnings Multiples/ Price to Sales
Multiples
Due to its simplicity the Price/Earnings ratio is easily the most
widely used metric in all of finance. The first strength of the
model is that it is intuitive. It is simply the price paid for
current/future earnings. It can also act as a proxy for other firm
characteristics such as risk and growth. There is a downside to the
P/E ratio in that it has the potential to reflect investor’s mood
rather than the fundamentals of the firm. It also eliminates
assumptions about risk, growth, and retention ratio (something
discounted cash flow models account for.)
While not as popular as Price/Earnings or Price/BV, Price/Sales is
not influenced by accounting decisions in depreciation, inventory
and extraordinary charges. P/S multiples are much less volatile
than P/E multiples. However if the problem with the firm lies in
cost control the P/S ratio will not reflect this flaw.
The firm appears undervalued compared to the
industry.
.jpg)
Our price target of $7.00 per share is the average of 8.65x our
2011 EPS estimate and our two stage model. We would add shares at
these levels.
Investors may want to check in on INTT results on Wednesday, May 4,
2011 at 5:00 p.m. Eastern Time. The contact information is (480)
629-9762. The Pass code for the conference call is 4433870.
There will also be live webcast on the inTEST website.
(www.intest.com)
For a free copy of the full research report, please email
scr@zacks.com with INTT as the subject.
Follow Zacks Small Cap Research on Twitter at
Twitter.com/ZacksSmallCap
INTEST CORP (INTT): Free Stock Analysis Report
Zacks Investment Research
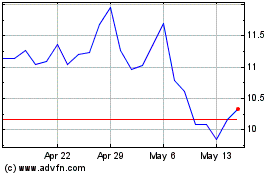
inTest (AMEX:INTT)
Historical Stock Chart
From May 2024 to Jun 2024

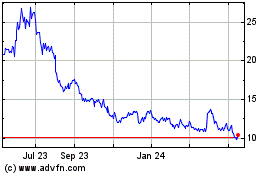
inTest (AMEX:INTT)
Historical Stock Chart
From Jun 2023 to Jun 2024
