Electromed, Inc. (NYSE Amex: ELMD) today announced financial
results for the three-month period ended December 31, 2011. Net
Revenues for the three months ended December 31, 2011, were
approximately $4,790,000, a 2.2% increase compared to Net Revenues
of approximately $4,686,000 for the same period last year. The
Company also announced Net Income of approximately $25,000, or
$0.00 per basic and diluted share, for the three months ended
December 31, 2011, compared to Net Income of approximately
$292,000, or $0.03 per basic and diluted share, for the same period
last year. The reduction in Net Income results was attributable to
missed sales goals reflecting underperformance by a number of
former Clinical Area Managers. This resulted from
termination-driven turnover of approximately 16% of the sales
force. Management continues to believe that planned increases in
the Company’s sales force, reimbursement and production personnel,
coupled with the expansion of marketing and research and
development efforts, will provide strong impetus for continued
solid annual sales growth.
Robert Hansen, Chairman and CEO, commented on the Company,
saying,
“When some employees fail to achieve planned
goals, the performance of all the employees is compromised. In
Sales, this fact is especially relevant. When momentum falters, the
solution is to make summary changes and to replace weakness with
strength. The Regional Sales Managers of Electromed, Inc. and I
have acted swiftly to recruit new, highly-trained, and experienced
sales staff to succeed the sales staff who failed to keep pace with
the growth needs of the Second Quarter. New and exciting successors
have replaced underperformers. I remain confident that the balance
of Fiscal Year 2012, and the First Half of FY2013, beginning July
1, 2012, will reflect strong sales growth accompanied by continued
profitability.”
Gross Profit decreased to approximately $3,480,000, or 72.6% of
Net Revenues, for the three months ended December 31, 2011,
compared to $3,540,000, or 75.6% for the same period in Fiscal
2011. The decrease in gross profit percentage was primarily the
result of a change in average reimbursement from the mix of
referrals during the three month period. Factors such as diagnoses
that are not assured of reimbursement and insurance programs with
lower allowable reimbursement amounts (for example, state Medicaid
programs) affect average reimbursement received on a short-term
basis. These factors tend to fluctuate on a quarterly basis.
However, management does not believe the results of the quarter
ended December 31, 2011, are indicative of a long-term trend in
decreasing margins.
Operating Expenses, which consist of Selling, General, and
Administrative Expenses and Research and Development expenses, were
approximately $3,380,000 for the three months ended December 31,
2011, an increase of approximately 12.6% over Operating Expenses
for the same period last year. These planned increases resulted
from higher payroll related to increasing the size of the sales
team, increases in reimbursement, administration, patient services
staff, and patient training costs related to the higher Sales
volume, increased expenses relating to being a new public Company,
and increased Research and Development expenses.
Total cash was approximately $1,745,000 as of December 31, 2011.
For the three months ended December 31, 2011, cash used in
financing activities was approximately $86,000, consisting
primarily of $90,000 in payments of long-term debt, capital lease
obligations, and deferred financing fees. An aggregate of $405,000
was used for investing activities during the three months ended
December 31, 2011, for purchases of property and equipment. The
Company used approximately $710,000 in operating activities
composed primarily of an increase in the Company’s accounts
receivables and inventory, which increased approximately $304,000
and $234,000, or 2.9% and 10.8%, respectively. Accounts payable and
accrued liabilities decreased approximately $302,000, or 14.0%,
during the three months ended December 31, 2011.
About Electromed, Inc.Electromed, Inc., founded in 1992
and headquartered in New Prague, Minnesota, manufactures, markets,
and sells products that provide airway clearance therapy, including
the SmartVest® Airway Clearance System and related products, to
patients with compromised pulmonary function. Further information
about the Company can be found at www.electromed.com.
Cautionary StatementsCertain statements found in this
release may constitute forward-looking statements as defined in the
U.S. Private Securities Litigation Reform Act of 1995.
Forward-looking statements reflect the speaker’s current views with
respect to future events and financial performance and include any
statement that does not directly relate to a current or historical
fact. Forward-looking statements can generally be identified by the
words “believe,” “expect,” “anticipate” or “intend” or similar
words. Forward-looking statements made in this release include the
Company’s plans and expectations regarding sales growth,
profitability, margins, planned increases in sales force,
reimbursement and production personnel, and expansion of marketing
and research and development. Forward-looking statements cannot be
guaranteed and actual results may vary materially due to the
uncertainties and risks, known and unknown, associated with such
statements. Examples of risks and uncertainties for Electromed
include, but are not limited to, the impact of emerging and
existing competitors, the effectiveness of our sales and marketing
initiatives, changes to reimbursement programs, as well as other
factors described from time to time in our reports to the
Securities and Exchange Commission (including our Annual Report on
Form 10-K). Investors should not consider any list of such factors
to be an exhaustive statement of all of the risks, uncertainties or
potentially inaccurate assumptions investors should take into
account when making investment decisions. Shareholders and other
readers should not place undue reliance on “forward-looking
statements,” as such statements speak only as of the date of this
release.
Electromed, Inc. and Subsidiary Condensed
Consolidated Balance Sheets December 31,
June 30, 2011 2011
Assets (Unaudited) Current
Assets Cash and cash equivalents $ 1,745,468 $ 4,091,739 Accounts
receivable (net of allowances for doubtful accounts of $45,000)
10,704,705 9,593,105 Inventories 2,397,634 1,855,957 Prepaid
expenses and other current assets 466,976 371,257 Deferred income
taxes 722,000 722,000
Total current
assets 16,036,783 16,634,058 Property and equipment, net
3,255,311 2,807,082
Finite-life intangible assets, net
1,198,279 1,235,828
Other assets
239,332 191,964
Total assets $
20,729,705 $ 20,868,932
Liabilities and
Shareholders’ Equity Current Liabilities Revolving line of
credit $ 1,768,128 $ 1,768,128 Current maturities of long-term debt
437,297 438,267 Accounts payable 623,370 733,621 Accrued
compensation 702,274 868,229
Warranty reserve 469,624 444,096
Other accrued liabilities
68,753 161,166
Total current
liabilities 4,069,446 4,413,507 Long-term debt, less current
maturities 1,426,934 1,582,102 Deferred income taxes 167,000
167,000
Total liabilities 5,663,380
6,162,609 Commitments and Contingencies Shareholders’ Equity
Common stock, $0.01 par value; authorized: 13,000,000; shares
issued and outstanding: 8,102,252 and 8,100,485 shares respectively
81,023 81,005 Additional paid-in capital 12,861,759 12,794,368
Retained earnings 2,123,543 1,853,450 Common stock subscriptions
receivable for 15,000 shares outstanding as of June 30, 2011
- (22,500 )
Total shareholders’ equity
15,066,325 14,706,323
Total liabilities and
shareholders’ equity $ 20,729,705 $ 20,868,932
Electromed, Inc. and Subsidiary Condensed
Consolidated Statements of Income
(Unaudited)
For the Three Months Ended
For the Six Months Ended
December 31,
December 31,
2011 2010 2011 2010 Net revenues $ 4,790,344 $
4,685,546 $ 10,169,262 $ 8,850,975 Cost of revenues
1,310,416 1,145,391 2,631,734
2,377,092
Gross profit 3,479,928 3,540,155
7,537,528 6,473,883 Operating
expenses Selling, general and administrative 3,129,447 2,778,415
6,527,000 5,265,999 Research and development 250,339
218,703 457,924 417,089
Total
operating expenses 3,379,786 2,997,118
6,984,924 5,683,088
Operating income
100,142 543,037 552,604 790,795 Interest expense, net of interest
income of $1,634, $4,017, $3,662, and $5,988 respectively
43,588 53,165 87,511 112,852
Net income before income taxes 56,554 489,872 465,093
677,943 Income tax expense (32,000 ) (198,000
) (195,000 ) (274,000 )
Net income $
24,554 $ 291,872 $ 270,093 $ 403,943 Earnings
per share attributable to Electromed, Inc. common shareholders:
Basic $ 0.00 $ 0.04 $ 0.03 $ 0.05 Diluted $ 0.00 $ 0.04 $
0.03 $ 0.05 Weighted-average Electromed, Inc. common
shares outstanding: Basic 8,101,745 8,087,885
8,101,330 7,537,342 Diluted 8,125,458
8,115,621 8,121,971 7,573,453
Electromed, Inc. and Subsidiary Condensed Consolidated
Statements of Cash Flows
(Unaudited)
For the Six Months Ended December 31, 2011
2010 Cash Flows From Operating Activities Net income $
270,093 $ 403,943 Adjustments to reconcile net income to net cash
used in operating activities: Depreciation 193,790 162,010
Amortization of finite-life intangible assets 60,199 54,784
Amortization of debt issuance costs 6,066 27,593 Share-based
compensation expense 62,108 86,260 Loss on disposal of property and
equipment 9,865 5,653 Changes in operating assets and liabilities:
Accounts receivable (1,111,600 ) (1,271,774 ) Inventories (541,677
) (64,429) Prepaid expenses and other assets (138,627 ) 4,769
Accounts payable and accrued liabilities (343,091 )
355,257
Net cash used in operating activities
(1,532,874 ) (235,934 ) Cash Flows From Investing
Activities Expenditures for property and equipment (618,966 )
(208,253 ) Expenditures for finite-life intangible assets
(22,650 ) (648,616 )
Net cash used in investing
activities (641,616 ) (856,869 ) Cash
Flows From Financing Activities Net payments on revolving line of
credit - (500,000 ) Principal payments on long-term debt including
capital lease obligations (189,056 ) (215,708 ) Payments of
deferred financing fees (10,526) (4,659 ) Proceeds from warrant
exercises 5,301 - Proceeds from sales of 1.9 million shares of
common stock, net of offering costs of $1,236,287 - 6,363,713
Proceeds from subscription notes receivable 22,500
-
Net cash provided by (used in) financing
activities (171,781) 5,643,346
Net increase (decrease) in cash and cash equivalents
(2,346,271) 4,550,543 Cash and cash equivalents Beginning of period
4,091,739 610,727 End of period $
1,745,468 $ 5,161,270
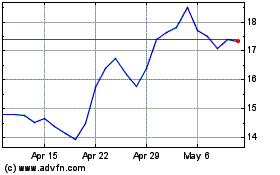
Electromed (AMEX:ELMD)
Historical Stock Chart
From May 2024 to Jun 2024

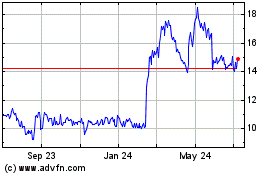
Electromed (AMEX:ELMD)
Historical Stock Chart
From Jun 2023 to Jun 2024
