RWE AG 9 Monday 2016 -- Forecast
November 11 2016 - 10:31AM
Dow Jones News
FRANKFURT--The following is a summary of analysts' forecasts for
RWE AG (RWE.XE) 9 months results, based on a poll of four analysts
conducted by Dow Jones Newswires (figures in million euros, EPS,
dividend and target price in euro,
according to IFRS). Earnings figures are scheduled to be
released November 14.
===
                          Operating  Net income
9 months          EBITDA     result    adjusted     EPS
AVERAGE            3,910      2,179         368    0.57
Prev. Year         4,403      2,658         545    0.89
+/- in %             -11        -18         -32     -36

MEDIAN             3,907      2,194         371    0.56
Maximum            3,945      2,231         445    0.65
Minimum            3,880      2,097         286    0.49
Amount (a)             4          4           4       3

Commerzbank        3,892      2,097         286      --
LBBW               3,945      2,188         342    0.56
Societe Generale   3,880      2,199         445    0.49

               Target price  Rating                DPS2016
AVERAGE               14.08  positive 2   AVERAGE     0.25
Prev. Quarter         14.74  neutral  2   Prev. Year  0.00
+/- in %               -4.5  negative 2   +/- in %      --

MEDIAN                14.25               MEDIAN      0.25
Maximum               18.50               Maximum     0.52
Minimum               10.00               Minimum     0.00
Amount                    6               Amount         6

Commerzbank           12.00  Reduce                   0.00
Independent Research  13.50  Hold                     0.10
Kepler Cheuvreux      10.00  Reduce                   0.00
LBBW                  15.50  Buy                      0.45
Morgan Stanley        15.00  Equalweight              0.52
Societe Generale      18.50  Buy                      0.40
===
Year-earlier figures are as reported by the company.
(a) Including estimates from analysts who want to remain
anonymous.
DJG/mus
(END) Dow Jones Newswires
November 11, 2016 10:16 ET (15:16 GMT)
Copyright (c) 2016 Dow Jones & Company, Inc.
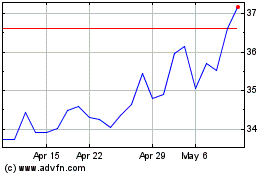
Rwe (PK) (USOTC:RWEOY)
Historical Stock Chart
From Aug 2024 to Sep 2024

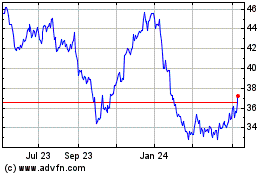
Rwe (PK) (USOTC:RWEOY)
Historical Stock Chart
From Sep 2023 to Sep 2024
