CEMEX Reports First-Quarter 2011 Results
April 29 2011 - 7:30AM
Business Wire
CEMEX, S.A.B. de C.V. ("CEMEX") (NYSE: CX), announced today that
consolidated net sales increased 11% in the first quarter of 2011
to U.S.$3.4 billion versus the comparable period in 2010. Operating
EBITDA increased 1% in the first quarter of 2011 to U.S.$519
million versus the same period of 2010.
CEMEX’s Consolidated First-Quarter
Financial and Operational Highlights
- The increase in consolidated net sales
was due to higher volumes mainly from our Mexican, European, and
South/Central America and Caribbean operations.
- The infrastructure and residential
sectors were the main drivers of demand in most of our
markets.
- Free cash flow after maintenance
capital expenditures for the quarter was negative U.S.$317 million,
from a negative U.S.$171 million in the same quarter of 2010.
- Operating income in the first quarter
increased 16%, to U.S.$172 million, from the comparable period in
2010.
Fernando A. González, Executive Vice President of Finance and
Administration, said: “Despite the still lingering effects of the
economic downturn in a number of our key geographies, we are
encouraged by the stabilization of important indicators in the
construction materials business. Consolidated domestic gray cement
and aggregates volumes showed growth for the first time since the
first quarter of 2007. We are pleased with the trend we have seen
in our quarterly sales because this is the seventh consecutive
quarter of top-line recovery in our results. And, as a result of
our financial strategy, we have eliminated our refinancing risk
until December of 2013.”
Consolidated Corporate Results
During the quarter, controlling interest net income was a loss
of U.S.$276 million, versus a loss of U.S.$342 million in the same
period last year. This reflects higher operating income, higher
exchange gain, and lower other expenses, which more than offset the
higher financial expenses during the quarter.
Geographical Markets First Quarter
Highlights
Net sales in our operations in Mexico increased 14% in
the first quarter of 2011 to U.S.$842 million, compared with
U.S.$742 million in the first quarter of 2010. Operating EBITDA
increased 13% to U.S.$292 million versus the same period of last
year.
CEMEX’s operations in the United States reported net
sales of U.S.$507 million in the first quarter of 2011, down 8%
from the same period in 2010. Operating EBITDA was a loss of
U.S.$48 million in the quarter.
In Europe, net sales for the quarter increased 24% to
U.S.$1.2 billion, compared with U.S.$947 million in the first
quarter of 2010. Operating EBITDA was U.S.$50 million for the
quarter.
CEMEX’s operations in South/Central America and the
Caribbean reported net sales of U.S.$396 million during the
first quarter of 2011, representing an increase of 8% over the same
period of 2010. Operating EBITDA decreased 8% to U.S.$117 million
in the first quarter of 2011, from U.S.$126 million in the first
quarter of 2010.
First-quarter net sales in Africa and the Middle East
were U.S.$248 million, down 6% from the same quarter of 2010.
Operating EBITDA decreased 4% to U.S.$80 million for the quarter
versus the comparable period in 2010.
Operations in Asia reported a 2% decrease in net sales
for the quarter, to U.S.$122 million, versus the first quarter of
2010, and Operating EBITDA for the quarter was U.S.$21 million,
down 36% from the same period in the previous year.
CEMEX is a global building materials company that provides
high-quality products and reliable service to customers and
communities in more than 50 countries throughout the world. CEMEX
has a rich history of improving the well-being of those it serves
through its efforts to pursue innovative industry solutions and
efficiency advancements and to promote a sustainable future.
For more information, please visit: www.cemex.com
Follow us on:
facebook.com/cemex
twitter.com/cemex
youtube.com/cemex
flickr.com/cemex
This press release contains forward-looking statements and
information that are necessarily subject to risks, uncertainties
and assumptions. Many factors could cause the actual results,
performance or achievements of CEMEX to be materially different
from those expressed or implied in this release, including, among
others, changes in general economic, political, governmental and
business conditions globally and in the countries in which CEMEX
does business, changes in interest rates, changes in inflation
rates, changes in exchange rates, the level of construction
generally, changes in cement demand and prices, changes in raw
material and energy prices, changes in business strategy and
various other factors. Should one or more of these risks or
uncertainties materialize, or should underlying assumptions prove
incorrect, actual results may vary materially from those described
herein. CEMEX assumes no obligation to update or correct the
information contained in this press release.
EBITDA is defined as operating income plus depreciation and
amortization. Free Cash Flow is defined as EBITDA minus net
interest expense, maintenance and expansion capital expenditures,
change in working capital, taxes paid, and other cash items (net
other expenses less proceeds from the disposal of obsolete and/or
substantially depleted operating fixed assets that are no longer in
operation). Net debt is defined as total debt minus the fair value
of cross-currency swaps associated with debt minus cash and cash
equivalents. The net debt to EBITDA ratio is calculated by dividing
net debt at the end of the quarter by EBITDA for the last twelve
months. All of the above items are presented under generally
accepted accounting principles in Mexico. EBITDA and Free Cash Flow
(as defined above) are presented herein because CEMEX believes that
they are widely accepted as financial indicators of CEMEX's ability
to internally fund capital expenditures and service or incur debt.
EBITDA and Free Cash Flow should not be considered as indicators of
CEMEX's financial performance, as alternatives to cash flow, as
measures of liquidity or as being comparable to other similarly
titled measures of other companies.
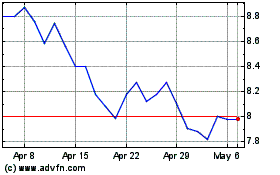
Cemex SaB De Cv (NYSE:CX)
Historical Stock Chart
From Apr 2024 to May 2024

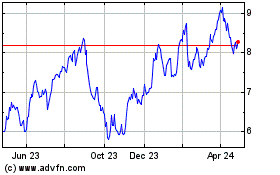
Cemex SaB De Cv (NYSE:CX)
Historical Stock Chart
From May 2023 to May 2024
