Interim Results
September 20 2002 - 1:36PM
UK Regulatory
RNS Number:4790B
10 Group PLC
20 September 2002

10 Group plc, Interim Results to June 30, 2002.

The six months interim results to June 30, 2002, show a loss for the period of
#1.132 million.

We have continued to make considerable savings on overheads and the losses for
the interim period reported can largely be attributed to our continuing
withdrawal from media and marketing, with the majority from write downs of our
various investments.

In spite of tough trading conditions in the world stock markets, your board
continues to seek investment opportunities that offer prospects of growth.

We are continuing to develop our franchise, leisure and investment business and
I am pleased to announce that the first of two former "Dome" cafe restaurant
bars, in the modern Atlantic Wharf development in Cardiff, is now trading, with
the second, located in the centre of Birmingham's theatreland, expected to be
open soon. We acquired these sites for only #40,000 and consider them a low cost
business opportunity with potential to generate significant returns.

We have also signed two territory franchise agreements for greater Birmingham
and greater Manchester with OnePointfor Ltd to open two One Point sites, one in
Solihull, near Birmingham, and the other in Manchester, with the option to open
a further 18 sites - nine in each territory. We will also have the opportunity
to develop more sites in these and other locations.

One Point is a unique new franchise development, providing a stand-alone,
self-contained unit or in-line unit that will be located in shopping malls, rail
and bus stations and airports containing a cashpoint, mobile phone top up
facility, coffee, treats and snacks.

Despite difficult stock markets we raised further cash through equity issues. In
May we raised #249,000 by way of a placing and in June a further #150,000 was
raised by way of a placing of 500,000,000 shares at 0.03p per share via Seymour
Pierce Ellis Ltd.

We also acquired New York-based World Franchise Solutions (WFS)
(www.worldfranchisesolutions.com) for a consideration of $100,000 US, via our
subsidiary 10 Leisure plc. The total consideration of $100,000 was paid in
shares at 0.35 pence or the offer price on day of issue, whichever was the
greater, as $75,000 initially with $25,000 deferred and payable after six
months.

10 Group plc's shares are now listed as a Level 1 American Depository Receipt
(ADR), having been issued by the Bank of New York which is the authorised
depository. This listing can be viewed at
www.adrbny.com/dr_directory.jsp?country=GB.

These Level 1 ADRs are traded in the US markets and 10 Group plc joins other UK
plcs, ranging from from FTSE 100 companies such as Tesco plc to other AIM
companies.

10i, our investment division, has continued to hold a portfolio of investments
including other listed companies such as Bank Restaurant Group plc and Beaufort
Group International plc, which we are still confident in as investment decisions
in the long term.

10 Leisure is continuing to explore further Master Franchise Opportunities in
the UK, Republic of Ireland, Australia and New Zealand.

Thank you for your continued support.


Andy Moore, Chairman, 10 Group plc.


20 September, 2002


   CONSOLIDATED PROFIT AND LOSS ACCOUNT
   SIX MONTHS TO 30 JUNE 2002
                                                                6 MONTHS ENDED  6 MONTHS ENDED    YEAR ENDED
                                                                 30 JUNE 2002    30 JUNE 2001     31 DECEMBER
                                                                                                     2001
                                                                  (UNAUDITED)     (UNAUDITED)      (AUDITED)
                                                                     #000            #000            #000

TURNOVER                                                        581             3,386           4,593
COST OF SALES                                                   (361)           (1,845)         (2,991)

GROSS PROFIT                                                    220             1,541           1,602
ADMINISTRATIVE EXPENSES                                         (577)           (1,844)         (2,991)

OPERATING (LOSS)                                                (357)           (303)           (1,389)

AMORTISATION OF GOODWILL                                        -               (36)            (48)
EXCEPTIONAL ITEMS                                               (724)           (104)           (293)

                                                                (1,081)         (443)           (1,730)
PROFIT ON DISPOSAL OF SUBSIDIARIES                              -               267             272


(LOSS) ON ORIDNARY ACTIVITIES BEFORE INTEREST                   (1,081)         (176)           (1,458)

INTEREST & SIMILAR CHARGES                                      (11)            (13)            (41)


LOSS ON ORDINARY ACTIVITIES BEFORE TAXATION                     (1,092)         (189)           (1,499)

MINORITY INTEREST                                               -               -               48
Taxation                                                        (40)


LOSS ON ORDINARY ACTIVITIES AFTER TAXATION                      (1,132)         (189)           (1,451)

LOSS PER ORDINARY SHARE                                          0.07p          0.02 p          0.16 p


CONSOLIDATED BALANCE SHEET
SIX MONTHS TO 30 JUNE 2002

                                                         6 MONTHS ENDED           6 MONTHS ENDED         YEAR ENDED
                                                          30 JUNE 2002             30 JUNE 2001      31 DECEMBER 2001
                                                           (UNAUDITED)            (UNAUDITED)            (AUDITED)
                                                         #000        #000       #000        #000     #000        #000
  FIXED ASSETS
  GOODWILL                                                  -                    571                    -
  TANGIBLE ASSETS                                         856                    406                  886
  INTANGIBLE ASSETS                                        50                     57                  253
  INVESTMENTS                                             266                    198                   70
                                                                    1,172                  1,232                1,209
  CURRENT ASSETS
  BUILDING FOR SALE                                         -                    677                    -
  STOCK                                                     -                    804                    -
  INVESTMENTS                                             604                                         749
  DEBTORS                                                 761                  1,955                1,315
  CASH                                                    747                  1,961                  753

                                                        2,113                  5,397                2,817
  CREDITORS: AMOUNTS FALLING DUE WITHIN ONE YEAR        (632)                (2,196)                (501)
  NET CURRENT ASSETS                                                1,481                  3,201                2,316

  TOTAL ASSETS                                                      2,653                  4,433                3,525
  CREDITORS: AMOUNTS FALLING DUE AFTER MORE THAN ONE                (587)                  (449)                (620)
  YEAR

  NET ASSETS                                                        2,066                  3,984                2,905

  CAPITAL AND RESERVES
  CALLED UP SHARE CAPITAL                                           9,483                  8,956                9,362
  SHARE PREMIUM ACCOUNT                                             6,988                  6,798                6,816
  CAPITAL REDEMPTION RESERVE                                        3,564                  3,564                3,564
  MERGER RESERVE                                                        -                    213                    -
  PROFIT AND LOSS ACCOUNT                                        (17,969)               (15,547)             (16,809)

  EQUITY SHAREHOLDERS' FUNDS                                        2,066                  3,984                2,933
  MINORITY INTEREST                                                     -                      -                 (28)
                                                                    2,066                  3,984                2,905


                      This information is provided by RNS
            The company news service from the London Stock Exchange
END

IR ZGGZLNGVGZZM
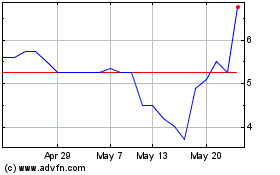
Tirupati Graphite (LSE:TGR)
Historical Stock Chart
From Jun 2024 to Jul 2024

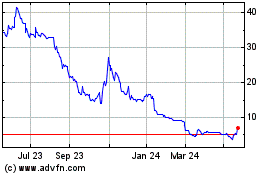
Tirupati Graphite (LSE:TGR)
Historical Stock Chart
From Jul 2023 to Jul 2024
