TIDMSVE


25 April 2013


   Starvest Plc

   Half-year report - six months ended 31 March 2013

   Chairman's statement

   I am pleased to provide a half year update, although I am more than a
little disappointed with the result.

   On 2 April we announced that the steady decline in the Company's net
asset value since early 2011 culminating in a fall of 18% between 30
September and 31 December 2012 had been reversed in the quarter to 31
March 2013 when the value closed at GBP3.05m, a modest improvement of 2%
during the quarter.   Not only was the scale of the improvement very
disappointing, but the decline has resumed so that as at the close of
business on 19 April, the value had fallen further to GBP2.53m a total
of 16% since 31 December 2012.

   Why, you may ask should this be against the background of recent major
stock market rises?  It is clear to us that private investors, the
traditional supporters and providers of capital to small mineral
exploration companies, have taken fright and are no longer supporting
the industry as they once did.  As a result a number of the companies we
have supported and many others are running short of funds and as a
consequence have no option but to raise necessary new funds at ever
lower prices.  In short, there is a general lack of liquidity in spite
of good progress having been made by many companies in their search for
commercially viable commodities and development towards being able to
generate cash from their often not inconsiderable achievements.

   In summary, during the half year:


   -- Company net asset value has fallen to GBP3.05m;

   -- Starvest's mid share price has fallen to 5.0 pence;

   -- Closing net asset value of 8.23 pence per share;

   -- Mid share price on 31 March 2013 had a discount to net asset value of
      39%;

   -- There were no investment sales during the period; and

   -- There was one acquisition only, namely a small addition to the investment
      in Rare Earths and Metals plc.


   All valuations are based on the closing market bid prices or lower
directors' valuation as described in the 2012 annual report.

   What of the future?  We remain of the view that the hunger of the
developing world for commodities shows no sign of abating.  On the
contrary, although there may be periods such as at present when there is
a slowing of demand for some commodities, the increasing urbanisation of
populations can have only a positive impact on world demand for and the
prices of these raw materials.  With patience, we will see a recovery,
although it may take a while yet.

   The Company is adequately funded at present with an adequate spread of
investments, Therefore, now or in the near future may present to
investors a useful opportunity for further investment in the Company.

   It remains our intention to reward the patience of Shareholders with
modest dividends when circumstances permit.

   The Company will next update the market immediately following 30 June
2013, or in the event of a significant change in valuation during the
quarter.


R Bruce Rowan
 Chairman & Chief Executive
 25 April 2013


   Profit & loss account


                                 6 months to  6 months to
                                  31 March      31 March        Year ended
                                    2013          2012       30 September 2012
                                  Unaudited    Unaudited         Audited
                                     GBP           GBP              GBP
Operating income                      -            -                -
Direct costs                          -            -                -
Gross profit                          -            -                -
Administrative expenses            (108,727)     (113,040)           (199,791)
Amounts written off trade
 investments - net                 (563,352)     (237,274)           (842,703)
Operating (loss) on ordinary
 activities                        (672,079)     (350,314)         (1,042,494)
Interest receivable                    1,214         7,663              10,932
 Interest payable                          -             -                   -
(Loss) on ordinary activities
 before taxation                   (670,864)     (342,651)         (1,031,562)
Tax on profit on ordinary
 activities                              127        89,000             284,044
(Loss) on ordinary activities
 after taxation                    (670,737)     (253,631)           (747,518)

(Loss) per share - see note 3    (1.8) pence   (0.6) pence         (2.0) pence
 Basic                                     -             -                   -
 Fully diluted


   Balance sheet


                                                   6 months    6 months
                                                   ended 31    ended 31
                                                    March       March         Year ended
                                                     2013        2012      30 September 2012
                                                  Unaudited   Unaudited        Audited
                                                      GBP         GBP             GBP
Current assets
 Debtors                                            24,079     102,614         310,042
 Trading investments                               2,495,704   3,231,485       3,051,056
 Cash at bank and in hand                           347,486    1,488,275        199,036
                                                   2,867,269   4,822,374           3,560,134
Creditors - amounts falling due within one year
 Other creditors                                    (24,113)    814,614)            (46,241)
Net current assets                                 2,843,156   4,007,760           3,513,893
Share capital and reserves
 Called up share capital                             394,173     394,173             394,173
 Share premium account                             2,118,396   2,118,396            2118,396
 Profit and loss account                             330,587   1,495,191           1,001,324
Equity shareholders' funds                         2,843,156   4,007,760           3,513,893


   Cash flow statement


                                        6 months   6 months
                                        ended 31   ended 31
                                          March      March        Year ended
                                          2012       2012      30 September 2012
                                        Unaudited  Unaudited       Audited
                                           GBP        GBP             GBP

Net cash (outflow) from operating
 activities                             (137,064)  (251,338)           (781,300)
Returns on investment and servicing of
 finance:
Interest receivable                         1,214      7,663              10,932
Taxation recovered/(paid)                 284,300          -           (762,546)

Dividend paid                                   -  (183,586)           (183,586)

Financing:
 Issue of new shares                            -     22,000              22,000
Increase/(decrease) in cash in the
 period                                   148,450  (405,261)         (1,694,500)
Opening cash balance brought forward
 Net debt brought forward                 199,036  1,893,536           1,893,536
Closing cash balance                      347,486  1,488,275             199,036


   Movement on equity shareholders' funds


                                                   6 months    6 months
                                                   ended 31    ended 31
                                                    March       March         Year ended
                                                     2013        2012      30 September 2012
                                                  Unaudited   Unaudited        Audited
                                                      GBP         GBP             GBP

                                                  (670,737)   (253,651)       (747,518)
Total recognised (loss) relating to the period         -        22,000          22,000
Shares issued Dividends paid                           -       (183,586)       (183,586)
(Decrease) in shareholders' funds                 (670,737)   (415,237)       (909,104)
 Opening shareholders' funds                       3,513,893   4,422,997       4,422,997
Closing shareholders' funds                        2,843,156   4,007,760           3,513,893


   Interim report notes

   1.       Interim report

   The information relating to the six month periods to 31 March 2013 and
31 March 2012 is unaudited.

   The information relating to the year ended 30 September 2012 is
extracted from the audited accounts of the Company which have been filed
at Companies House and on which the auditors issued an unqualified audit
report.

   2.       Basis of accounting

   The report has been prepared using accounting policies that are
consistent with those adopted by the Company in accordance with UK GAAP
for the statutory accounts for the year ended 30 September 2012,
although the information does not constitute statutory accounts within
the meaning of section 435 of the Companies Act 2006.

   The Company will report again for the full year to 30 September 2013.

   The Company's investments at 31 March 2013 are valued at the lower of
cost or the valuation adopted at 30 September 2012 or the current market
value based on bid prices at the close of business.  The Chairman's
statement includes a valuation based on bid prices at 31 March 2013.

   3.       Earnings per share


                                                          6 months    6 months
                                                          ended 31    ended 31
                                                           March       March         Year ended
                                                            2013        2012      30 September 2012
                                                         Unaudited   Unaudited        Audited
                                                             GBP         GBP             GBP

These have been calculated on a (loss) of:                (670,737)   (253,651)           (747,518)
The weighted average number of shares used was:          37,117,259  36,818,358          36,967,532
                                                              (1.8)      (0.69)
Basic (loss) per share:                                       pence       pence         (2.0) pence
The weighted average number of shares and outstanding
options used was:                                        40,092,259  40,492,259          37,383,926
Fully diluted (loss) per share is not calculated                  -           -                   -


   Investment portfolio

   Starvest now holds trade investments in the companies listed below; of
these the following nine companies comprised 85% of the portfolio value
as at 31 March 2013:


                              Gold exploration in Turkey
 --    Ariana Resources plc    www.arianaresources.com
                              Iron ore, gold, copper and uranium exploration in
 --    Beowulf Mining plc      Sweden
                               www.beowulfmining.com
                              Gold exploration and mining in Egypt and Ethiopia
 --    Centamin plc            www.centamin.com
                              Gold exploration in Western Australia and Tasmania
 --    Greatland Gold plc      www.greatlandgold.com
                              Gold and copper exploration in Turkey and Saudi Arabia
 --    Kefi Minerals plc       www.kefi-minerals.com
                              Oil and gas exploration in the North Sea
 --    Nordic Energy plc       www.nordicenergyplc.com
                              Coal mining in Pakistan
 --    Oracle Coalfields plc   www.oraclecoalfields.com
--    Red Rock Resources plc  Iron ore and manganese exploration in Greenland; gold
                               exploration in Kenya and Columbia with investments
                               in other companies
                               www.rrrplc.com
                              Copper & nickel exploration in Australia and Papua
 --    Regency Mines plc       New Guinea and investments in Red Rock Resources plc
                               , Oracle Coalfields plc and Direct Nickel Limited
                               www.regency-mines.com
                              Mineral exploration in Finland, Australia and Ireland
 --    Sunrise Resources plc   www.sunriseresourcesplc.com


   Other direct and indirect mineral exploration companies:


                                                             Nickel, uranium & gold in Scotland, Mauritania, Sweden
 --    Alba Mineral Resources plc                             and Ireland
                                                              www.albamineralresources.com
                                                             Investment holding company with interests in Regency
 --    Equity Resources plc                                   Mines plc and Red Rock Resources plc
                                                             Tantulum exploration in Egypt
 --    Gippsland Limited                                      www.gippslandltd.com.au
--    International Mining & Infrastructure Corporation plc  Investment holding company
                                                              www.imicplc.com
                                                             Gold exploration in South America
 --    Minera IRL Limited                                     www.minera-irl.com


   Other investee companies are listed in the Company's 2012 annual report
available on request as below.

   Shareholders and others who wish to receive electronic copies of
announcements are invited to register their email address on the home
page of the Company website: www.starvest.co.uk, due to be re-launched
shortly.

   Copies of this interim report are available free of charge by
application in writing to the Company Secretary at the Company's
registered office, 55 Gower Street, London WC1E 6HQ, by email to
email@starvest.co.uk or from the Company's website at
www.starvest.co.uk.

   Enquiries to:


   -- Bruce Rowan, telephone 020 7486 3997

   -- John Watkins, telephone 01483 771992, or to john@starvest.co.uk

   -- Colin Aaronson or David Hignell, Grant Thornton Corporate Finance,
      telephone 020 7383 5100


   End

   This announcement is distributed by Thomson Reuters on behalf of Thomson
Reuters clients.

   The owner of this announcement warrants that:

   (i) the releases contained herein are protected by copyright and other
applicable laws; and

   (ii) they are solely responsible for the content, accuracy and
originality of the

   information contained therein.

   Source: Starvest plc via Thomson Reuters ONE

   HUG#1696294


  http://www.webshareshop.com
Starvest (LSE:SVE)
Historical Stock Chart
From Jun 2024 to Jul 2024

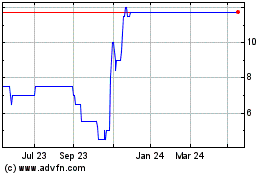
Starvest (LSE:SVE)
Historical Stock Chart
From Jul 2023 to Jul 2024
