At 31 March 2011 the currency cash flow profile of those
financial assets and liabilities was:
                          GBP         USD         EUR         NZD        Total
                          GBP         GBP         GBP         GBP          GBP
 Non current
  investments at
  fair value
  through profit
  or loss          43,515,830   4,966,976   2,224,643   3,759,135   54,466,584

 Amounts due
  from brokers      1,024,781           -           -           -    1,024,781

 Dividends and
  interest
  receivable               24           -           -           -           24

 Other
  receivables          11,700      63,485           -           -       75,185

 Cash and cash
  equivalents         880,729          16           -           -      880,745

 Amounts due to
 brokers                    -           -           -           -            -

 Other payables
  and accrued
  expenses          (565,424)           -           -           -    (565,424)

 Total net
  foreign
  currency
  exposure         44,867,640   5,030,477   2,224,643   3,759,135   55,881,895
                  -----------  ----------  ----------  ----------  -----------
At 31 March 2010 the currency cash flow profile of those
financial assets and liabilities was:
                               GBP         USD         EUR   CAD         Total
                               GBP         GBP         GBP   GBP           GBP
 Non current
  investments at
  fair value through
  profit or loss        43,824,760   3,956,483   3,381,255     -    51,162,498

 Amounts due from
  brokers                        -           -      12,687     -        12,687

 Dividends and
  interest
  receivable               173,230           -           -     -       173,230

 Other receivables          35,243      67,090           -     -       102,333

 Cash and cash
  equivalents              195,000           -           -     -       195,000

 Amounts due to
  brokers                 (34,632)           -           -     -      (34,632)

 Other payables and
  accrued expenses       (324,908)   (131,853)           -     -     (456,761)

 Overdraft             (1,116,352)           -           -     -   (1,116,352)
 Total net foreign
  currency exposure     42,752,341   3,891,720   3,393,942     -    50,038,003
                      ------------  ----------  ----------  ----  ------------
Sensitivity analysis is based on the Group's monetary foreign
currency instruments held at each balance sheet date.
If Sterling had weakened against the US Dollar by 10%, this
would have increased the net assets by GBP558,942 (2010:
GBP432,413) and reduced the net loss by GBP558,942 (2010:
GBP432,413).
If Sterling had strengthened against the US Dollar by 10%, this
would have decreased the net assets by GBP457,316 (2010:
GBP353,793) and increased the net loss by GBP457,316 (2010:
GBP353,793).
If Sterling had weakened against the Euro by 10%, this would
have increased the net assets by GBP247,183 (2010: GBP377,105) and
reduced the net loss by GBP247,183 (2010: GBP377,105).
If Sterling had strengthened against the Euro by 10%, this would
have decreased the net assets by GBP202,240 (2010: GBP308,540) and
increased the net loss by GBP202,240 (2010: GBP308,540).
If Sterling had weakened against the New Zealand Dollar by 10%,
this would have increased the net assets by GBP417,682 (2010: Nil)
and reduced the net loss by GBP417,682 (2010: GBPNil).
If Sterling had strengthened against the New Zealand Dollar by
10%, this would have decreased the net assets by GBP341,740 (2010:
Nil) and increased the net loss by GBP341,740 (2010: Nil).
Interest rate risk
Interest rate movements may affect:
-- the fair value of the investments in fixed rate securities
(including unquoted preferred shares - page 9);
-- the level of income receivable on cash deposits;
-- the interest payable on the Group's variable rate
borrowings.
The possible effects on fair value and cash flows that could
arise as a result of changes in interest rates are taken into
account when making investment decisions and borrowings under the
loan facility. The Board reviews on a regular basis the values of
the unquoted loans and preferred shares to companies in which
private equity investment is made. Interest rate risk is not
significant to the Group.
Other price risk
Other price risks (i.e. changes in market prices other than
those arising from currency risk or interest rate risk) may affect
the value of investments.
The Group's exposure to price risk comprises mainly of movements
in the value of the Group's investments. As at the year-end, the
spread of the Group's investment portfolio is analysed on pages 8
and 9.
The Board of Directors manages the market price risks inherent
in the investment portfolios by ensuring full and timely access to
relevant investment information from the Investment Manager. The
Board meets regularly and at each meeting reviews investment
performance. The Board monitors the Investment Manager's compliance
with the Group's objectives and is directly responsible for
investment strategy and asset allocation.
The Group's exposure to other changes in market prices at 31
March 2011 on its investments was as follows:
                                                 2011         2010
                                                  GBP          GBP
 Financial assets at fair value through
  profit or loss
 - Non current investments at fair
  value through profit or loss             54,466,584   51,162,498
                                          -----------  -----------
The following table illustrates the sensitivity of the profit
and net assets to an increase or decrease of 10% in the fair values
of the Group's investments. This level of change is considered to
be reasonably possible based on observation of current market
conditions. The sensitivity analysis is based on the Group's
investments at each balance sheet date, with all other variables
held constant.
                                 2011                      2010
                         Increase      Decrease    Increase      Decrease
                          in fair       in fair     in fair       in fair
                            value         value       value         value
                              GBP           GBP         GBP           GBP
 Income statement
 Profit / (loss) for
  the year              5,446,658   (5,446,658)   5,116,250   (5,116,250)
                       ----------  ------------  ----------  ------------

 Net assets             5,446,658   (5,446,658)   5,116,250   (5,116,250)
                       ----------  ------------  ----------  ------------
(ii) Liquidity risk
This is the risk that the Group will encounter difficulty in
meeting obligations associated with financial liabilities.
The Group is faced with liquidity risk as the Group invests in
unlisted equities and other investments that may not be readily
realisable.
In accordance with the Group's policy, the Investment Manager
monitors the Company's liquidity risk, and the Board of Directors
reviews it. Details of the Group's debt instruments are disclosed
on page 9.
The table below shows the split of investments with maturity
dates of less than a year and investments with no maturity
date.
 31 March 2011      Total
                     GBP
 Less than
  1 year                   -
 No maturity
  date            54,466,584
                  54,466,584
                 -----------
The Group's financial liabilities are due to mature within one
year from the balance sheet date.
(iii) Credit risk
The Group does not have any significant exposure to credit risk
arising from any one individual party. Credit risk is spread across
a number of counterparties, each having an immaterial effect on the
Group's cash flows, should a default happen. The Group's maximum
credit risk exposure at the Consolidated Statement of Financial
Position date is represented by the respective carrying amounts of
the financial assets in the Consolidated Statement of Financial
Position.
Fair value of financial assets and financial liabilities
The fair value for each class of financial assets and
liabilities, compared with the corresponding amount in the
statement of financial position were as follows:
                                    2011                       2010
                                          Carrying                    Carrying
                           Fair value       amount    Fair value        amount
                                  GBP          GBP           GBP           GBP
 Financial assets at
  fair value through
  profit or loss
 - Non current assets      54,466,584   54,466,584    51,162,498    51,162,498
                          -----------  -----------  ------------  ------------

 - Cash and cash
  equivalents                 880,745      880,745       195,000       195,000
                          -----------  -----------  ------------  ------------

 - Overdraft                        -            -   (1,116,352)   (1,116,352)

 - Amounts due from
  brokers                   1,024,781    1,024,781        12,687        12,687
                          -----------  -----------  ------------  ------------

 - Dividends and
  interest receivable              24           24       173,230       173,230
                          -----------  -----------  ------------  ------------

 - Other receivables           75,185       75,185       102,333       102,333
                          -----------  -----------  ------------  ------------

 - Amounts due to
  brokers                           -            -      (34,632)      (34,632)
                          -----------  -----------  ------------  ------------

 - Other payables and
  accrued expenses          (565,424)    (565,424)     (456,761)     (456,761)
                          -----------  -----------  ------------  ------------
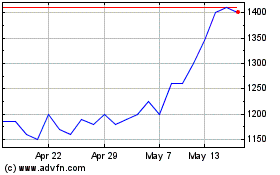
Oryx International Growth (LSE:OIG)
Historical Stock Chart
From Jun 2024 to Jul 2024

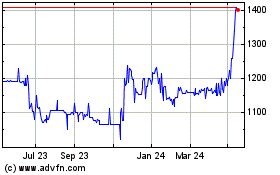
Oryx International Growth (LSE:OIG)
Historical Stock Chart
From Jul 2023 to Jul 2024
