13. Other reserves
                                       31 March                    31 March
                                           2010      Movement          2011
                                            GBP           GBP           GBP
 Net investment income                2,332,432     (332,999)     1,999,433
 Realised loss on investments        22,491,290   (3,369,053)    19,122,237
 Loss on foreign currency
  transactions                        (902,669)       129,818     (772,851)
 Unrealised gain on revaluation
  of investments held              (22,224,694)    12,904,723   (9,319,971)
 Repurchase of ordinary
  shares                            (5,525,387)   (2,516,070)   (8,041,457)
 Repurchase of warrants                 (8,179)             -       (8,179)
 Discount on repurchase
  of Convertible Loan Stock         (1,320,711)             -   (1,320,711)
                                  -------------  ------------  ------------
                                    (5,157,918)     6,816,419     1,658,501
                                  -------------  ------------  ------------
14. Share Buybacks
Between 18 June 2010 and 15 December 2010, the Company carried
out 6 share buybacks, resulting in a
total reduction of 1,945,054 shares for a cost of GBP3,488,597.
These shares were subsequently cancelled.
15. Cash Flows from Operating Activities
                                               2011           2010
                                                GBP            GBP
 Net income for the year                  9,332,489     12,238,319
                                      -------------  -------------

 Realised losses on investments           3,369,053      1,480,675
 Unrealised gain on revaluation
  of investments                       (12,904,723)   (13,432,513)
 Gain/(loss) on foreign currency
  translation                             (129,818)         18,297
                                        (9,665,488)   (11,933,541)
                                      -------------  -------------

 Purchase of investments               (26,774,670)   (26,543,064)
 Proceeds from sale of investments       31,959,528     25,873,952
                                          5,184,858      (669,112)
                                      -------------  -------------

 Decrease in dividends and interest
  receivable                                173,206        145,646
 Decrease in debtors                         27,148        266,532
 Increase in other accruals and
  payables.                                 108,663   108,341
                                      -------------  -------------
                                            309,017        520,519
                                      -------------  -------------
                                          5,160,876        156,185
                                      -------------  -------------
16. Reconciliation of Net Asset Value to Published Net Asset
Value
                                          2011                   2010
                                                 GBP                       GBP
                                                  per                      per
 Ordinary Shares                           GBP    share           GBP    share
 Published Net Asset Value          57,067,877     2.77    51,262,157     2.27
 Unrealised loss on revaluation
  of investments at bid
  / mid price (ref note
  (a) below)                       (1,036,982)   (0.05)   (1,173,154)   (0.05)
 Reduction in value of
  Subsidiary (b)                      (49,000)   (0.00)      (51,000)   (0.00)
 Performance fee accrual             (100,000)   (0.00)             -        -
 Net Asset Value attributable
  to shareholders                   55,881,895     2.72    50,038,003     2.22
                                  ------------  -------  ------------  -------
(a) In accordance with International Financial Reporting
Standards, as adopted by the European Union, the Group's long
investments have been valued at bid price in the Consolidated
Financial Statements. However, in accordance with the Group's
principal documents the Net Asset Value reported each month
reflects the investments being valued at the closing, last or
mid-market (as the Directors in all circumstances consider
appropriate) price as notified to the Group on the valuation day by
a member of the stock exchange concerned. Certain investments
remain at fair value as determined in good faith by the
Directors.
(b) The financial year end of the subsidiary is 31 December
2010. In preparing the March 2011 financial statements the December
2010 balances were used as they were not materially different to
that of March 2011. The Directors believe it is unnecessary to
change the year end of Baltimore as it wound up prior to the year
ending 31 March 2011.
17. Earnings per Share and Net Asset Value per Share
The calculation of basic earnings per share for the Ordinary
Share is based on net income of GBP9,332,489 (2010 - net income
GBP12,238,319) and the weighted average number of shares in issue
during the year of 21,082,441 shares (2010 - 22,855,527 shares). At
31 March 2011 there was no difference in the diluted earnings per
share calculation for the Ordinary Shares.
The calculation of Net Asset Value per Ordinary Share is based
on a Net Asset Value of GBP55,881,895 (2010 - GBP50,038,003) and
the number of shares in issue at the year end of 20,560,769 shares
(2010 - 22,505,825 shares). At 31 March 2011 there was no
difference in the diluted Net Asset Value per share calculation for
the Ordinary Shares.
18. Segment Information
Information on realised gains and losses derived from sales of
investments are disclosed in Note 10 to the consolidated financial
statements.
The Company is domiciled in Guernsey. All of the Company's
income from investments is from underlying funds that are
incorporated in countries other than Guernsey.
The geographical breakdown of the Company's investment portfolio
is set out on pages 8 and 9.
The Company has no non-financial assets classified as
non-current assets.
The company has a highly diversified portfolio of investments
and, except as disclosed in the Investment Adviser's report on page
5, no single investment accounts for more than 10% of the Company's
income.
The Company also has a highly diversified shareholder
population.
19. Financial Instruments and Risk Profile
An explanation of the Group's financial risk management
objectives, policies and strategy can be found in the Directors'
Report on pages 10 to 17.
The Group's financial instruments comprise its investment
portfolio (see pages 8 and 9), cash balances and amounts due from
brokers and amounts due to brokers that arise directly from its
operations. Note 2 sets out the accounting policies, including
criteria for recognition and the basis for measurement, applied to
significant financial instruments. Note 2 also includes the basis
on which income and expenses arising from financial assets and
liabilities are recognised.
The Group's financial assets comprise fixed and equity
investments, trade receivables and cash balances.
The Group finances its investment activities through the Group's
Ordinary Share capital, reserves and borrowings. The Group's
financial liabilities comprise trade payables and the loan
facility.
The main risks arising from the Company's financial instruments
are:
(i) market risk, including currency risk, interest rate risk and
other price risk;
(ii) liquidity risk; and
(iii) credit risk
The Company Secretary, in close cooperation with the Board of
Directors and the Investment Manager, coordinates the Group's risk
management. The policies for managing each of these risks are
summarised below and have been applied throughout the year.
(i) Market risk
The fair value or future cash flows of a financial instrument
held by the Group may fluctuate because of changes in market
prices. This market risk comprises currency risk, interest rate
risk and other price risk. The Board of Directors reviews and
agrees policies for managing these risks, which have remained
substantially unchanged from those applied in the year ended 31
March 2010. The Investment Manager assesses the exposure to market
risk when making each investment decision and monitors the overall
level of market risk on the whole of the investment portfolio on an
ongoing basis.
Currency risk
The functional and presentational currency of the Group is
Sterling and, therefore, the Group's principal exposure to foreign
currency risk comprises investments priced in other currencies,
principally US Dollars, New Zealand Dollars and Euros. The
Investment Manager monitors the Group's exposure to foreign
currencies and reports to the board on a regular basis. The
Investment Manager measures the risk to the Group of the foreign
currency exposure by considering the effect on the net asset value
and income of a movement in the rates of exchange to which the
Group's assets, liabilities, income and expenses are exposed.
Income denominated in foreign currencies is converted to
Sterling on receipt.
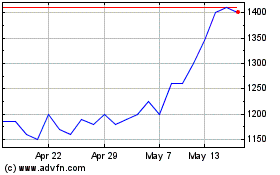
Oryx International Growth (LSE:OIG)
Historical Stock Chart
From Jun 2024 to Jul 2024

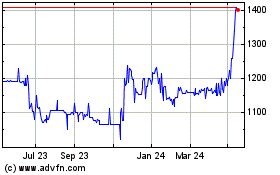
Oryx International Growth (LSE:OIG)
Historical Stock Chart
From Jul 2023 to Jul 2024
