RNS Number:0836W
Oryx International Growth Fund Ld
22 December 2005


FOR IMMEDIATE RELEASE

RELEASED BY HSBC SECURITIES SERVICES (GUERNSEY) LIMITED

ORYX INTERNATIONAL GROWTH FUND LIMITED

PRELIMINARY ANNOUNCEMENT

THE BOARD OF DIRECTORS OF ORYX INTERNATIONAL GROWTH FUND LIMITED ANNOUNCE
RESULTS FOR THE PERIOD ENDED 30 SEPTEMBER 2005:

                            UNAUDITED BALANCE SHEET

                            As at 30 September 2005

                         (Expressed in pounds sterling)


  ASSETS                                                      2005         2004
                                                                 #            #
  Bank balances                                           4,927,702    1,212,359
  Dividends and interest receivable                         143,034      172,051
  Amounts due from brokers                                  209,609       31,429
  Other receivables                                         249,047       33,623
  Listed investments at fair value through profit &
  loss (2004: market value)
  (Cost #16,052,462: 2004 - #17,626,868)                 18,290,313   18,601,484
  Unlisted investments at fair value through profit &
  loss (2004: market value)
  (Cost #3,906,297: 2004 - #1,387,764)                    5,181,451    3,233,628

  TOTAL ASSETS                                           29,001,156   23,284,574

  LIABILITIES
  Bank overdrafts                                             4,337            -
  Amounts due to brokers                                    365,640      440,125
  Creditors and accrued expenses                            101,508       74,525
  Convertible loan stock                                          -      687,709
  TOTAL LIABILITIES                                         471,485    1,202,359
  NET ASSETS                                             28,529,671   22,082,215
  REPRESENTED BY CAPITAL AND RESERVES:
  Called up share capital                                 5,333,045    5,143,159
  Share premium                                           5,678,409    5,488,522
  Capital redemption reserve                              1,246,500    1,246,500
  Other reserves                                         16,271,717   10,204,034
                                                         23,196,626   16,939,056
  TOTAL EQUITY SHAREHOLDERS' FUNDS                       28,529,671   22,082,215
  Net Asset Value per Share                                  # 2.67       # 2.15
  Fully Diluted Net Asset Value per Share                    # 2.67       # 2.07


                           UNAUDITED INCOME STATEMENT
                     For the period ended 30 September 2005
                         (Expressed in pounds sterling)
                                                              2005         2004
                                                                 #            #
  INCOME
  Deposit interest                                           90,350       28,452
  Dividends and investment income                           714,465      134,300
                                                            804,815      162,752
  EXPENDITURE
  Management and investment adviser's fee                   156,421      129,635
  Finance charge                                              7,220        9,317
  Custodian fees                                              8,807        8,933
  Administration fee                                         11,880       10,162
  Registrar and transfer agent fees                             527        2,289
  Directors' fees and expenses                               50,657       66,030
  Audit fees                                                  6,015       15,684
  Insurance                                                   4,746        5,273
  Legal and professional fees                                78,971       40,072
  Transaction costs                                          35,133            -
  Miscellaneous expenses                                     13,355       12,701
                                                            373,732      300,096
  NET INCOME/(EXPENSE) BEFORE TAXATION                      431,083    (137,344)
  Taxation                                                 (69,392)     (27,964)
  NET INCOME/(EXPENSE) FOR THE
  PERIOD AFTER TAXATION                                     361,691    (165,308)
  Realised gain on investments                            2,377,118    1,552,657
  Gain/(loss) on foreign currency translation                13,904        (549)
  Movement in unrealised gain/(loss) on
  revaluation of investments                                 10,136    (686,356)
  TOTAL SURPLUS ATTRIBUTABLE TO
  SHAREHOLDERS FOR THE PERIOD                             2,762,849      700,444
  EARNINGS PER SHARE FOR THE PERIOD                          # 0.27       # 0.09
  FULLY DILUTED EARNINGS PER SHARE FOR THE PERIOD            # 0.26       # 0.07

                        UNAUDITED STATEMENT OF CASH FLOWS
                     For the period ended 30 September 2005
                         (Expressed in pounds sterling)
                                                            2005           2004
                                                               #              #
  Net cash inflow/(outflow) from operating                250,492       (81,624)
  activities
  INVESTING ACTIVITIES
  Purchase of investments                            (10,388,446)   (10,141,885)
  Sale of investments                                  11,292,916      7,540,172
  Net cash inflow/(outflow) from investing                904,470    (2,601,713)
  activities
  FINANCING ACTIVITIES
  Payment to holders of convertible stock                       -        (8,776)
  Payment to holders of warrants                                -        (7,222)
  Payment to shareholders                                       -       (25,870)
  Shares issued on exercise of warrants                         -        687,324
  Net cash inflow from financing activities                     -        645,456
  Net cash inflow/(outflow)                             1,154,962    (2,037,881)

  RECONCILIATION OF NET CASH FLOW TO
  MOVEMENT IN NET FUNDS
  Net cash inflow/(outflow)                             1,154,962    (2,037,881)
  Exchange movements                                       13,904          (549)
  Net cash at beginning of period                       3,754,499      3,250,789
  Net cash at end of period                             4,923,365      1,212,359


                              CHAIRMAN'S STATEMENT


As you will see from the report of the Investment Manager, the first half saw
the company continuing to perform better than the benchmark. As we have said in
the past, this consistent good performance has again justified the strategy of
investing in fundamentally good businesses which are undervalued by the equity
markets where active management can assist in unlocking value.

In line with our stated policy, your Board do not propose paying a dividend,
however we have continued with our policy of buying back shares when discounts
allow.


Nigel Cayzer
Chairman


                          INVESTMENT ADVISER'S REPORT

During the six months under review, the net asset value rose by 12.3% as
compared to a rise in the FTSE Small Cap Index of 8.6%. This was encouraging
against a background where the Company maintained substantial liquid resources
and had no exposure to the speculative small cap oil companies which performed
very well during this period.

The good performance of the Company during the period can be attributed directly
to the 'active value' nature of the Company's investment policy.

Simon Group rose by over 20% and was sold; Infast was taken over at a 50%
profit; Delta rose by 15% and was sold and Highway rose by 50% and was partly
sold.

Recent new positions such as Georgica, Gleeson and Ferraris all performed well.

In the unquoted portfolio United Industries was written off due to substantial
problems in the pension fund. This was however more than offset by excellent
performance at Carwash and Nationwide Accident which were both written up during
the period.

Stock markets since the end of September have become more difficult. This should
however help create opportunities to deploy our cash resources favourably. We
are pleased to report that so far there has been no meaningful impact on the net
assets of the Company.


North Atlantic Value LLP

November 2005


                      This information is provided by RNS
            The company news service from the London Stock Exchange
END

IR KLLBLELBLFBB
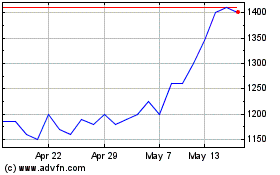
Oryx International Growth (LSE:OIG)
Historical Stock Chart
From Jun 2024 to Jul 2024

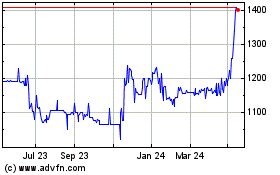
Oryx International Growth (LSE:OIG)
Historical Stock Chart
From Jul 2023 to Jul 2024
