-       6,665       6,665           -       7,546       7,546 
Income             2,517           -       2,517       1,669           -       1,669 
Investment 
 management 
 fee               (343)     (1,391)     (1,734)       (286)     (1,339)     (1,625) 
Other 
 expenses          (396)        (15)       (411)       (306)           -       (306) 
              ----------  ----------  ----------  ----------  ----------  ---------- 
Return on 
 ordinary 
 activities 
 before tax        1,778       5,259       7,037       1,077       6,207       7,284 
Tax on 
 return on 
 ordinary 
 activities        (328)         328           -       (195)         195           - 
              ----------  ----------  ----------  ----------  ----------  ---------- 
Return on 
 ordinary 
 activities 
 after tax         1,450       5,587       7,037         882       6,402       7,284 
              ----------  ----------  ----------  ----------  ----------  ---------- 
Return per          1.8p        6.8p        8.6p        1.2p        9.1p       10.3p 
 share 
 
   RECONCILIATION OF MOVEMENTS IN SHAREHOLDERS' FUNDS 
 
   for the year ended 31 March 2014 


                                                Year ended      Year ended 
                                               31 March 2014   31 March 2013 
                                                  GBP000          GBP000 
Equity shareholders' funds at 1 April 2013            62,844          55,128 
Return on ordinary activities after tax                7,037           7,284 
Dividends recognised in the year                     (7,608)         (3,845) 
Net proceeds of share issues                          15,149           4,923 
Shares re-purchased for cancellation                   (834)           (646) 
                                                  ----------      ---------- 
Equity shareholders' funds at 31 March 2014           76,588          62,844 
                                                  ----------      ---------- 
 
   BALANCE SHEET 
 
   as at 31 March 2014 


                                                  31 March 2014  31 March 2013 
                                                      GBP000         GBP000 
Fixed assets: 
  Investments                                            51,836         45,402 
                                                     ----------     ---------- 
Current assets: 
  Debtors                                                   363            557 
  Cash and deposits                                      25,417         18,088 
                                                     ----------     ---------- 
                                                         25,780         18,645 
Creditors (amounts falling due within one year)         (1,028)        (1,203) 
                                                     ----------     ---------- 
Net current assets                                       24,752         17,442 
                                                     ----------     ---------- 
 
Net assets                                               76,588         62,844 
                                                     ----------     ---------- 
 
 
Capital and reserves: 
Called-up equity share capital                            4,562          3,700 
Share premium                                               377         27,618 
Capital redemption reserve                                    7            767 
Capital reserve                                          62,007         22,636 
Revaluation reserve                                       9,298          7,351 
Revenue reserve                                             337            772 
                                                     ----------     ---------- 
Total equity shareholders' funds                         76,588         62,844 
                                                     ----------     ---------- 
Net asset value per share                                 83.9p          84.9p 
 
   CASH FLOW STATEMENT 
 
   for the year ended 31 March 2014 


                                           Year ended                    Year ended 
                                          31 March 2014               31 March 2013 
                                       GBP000      GBP000      GBP000      GBP000 
Cash flow statement 
Net cash inflow/(outflow) from 
 operating activities                                   391                   (573) 
Taxation: 
Corporation tax paid                                      -                    (74) 
Financial investment: 
Purchase of 
 investments                            (9,933)                 (9,730) 
Sale/repayment of investments            10,164                  12,917 
                                     ----------              ---------- 
Net cash inflow from financial 
 investment                                             231                   3,187 
Equity dividends paid                               (7,608)                 (3,845) 
                                                 ----------              ---------- 
Net cash outflow before financing                   (6,986)                 (1,305) 
Financing: 
Issue of shares                          15,505                   5,086 
Share issue expenses                      (356)                   (163) 
Shares re-purchased for 
 cancellation                             (834)                   (646) 
                                     ----------              ---------- 
Net cash inflow from financing                       14,315                   4,277 
                                                 ----------              ---------- 
Increase in cash and 
 deposits                                             7,329                   2,972 
                                                 ----------              ---------- 
Reconciliation of return before tax 
to net cash flow from operating 
 activities 
Return on ordinary activities 
 before tax                                           7,037                   7,284 
Gain on disposal of 
 investments                                        (2,695)                 (2,497) 
Movements in fair 
 value of 
 investments                                        (3,970)                 (5,049) 
(Increase)/decrease 
 in debtors                                             194                   (246) 
Decrease in creditors                                 (175)                    (65) 
                                                 ----------              ---------- 
Net cash inflow/(outflow) from 
 operating activities                                   391                   (573) 
                                                 ----------              ---------- 
Reconciliation of 
 movement in net 
 funds 
                       1 April 2013              Cash flows           31 March 2014 
                             GBP000                  GBP000                  GBP000 
Cash and deposits            18,088                   7,329                  25,417 
                         ----------              ----------              ---------- 
 
   INVESTMENT PORTFOLIO SUMMARY 
 
   as at 31 March 2014 


                                                                      % of 
                                              Cost     Valuation    net assets 
                                             GBP000      GBP000      by value 
Venture capital investments: 
Kerridge Commercial Systems                     1,593       7,605          9.9 
Volumatic Holdings                              2,095       3,187          4.2 
Advanced Computer Software Group*                 382       2,691          3.5 
Wear Inns                                       1,868       2,386          3.1 
Silverwing                                      1,388       2,025          2.6 
Tinglobal Holdings                              1,812       1,941          2.5 
No 1 Traveller                                  1,629       1,629          2.1 
Arleigh Group                                     619       1,573          2.1 
Intuitive Holding                               1,508       1,533          2.0 
Buoyant Upholstery                              1,509       1,509          2.0 
Control Risks Group Holdings                      746       1,363          1.8 
Cawood Scientific                               1,031       1,348          1.8 
Kitwave One                                     1,246       1,288          1.7 
It's All Good                                   1,145       1,145          1.5 
Haystack Dryers                                 1,497       1,103          1.4 
                                           ----------  ----------     -------- 
Fifteen largest venture capital 
 investments                                   20,068      32,326         42.2 
Other venture capital investments              14,567      11,117         14.5 
                                           ----------  ----------     -------- 
Total venture capital investments              34,635      43,443         56.7 
Listed equity investments                       4,048       4,567          6.0 
Listed fixed-interest investments               3,855       3,826          5.0 
                                           ----------  ----------     -------- 
Total fixed asset investments                  42,538      51,836         67.7 
                                           ---------- 
Net current assets                                         24,752         32.3 
                                                       ----------     -------- 
Net assets                                                 76,588        100.0 
                                                       ----------     -------- 
 
 
   *Quoted on AIM 
 
   BUSINESS RISKS 
 
   The board carries out a regular review of the risk environment in which 
the company operates.  The main areas of risk identified by the board 
are as follows: 
 
   Investment risk:  Many of the company's investments are in small and 

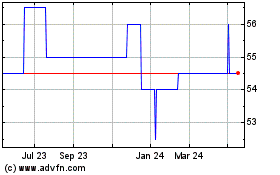
Northern 2 Vct (LSE:NTV)
Historical Stock Chart
From Jun 2024 to Jul 2024 Click Here for more Northern 2 Vct Charts.
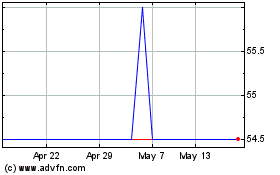
Northern 2 Vct (LSE:NTV)
Historical Stock Chart
From Jul 2023 to Jul 2024 Click Here for more Northern 2 Vct Charts.