  income for the
  period                          -          -          -         (220)          -       (971)   (1,191)
                          ---------  ---------  ---------  ------------  ---------  ----------  --------

 At 31 December
  2011                        6,066      6,396      7,371         (113)      (358)     (5,207)    14,155
                          =========  =========  =========  ============  =========  ==========  ========
Condensed Consolidated Balance Sheet
at 30 June 2012
                                                   30 June
                                         --------------------------
                                                 2012          2011       31 December
                                          (unaudited)   (unaudited)              2011
                                  Notes       GBP'000       GBP'000           GBP'000
-------------------------------  ------  ------------  ------------      ------------
 Non-current
  assets
 Goodwill                                      13,622        13,425            13,567
 Other intangible
  assets                                        2,129         2,592             2,338
 Property, plant and
  equipment                                     7,570         8,863             7,909
 Deferred tax
  assets                                        1,194         2,065             1,289
 Other non-current
  assets                                          865             -               800
 Total non-current
  assets                                       25,380        26,945            25,903
-------------------------------  ------  ------------  ------------      ------------
 Current assets
 Inventories                                    2,254         3,526             2,281
 Trade and other receivables                    7,084        11,335             8,394
 Current tax
  assets                                           85             -                 -
 Cash and cash equivalents                      1,673         5,456             4,748
 Other current
  assets                                          460             -               400
 Assets of disposal
  group held for sale                               -           894               440
 Total current
  assets                                       11,556        21,211            16,263
-------------------------------  ------  ------------  ------------      ------------
 Total assets                                  36,936        48,156            42,166
-------------------------------  ------  ------------  ------------      ------------
 Current liabilities
 Bank overdraft                     8         (3,633)             -                 -
 Borrowings                         8           (900)         (900)           (5,900)
 Obligations under
  finance leases                                (161)         (147)             (141)
 Trade and other payables                     (5,285)       (8,203)           (6,618)
 Provisions                                      (20)           (8)              (60)
 Current tax
  liabilities                                   (191)         (102)              (87)
 Accruals and deferred
  income                                      (5,432)       (6,435)           (6,355)
 Total current
  liabilities                                (15,622)      (15,795)          (19,161)
-------------------------------  ------  ------------  ------------      ------------
 Non-current
  liabilities
 Borrowings                         8         (2,475)      (13,175)           (2,925)
 Obligations under
  finance leases                                (379)         (270)             (359)
 Deferred tax
  liabilities                                   (396)          (27)             (421)
 Non-current
  provisions                                     (86)             -              (73)
 Other non-current
  liabilities                                   (111)         (123)             (113)
 Retirement benefit
  obligation                                  (4,975)       (7,942)           (4,959)
 Total non-current
  liabilities                                 (8,422)      (21,537)           (8,850)
-------------------------------  ------  ------------  ------------      ------------
 Total liabilities                           (24,044)      (37,332)   -      (28,011)
-------------------------------  ------  ------------  ------------      ------------
 Net assets                                    12,892        10,824            14,155
===============================  ======  ============  ============      ============


   Equity
 Share capital                                  6,066         6,066             6,066
 Share premium
  account                                       6,396         6,396             6,396
 Merger reserve                                 7,371         7,371             7,371
 Translation
  reserve                                       (139)           119             (113)
 Other reserve                                  (358)         (358)             (358)
 Retained earnings                            (6,444)       (8,770)           (5,207)
 Equity attributable to shareholders
  of the parent                                12,892        10,824            14,155
=======================================  ============  ============      ============
Condensed Consolidated Statement of Cash Flows
for the financial period ended 30 June 2012
                                                 6 months to            18 months
                                                   30 June                  ended
                                         --------------------------
                                                 2012          2011   31 December
                                          (unaudited)   (unaudited)          2011
                                  Notes       GBP'000       GBP'000       GBP'000
-------------------------------  ------  ------------  ------------  ------------
 Cash flows from operating
  activities
 Loss before interest
  and tax                                       (429)       (3,426)       (7,232)
 Depreciation and impairment
  charge                                          556         1,189         3,078
 Amortisation and impairment
  charge                                          260           361           926
 Profit on sale of property,
  plant and equipment                             (4)           (5)         (345)
 Retirement benefit
  obligation                                    (402)         (463)       (1,664)
 Decrease in provisions                          (27)         (447)         (987)
 Cash used in operations
  before working capital movements               (46)       (2,791)       (6,224)
 Decrease in trade and
  other receivables                             1,517         2,955         5,586
 Decrease in inventories
  and work in progress                             24           221           957
 Decrease in trade and
  other payables                              (2,163)       (2,828)       (7,395)
 Cash used in
  operations                                    (668)       (2,443)       (7,076)
 Interest
  paid                                           (66)          (94)         (278)
 Interest received                                 26           119           344
 Income tax paid                                (238)         (173)          (59)
 Net cash outflow from
  operating activities                          (946)       (2,591)       (7,069)
-------------------------------  ------  ------------  ------------  ------------

 Net cash used in investing
  activities
 Purchase of intangible
  assets                                         (64)          (61)         (329)
 Purchase of property,
  plant and equipment                           (129)         (251)         (992)
 Acquisition of subsidiary
  undertakings net of cash
  acquired                          9            (46)             -         (316)
 Proceeds from sale of
  property, plant, equipment
  and intangible assets                            45            98           908
 Sale of business net
  of expenses                                       -             -         6,134
 Net cash (outflow)/inflow
  from investing activities                     (194)         (214)         5,405
---------------------------------------  ------------  ------------  ------------

 Net cash used in financing
  activities
 Proceeds from
  new bank loan                                     -         4,900         6,600
 Repayment of
  bank loans                                  (5,450)         (225)       (5,675)
 Repayments of obligations
  under finance leases                           (86)         (160)         (456)
 Net cash (outflow)/inflow
  from financing activities                   (5,536)         4,515           469
---------------------------------------  ------------  ------------  ------------

 Net (decrease)/increase
  in cash and cash equivalents                (6,676)         1,710       (1,195)
-------------------------------  ------  ------------  ------------  ------------

 Cash and cash equivalents
  at beginning of period                        4,748         3,746         6,009
 Effects of changes in
  foreign exchange rates                         (32)             -          (66)
 Cash and cash equivalents
  at end of period                            (1,960)         5,456         4,748
-------------------------------  ------  ------------  ------------  ------------

 Cash and cash equivalents
  comprise:
 Cash and short
  term deposits                                 1,673         5,456         4,748
 Bank overdrafts                              (3,633)             -             -
                                              (1,960)         5,456         4,748
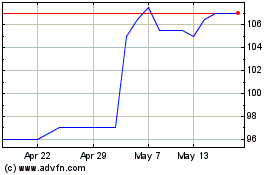
Eleco Public (LSE:ELCO)
Historical Stock Chart
From May 2024 to Jun 2024

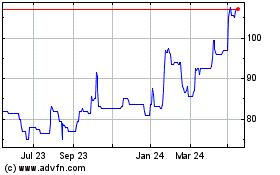
Eleco Public (LSE:ELCO)
Historical Stock Chart
From Jun 2023 to Jun 2024
