TIDMDWHT
RNS Number : 2267F
Dewhurst PLC
13 June 2012
Dewhurst plc
Interim Results for the 6 months ended 31 March 2012
Directors' Interim Report
FIRST HALF
Group turnover was up 34% at GBP26.0 million compared to GBP19.4
million last year and profit before tax increased 45% to GBP2.9
million (2011: GBP2.0 million). The first half profit includes a
net gain of GBP0.4 million from the sale of property offset by
goodwill impairments detailed below. Operating profit before these
exceptional items improved 25% to GBP2.6 million (2011: GBP2.1
million). Earnings per share increased 47% to 24.2p (2011:
16.4p).
Sales improvements were broadly based with increases in all
three major product groups and growth both in the UK and overseas.
Part of the increase in sales in the keypad division is as a result
of the change in product content previewed in last year's annual
report.
During the first half we moved the headquarters and factory to
our new home in Feltham. We also sold our old premises at Inverness
Road, Hounslow. There was a gain of GBP3.9m on the sale of the old
premises, which the Directors believe qualifies for Capital Gains
Tax roll-over relief. These results have been prepared on that
basis.
Although we have seen a recovery in the performance of TMP, our
traffic products company, this is insufficient to support the
goodwill on acquisition and it has been written down substantially.
We have taken action to improve the performance of our US
acquisition, ERM, but that business is still not generating
sufficient profit to support its goodwill on acquisition, so that
has also been written off. Despite the write downs we remain
committed to these businesses and consider they can make an
important contribution to the group in the future.
OUTLOOK
Currently sales remain healthy, but market confidence is
fragile. The economic news in the press is remorselessly gloomy, so
we feel this must impact on our demand at some point. Contacts in
the UK industry point to a dearth of new projects commencing and
this will feed through to us in time. Overseas demand seems
steadier, though subject to the same concerns regarding
fragility.
The sale of the premises has put our cash position back on a
sound footing. Whilst we are committed by the agreed funding plan
to direct some of this cash towards the pension fund over the next
few years, we are well placed to continue our investment in new
products and take advantage of any other growth opportunities that
arise.
DIVIDENDS
The Directors have declared an interim dividend of 2.34p which
amounts to GBP199,000, compared with 2.23p last year (GBP190,000).
The interim dividend is payable on 28 August 2012 and will be
posted on 23 August 2012 to shareholders appearing in the Register
at 3:00 p.m. on 13 July 2012 (ex-dividend date being 11 July
2012).
A final 2011 dividend of 4.46p which amounted to GBP380,000,
compared with 4.24p previous year (GBP361,000) was approved at the
AGM held on 26 January 2012 and was paid on 14 February 2012 to
members on the register at 13 January 2012.
By Order of the Board
J C SINCLAIR
Finance Director & Secretary
12 June 2012
 Consolidated income statement        Half year    Half year           Year
                                          ended        ended          ended
                                       31 March     31 March   30 September
                                           2012         2011           2011
 Continuing operations               GBP(000)'s   GBP(000)'s     GBP(000)'s

 Revenue                                 25,997       19,409         41,487

 Operating costs                       (22,981)     (17,359)       (37,063)
----------------------------------  -----------  -----------  -------------
 Operating profit before goodwill
  write down and
  gain on disposal of property            2,568        2,050          4,880
 Goodwill write down                    (3,498)            -          (456)
 Gain on disposal of property             3,946            -              -
 Operating profit                         3,016        2,050          4,424

 Share of loss from associates                -         (21)           (29)

 Finance income                              32           37             62
 Finance costs                            (152)         (63)          (137)
----------------------------------  -----------  -----------  -------------

 Profit before taxation                   2,896        2,003          4,320
 Tax on profits                      Est. (840)   Est. (605)        (1,428)
----------------------------------  -----------  -----------  -------------

 Profit for the period                    2,056        1,398          2,892
----------------------------------  -----------  -----------  -------------
 Attributable to:
 Equity shareholders of the
  Company                                 2,077        1,411          2,924
 Non-controlling interests                 (21)         (13)           (32)
----------------------------------  -----------  -----------  -------------
                                          2,056        1,398          2,892
----------------------------------  -----------  -----------  -------------

 Basic and diluted earnings
  per share                              24.16p       16.43p         33.98p
 Dividends per share                      2.34p        2.23p          6.69p


 Consolidated statement of               Half year    Half year           Year
  recognised income and expense              ended        ended          ended
                                          31 March     31 March   30 September
  Net income/(expense) recognised             2012         2011           2011
 directly in equity:                    GBP(000)'s   GBP(000)'s     GBP(000)'s
-------------------------------------  -----------  -----------  -------------
 Actuarial gains/(losses)
  on the defined
  benefit pension scheme                  Est. 768     Est. 583        (2,423)
 Exchange differences on translation
  of foreign operations                        104          558           (41)
 Tax on items taken directly
  to equity                                  (227)        (319)            640
-------------------------------------  -----------  -----------  -------------
 Net income / (expense) recognised
  directly in equity in the
  period                                       645          822        (1,824)
 Profit for the financial
  period                                     2,056        1,398          2,892
-------------------------------------  -----------  -----------  -------------
 Total recognised income and
  expense
 for the period                              2,701        2,220          1,068
-------------------------------------  -----------  -----------  -------------
 Attributable to:
 Equity shareholders of the
  Company                                    2,721        2,242          1,071
 Non-controlling interests                    (20)         (22)            (3)
-------------------------------------  -----------  -----------  -------------
                                             2,701        2,220          1,068
-------------------------------------  -----------  -----------  -------------


 Consolidated balance sheet        Half year    Half year           Year
                                       ended        ended          ended
                                    31 March     31 March   30 September
                                        2012         2011           2011
                                  GBP(000)'s   GBP(000)'s     GBP(000)'s
 Non-current assets
 Goodwill                              3,980        7,814          7,357
 Other intangibles                       122          184            158
 Property, plant and equipment         9,808        8,812          9,581
 Deferred tax asset                    1,408        1,097          1,779
                                      15,318       17,907         18,875
 Current assets
 Inventories                           4,505        4,046          4,269
 Trade and other receivables          10,032        8,704          8,394
 Current tax assets                        -            -            203
 Cash and cash equivalents             9,982        3,098          5,009
-------------------------------  -----------  -----------  -------------
                                      24,519       15,848         17,875
-------------------------------  -----------  -----------  -------------
 Total assets                         39,837       33,755         36,750
-------------------------------  -----------  -----------  -------------


 Current liabilities
 Trade and other payables              6,970        3,420          5,222
 Current tax liabilities                 237           41              -
 Short term provisions                   596          421            475
-------------------------------  -----------  -----------  -------------
                                       7,803        3,882          5,697
-------------------------------  -----------  -----------  -------------
 Non-current liabilities
 Retirement benefit obligation         7,979        6,927          9,299
 Total liabilities                    15,782       10,809         14,996

 Net assets                           24,055       22,946         21,754
-------------------------------  -----------  -----------  -------------

 Equity
 Share capital                           851          851            851
 Share premium account                   157          157            157
 Capital redemption reserve              286          286            286
 Translation reserve                   2,137        2,468          2,059
 Retained earnings                    20,495       18,994         18,252
-------------------------------  -----------  -----------  -------------
 Total attributable to equity
  shareholders of the Company         23,926       22,756         21,605
-------------------------------  -----------  -----------  -------------
 Non-controlling interests               129          190            149
-------------------------------  -----------  -----------  -------------

 Total equity                         24,055       22,946         21,754
-------------------------------  -----------  -----------  -------------


 Consolidated cash flow statement       Half year    Half year           Year
                                            ended        ended          ended
                                         31 March     31 March   30 September
                                             2012         2011           2011
                                       GBP(000)'s   GBP(000)'s     GBP(000)'s

 Cash flows from operating
  activities
 Operating profit                           3,016        2,050          4,424
 Goodwill write down                        3,498            -            456
 Depreciation and amortisation                300          303            812
 Additional income to pension
  scheme                                    (640)        (579)        (1,313)
 Exchange adjustments                         (7)          166          (208)
 (Profit)/loss on disposal
  of
  property, plant and equipment           (3,946)            -            (4)
------------------------------------  -----------  -----------  -------------
                                            2,221        1,940          4,167
 (Increase)/decrease in inventories         (236)          424            202
 (Increase)/decrease in trade
  and other receivables                   (1,638)      (1,005)          (674)
 Increase/(decrease) in trade
  and other payables                        1,748      (1,190)            191
 Increase/(decrease) in provisions            121           72            126
 Cash generated from operations             2,216          241          4,012
 Interest paid                                (2)            -           (16)
 Income tax paid                            (418)        (470)        (1,095)
------------------------------------  -----------  -----------  -------------
 Net cash from operating activities         1,796        (229)          2,901

 Cash flows from investing
  activities
 Proceeds from sale of associate                -          667              -
  undertaking
 Acquisition of subsidiary
  undertakings                                  -      (1,955)          (869)
 Acquisition of business and
  assets                                        -        (919)          (907)
 Proceeds from sale of property,
  plant and equipment                       4,538            8              7
 Purchase of property, plant
  and equipment                           (1,061)      (3,870)        (5,124)
 Development costs capitalised                  -            -          (129)
 Interest received                             32           37             61
------------------------------------  -----------  -----------  -------------
 Net cash used in investing
  activities                                3,509      (6,032)        (6,961)

 Cash flows from financing
  activities
 Dividends paid                             (380)        (361)          (551)
 Net cash used in financing
  activities                                (380)        (361)          (551)

 Net increase/(decrease) in
  cash and cash equivalents                 4,925      (6,622)        (4,611)

 Cash and cash equivalents
  at beginning of period                    5,009        9,593          9,593
------------------------------------  -----------  -----------  -------------
 Exchange adjustments on cash
  and cash equivalents                         48          127             27
------------------------------------  -----------  -----------  -------------
 Cash and cash equivalents
  at end of period                          9,982        3,098          5,009
------------------------------------  -----------  -----------  -------------
These half-year condensed financial statements are unaudited and
do not constitute statutory accounts within the meaning of Section
435 of the Companies Act 2006. The results for the 2011 year set
out above are abridged. Full accounts for that year reported under
IFRS, on which the auditors of the Company made an unqualified
report have been delivered to the Registrar of Companies.
The presentation of these Interim Financial Statements is
consistent with the 2011 Financial Statements and its accounting
policies, but where necessary comparative information has been
reclassified or expanded from the 2011 Interim Financial Statements
to take into account any presentational changes made in the 2011
Financial Statements or in these Interim Financial Statements.
For further information, please contact:
 Dewhurst Plc                      Tel: +44 (0)20 8744
                                    8251
--------------------------------  --------------------
 Richard Dewhurst / Jared
  Sinclair
--------------------------------  --------------------

 Seymour Pierce Limited            Tel: +44 (0)20 7107
                                    8000
--------------------------------  --------------------
 Freddy Crossley / David
  Foreman (Corporate Finance)
--------------------------------  --------------------
 Paul Jewell (Corporate Broking)
--------------------------------  --------------------
This information is provided by RNS
The company news service from the London Stock Exchange
END
IR FTMATMBABBMT
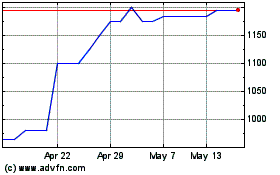
Dewhurst (LSE:DWHT)
Historical Stock Chart
From Jun 2024 to Jul 2024

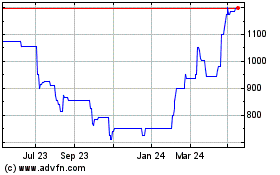
Dewhurst (LSE:DWHT)
Historical Stock Chart
From Jul 2023 to Jul 2024
