Crystal Amber Fund Limited Monthly Net Asset Value
September 10 2019 - 9:44AM
UK Regulatory
TIDMCRS

10 September 2019


                          CRYSTAL AMBER FUND LIMITED

                     ("Crystal Amber Fund" or the "Fund")

                            Monthly Net Asset Value


Crystal Amber Fund announces that its unaudited net asset value ("NAV") per
share at 31 August 2019 was 224.06 pence (31 July 2019: 234.81 pence per
share).

The proportion of the Fund's NAV at 31 August 2019 represented by the ten
largest shareholdings, other investments and cash (including accruals), was as
follows:

Ten largest shareholdings      Pence per share Percentage of investee equity
                                               held

Hurricane Energy plc           48.1            5.2%

Equals Group plc               42.6            21.6%

Northgate plc                  37.7            8.3%

GI Dynamics Inc.               20.6            68.5%

De La Rue plc                  15.7            6.7%

STV Group plc                  12.5            8.5%

Allied Minds plc               10.1            6.9%

Board Intelligence Ltd*        5.8             *

Leaf Clean Energy Co           4.7             25.3%

Kenmare Resources plc          4.3             1.5%

Total of ten largest           202.1
shareholdings

Other investments              20.4

Cash and accruals              1.6

Total NAV                      224.1

*Board Intelligence Ltd is a private company and its shares are not listed on a
stock exchange. Therefore, the percentage held is not disclosed.

For further enquiries please contact:

Crystal Amber Fund Limited

Chris Waldron (Chairman)

Tel: 01481 742 742

www.crystalamber.com

Allenby Capital Limited - Nominated Adviser

David Worlidge/Liz Kirchner

Tel: 020 3328 5656

Winterflood Investment Trusts - Broker

Joe Winkley/Neil Langford

Tel: 020 3100 0160

Crystal Amber Advisers (UK) LLP - Investment Adviser

Richard Bernstein

Tel: 020 7478 9080


END
(END) Dow Jones Newswires
September 10, 2019 09:44 ET (13:44 GMT)
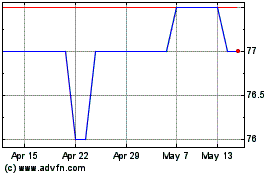
Crystal Amber (LSE:CRS)
Historical Stock Chart
From Jun 2024 to Jul 2024

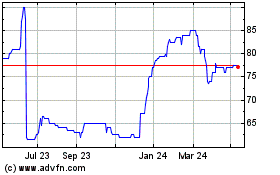
Crystal Amber (LSE:CRS)
Historical Stock Chart
From Jul 2023 to Jul 2024
