TIDMBXP
RNS Number : 4121S
Beximco Pharmaceuticals Ltd
06 November 2023
6 November 2023
This announcement contains inside information as stipulated
under the UK version of the Market Abuse Regulation 596/2014 which
is part of English Law by virtue of the European (Withdrawal) Act
2018, as amended. On publication of this announcement via a
regulatory information service, this information is considered to
be in the public domain.
BEXIMCO PHARMACEUTICALS LIMITED
Financial Results for the First Quarter Ended 30 September
2023
Beximco Pharmaceuticals Limited ("Beximco Pharma", "BPL" or "the
Company"; AIM Symbol: BXP, LEI No.:213800IMBBD6TIOQGB56), the
fast-growing manufacturer of generic pharmaceutical products and
active pharmaceutical ingredients, today announces its unaudited
results for the three-month period ended 30 September 2023. The
information set out below has been released to the Dhaka and
Chittagong Stock Exchanges in compliance with the requirements from
the Bangladesh SEC.
Beximco Pharma Managing Director Nazmul Hassan MP commented:
"Amidst challenges, we delivered strong growth in revenue in
this first quarter. The ongoing macro-economic headwinds,
especially the devaluation of currency and high inflationary
pressures, weigh on our bottom line and somewhat overshadow our
accomplishment. That said, we remain confident in the strength of
the business and our strategy as we continue to focus on growth
through the delivery of high-quality, affordable medicines to
patients."
The detailed accounts can be viewed at the Company website: www.beximcopharma.com
For further information please visit www.beximcopharma.com or
enquire to:
Beximco Pharma
Nazmul Hassan MP, Managing Director
Tel: +880 2 586/11001, Ext.20080
S M Rabbur Reza, Chief Operating Officer
Tel: +880 2 58611001, Ext.20111
Mohammad Ali Nawaz, Chief Financial Officer
Tel: +880 2 58611001, Ext.20030
SPARK Advisory Partners Limited (Nominated Adviser)
Mark Brady / Andrew Emmott
Tel: +44 (0) 20 3368 3551 / 3555
SP Angel Corporate Finance LLP (Broker)
Matthew Johnson
Tel: +44 (0) 20 3470 0470
FTI Consulting
Simon Conway / Victoria Foster Mitchell
Tel: +44 (0) 20 3727 1000
Notes to Editors
About Beximco Pharmaceuticals Limited
Beximco Pharma is a leading manufacturer and exporter of
medicines based in Bangladesh. Since its inception in 1976, the
Company remains committed to health and wellbeing of people across
all the continents by providing access to contemporary medicines.
Company's broad portfolio of generics encompasses diverse delivery
systems such as tablets, capsules, liquids, semi-solids,
intravenous fluids, metered dose inhalers, dry powder inhalers,
sterile ophthalmic drops, insulins, prefilled syringes,
injectables, nebuliser solutions, oral soluble films etc. The
Company also undertakes contract manufacturing for multinational
and leading global generic pharmaceutical companies.
Beximco Pharma's state-of-the-art manufacturing facilities are
certified by global regulatory authorities of USA, Europe,
Australia, Canada, GCC and Latin America, among others and it has a
geographic footprint in more than 50 countries. More than 5,500
employees are driving the company towards achieving its aspiration
to be among the most admired companies in the world.
Beximco Pharmaceuticals Limited and its Subsidiaries
Consolidated Statement of Financial Position (Un-audited)
As at September 30, 2023
                                                           Taka '000
                                               September    June 30,
                                                30, 2023        2023
ASSETS
  Non-Current Assets                          48,409,531  48,280,929
    Property, Plant and Equipment- Carrying
     Value                                    42,356,471  42,245,615
    Right-of-use Assets                          538,197     562,224
    Intangible Assets                          4,766,816   4,721,035
    Deferred Tax Asset                            52,504      56,512
    Goodwill                                     674,570     674,570
    Other Investments                             20,973      20,973

    Current Assets                            20,942,045  20,875,854
    Inventories                               11,958,465  12,133,278
    Spares & Supplies                            888,249     819,740
    Accounts Receivable                        3,671,221   3,574,655
    Loans, Advances and Deposits               3,049,766   2,984,877
    Advance Income Tax                           230,467     227,618
    Short Term Investment                        200,000           -
    Cash and Cash Equivalents                    943,877   1,135,686
                                              ----------  ----------
TOTAL ASSETS                                  69,351,576  69,156,783
                                              ----------  ----------

SHAREHOLDERS' EQUITY AND LIABILITIES
  Equity Attributable to the Owners of
   the Company                                45,233,894  43,680,704
    Issued Share Capital                       4,461,121   4,461,121
    Share Premium                              5,269,475   5,269,475
    Excess of Issue Price over Face Value
     of GDRs                                   1,689,637   1,689,637
    Capital Reserve on Merger                    294,951     294,951
    Revaluation Surplus                        1,140,210   1,141,178
    Unrealized Gain/(Loss)                        18,148      18,148
    Retained Earnings                         32,360,352  30,806,194
Non-Controlling Interest                       3,953,454   3,938,962
TOTAL EQUITY                                  49,187,348  47,619,666
  Non-Current Liabilities                      8,383,552   8,272,093
    Long Term Borrowings-Net of Current
     Maturity                                  2,306,715   2,550,833
    Liability for Gratuity, Pension and
     WPPF & Welfare Funds                      3,535,080   3,170,764
    Deferred Tax Liability                     2,541,757   2,550,496

    Current Liabilities and Provisions        11,780,676  13,265,024
    Short Term Borrowings                      4,732,715   6,621,170
    Long Term Borrowings-Current Maturity      1,468,445   1,439,895
    Creditors and Other Payables               3,706,475   3,531,707
    Accrued Expenses                           1,032,588   1,129,700
    Dividend Payable / Unclaimed Dividend         88,235      88,465
    Income Tax Payable                           752,218     454,087
                                              ----------  ----------
TOTAL EQUITY AND LIABILITIES                  69,351,576  69,156,783
                                              ----------  ----------
Beximco Pharmaceuticals Limited and its Subsidiaries
Consolidated Statement of Profit or Loss and Other Comprehensive
Income (Un-audited)
For the Period July - September 2023
                                                                    Taka '000
                                             July -September  July -September
                                                        2023             2022

Net Revenue                                       11,159,367        9,787,202
Cost of Goods Sold                               (6,251,512)      (5,351,036)
                                             ---------------  ---------------
Gross Profit                                       4,907,855        4,436,166
                                             ---------------  ---------------

Operating Expenses                               (2,598,458)      (2,313,283)
                                             ---------------  ---------------
Administrative Expenses                            (304,684)        (274,747)
Selling, Marketing and Distribution
 Expenses                                        (2,293,774)      (2,038,536)
                                             ---------------  ---------------
Profit from Operations                             2,309,397        2,122,883
Other Income                                         144,875          168,042
Finance Cost                                       (297,754)        (310,973)
Profit Before Contribution to WPPF
 & Welfare Funds                                   2,156,518        1,979,952
Contribution to WPPF & Welfare Funds               (103,572)         (98,210)
                                             ---------------  ---------------
Profit Before Tax                                  2,052,946        1,881,742
Income Tax Expenses                                (485,545)        (469,029)
                                             ---------------  ---------------
Current Tax                                        (489,995)        (393,848)
Deferred Tax                                           4,450         (75,181)
                                             ---------------  ---------------
Profit After Tax                                   1,567,401        1,412,713
Profit/(Loss) Attributable to:
                                             ---------------  ---------------
Owners of the Company                              1,552,909        1,447,027
Non-Controlling Interest                              14,492         (34,314)
                                             ---------------  ---------------
                                                   1,567,401        1,412,713
Other Comprehensive Income/(Loss)                          -          (3,340)
                                             ---------------  ---------------
Total Comprehensive Income                         1,567,401        1,409,373
Total Comprehensive Income Attributable
 to:
                                             ---------------  ---------------
Owners of the Company                              1,552,909        1,443,687
Non-Controlling Interest                              14,492         (34,314)
                                             ---------------  ---------------
                                                   1,567,401        1,409,373
                                             ===============  ===============
Earnings Per Share
 (EPS)                                  Tk.             3.48             3.24
                                             ===============  ===============
Number of Shares                       Nos.      446,112,089      446,112,089
Beximco Pharmaceuticals Limited and its Subsidiaries
Consolidated Statement of Changes in Equity (Un-audited)
For the Period July - September 2023
As at September 30, 2023
                                                                                                                               Taka '000
----------------------------------------------------------------------------------------------------------------------------------------
                Share      Share      Excess     Capital    Revaluation    Unrealized  Retained    Equity        Non-         Total
                 Capital    Premium    of Issue  Reserve     Surplus        Gain/       Earnings   attributable  Controlling   Equity
                                       Price     on Merger                  (Loss)                 to Owners     Interests
                                       over                                                        of the
                                       Face                                                        Company
                                       Value
                                       of GDRs
                ---------  ---------  ---------  ---------  -------------  ----------  ----------  ------------  -----------  ----------
Balance
 as on July
 01, 2023       4,461,121  5,269,475  1,689,637    294,951      1,141,178      18,148  30,806,194    43,680,704    3,938,962  47,619,666
                ---------  ---------  ---------  ---------  -------------  ----------  ----------  ------------  -----------  ----------
Total
Comprehensive
Income:
                ------------------------------------------------------------------------------------------------------------------------
Profit/(Loss)
 for the
 Period                 -          -          -          -              -           -   1,552,909     1,552,909       14,492   1,567,401
                ---------  ---------  ---------  ---------  -------------  ----------  ----------  ------------  -----------  ----------
Other                   -          -          -          -              -           -           -             -            -           -
Comprehensive
Income/(Loss)
                ---------  ---------  ---------  ---------  -------------  ----------  ----------  ------------  -----------  ----------

Adjustment
 for
 Depreciation
 on Revalued
 Assets                 -          -          -          -        (1,249)           -       1,249             -            -           -
                ---------  ---------  ---------  ---------  -------------  ----------  ----------  ------------  -----------  ----------
Adjustment
 for Deferred
 Tax on
 Revalued
 Assets                 -          -          -          -            281           -           -           281            -         281
                ---------  ---------  ---------  ---------  -------------  ----------  ----------  ------------  -----------  ----------
Balance
 as on
 September
 30, 2023       4,461,121  5,269,475  1,689,637    294,951      1,140,210      18,148  32,360,352    45,233,894    3,953,454  49,187,348
                ---------  ---------  ---------  ---------  -------------  ----------  ----------  ------------  -----------  ----------
Net Asset Value
 (NAV) Per Share                                                                              Tk.        101.40
-------------------------  ---------  --------------  ------------  -----------------  ----------  ------------  -----------  ----------


As at September 30, 2022
------------------------------------------------------------------------------------------------------------------------------------
                Share      Share      Excess     Capital  Revaluation  Unrealized  Retained    Equity        Non-         Total
                 Capital    Premium    of Issue  Reserve   Surplus      Gain/       Earnings   attributable  Controlling   Equity
                                       Price     on                     (Loss)                 to Owners     Interests
                                       over      Merger                                        of the
                                       Face                                                    Company
                                       Value
                                       of GDRs
                ---------  ---------  ---------  -------  -----------  ----------  ----------  ------------  -----------  ----------
Balance
 as on July
 01, 2022       4,461,121  5,269,475  1,689,637  294,951    1,116,896      20,532  27,747,886    40,600,498    4,035,507  44,636,005
                ---------  ---------  ---------  -------  -----------  ----------  ----------  ------------  -----------  ----------
Total
Comprehensive
Income:
                --------------------------------------------------------------------------------------------------------------------
Profit/(Loss)
 for the
 Period                 -          -          -        -            -           -   1,447,027     1,447,027     (34,314)   1,412,713
                ---------  ---------  ---------  -------  -----------  ----------  ----------  ------------  -----------  ----------
Other
 Comprehensive
 Income/(Loss)          -          -          -        -            -     (3,340)           -       (3,340)            -     (3,340)
                ---------  ---------  ---------  -------  -----------  ----------  ----------  ------------  -----------  ----------

Adjustment
 for
 Depreciation
 on Revalued
 Assets                 -          -          -        -      (1,409)           -       1,409             -            -           -
                ---------  ---------  ---------  -------  -----------  ----------  ----------  ------------  -----------  ----------
Adjustment
 for Deferred
 Tax on
 Revalued
 Assets                 -          -          -        -          317           -           -           317            -         317
                ---------  ---------  ---------  -------  -----------  ----------  ----------  ------------  -----------  ----------
Balance
 as on
 September
 30, 2022       4,461,121  5,269,475  1,689,637  294,951    1,115,804      17,192  29,196,322    42,044,502    4,001,193  46,045,695
                ---------  ---------  ---------  -------  -----------  ----------  ----------  ------------  -----------  ----------

Net Asset Value (NAV)
 Per Share                                                                                Tk.         94.25
------------------------------------  ---------  -------  -----------  ----------  ----------  ------------  -----------  ----------
Beximco Pharmaceuticals Limited and its Subsidiaries
Consolidated Statement of Cash Flows (Un-audited)
For the Period July - September 2023
                                                                      Taka '000
                                               July -September  July -September
                                                          2023             2022
Cash Flows from Operating Activities:
                                               ---------------  ---------------
Receipts from Customers and Others                  11,197,080        9,853,354
Payments to Suppliers and Employees                (7,998,606)      (8,584,421)
                                               ---------------  ---------------
Cash Generated from Operations                       3,198,474        1,268,933
Interest Paid                                        (295,410)        (310,322)
Interest Received                                            -            1,310
Income Tax Paid                                      (194,713)        (275,443)
Net Cash Generated from Operating Activities         2,708,351          684,478
Cash Flows from Investing Activities:
                                               ---------------  ---------------
Acquisition of Property, Plant and Equipment         (513,160)        (636,985)
Intangible Assets                                     (97,638)         (45,431)
Disposal of Property, Plant and Equipment                3,488               20
Disposal of Intangible Assets                                -           52,125
Short Term Investment                                (200,000)                -
Net Cash Used in Investing Activities                (807,310)        (630,271)
Cash Flows from Financing Activities:
                                               ---------------  ---------------
Net Increase /(Decrease) in Long Term
 Borrowings                                          (211,318)        (619,541)
Net Increase/(Decrease) in Short Term
 Borrowings                                        (1,888,455)          256,464
Dividend Paid                                            (231)            (295)
                                               ---------------  ---------------
Net Cash (Used in) / from Financing
 Activities                                        (2,100,004)        (363,372)
Increase/(Decrease) in Cash and Cash
 Equivalents                                         (198,963)        (309,165)
Cash and Cash Equivalents at Beginning
 of Period                                           1,135,686        1,168,674
Effect of Exchange Rate Changes on Cash
 and Cash Equivalents                                    7,154           13,144
                                               ---------------  ---------------
Cash and Cash Equivalents at End of
 Period                                                943,877          872,653

Number of Shares                                   446,112,089      446,112,089
Net Operating Cash Flows Per Share                        6.07             1.53
This information is provided by RNS, the news service of the
London Stock Exchange. RNS is approved by the Financial Conduct
Authority to act as a Primary Information Provider in the United
Kingdom. Terms and conditions relating to the use and distribution
of this information may apply. For further information, please
contact rns@lseg.com or visit www.rns.com.
RNS may use your IP address to confirm compliance with the terms
and conditions, to analyse how you engage with the information
contained in this communication, and to share such analysis on an
anonymised basis with others as part of our commercial services.
For further information about how RNS and the London Stock Exchange
use the personal data you provide us, please see our Privacy
Policy.
END
QRFFLFVRLRLEIIV
(END) Dow Jones Newswires
November 06, 2023 02:00 ET (07:00 GMT)
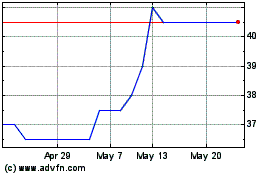
Beximco Pharma (LSE:BXP)
Historical Stock Chart
From Oct 2024 to Nov 2024

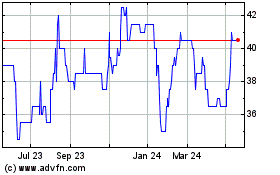
Beximco Pharma (LSE:BXP)
Historical Stock Chart
From Nov 2023 to Nov 2024
