Dragon Capital Group Corp. (PINKSHEETS: DRGV), a leading holding
company of emerging high-tech companies in China, announced today
the company's financial results for the third quarter ended
September 30, 2009.
Financial Highlights:
Revenue for the third quarter ended September 30, 2009 was $14.2
million, a 24.56% increase over the $11.4 million recorded in the
third quarter of 2008. Cost of sales for the third quarter of 2009
were $13.3 million compared to $10.6 million in the third quarter
of 2008. Net income from continuing operations for the third
quarter of 2009 was $356,187, slight decrease from the $383,126
recorded in the third quarter of 2008. Net income in the third
quarter of 2009 was approximately $291,000, slight decrease from
approximately $310,000 for the third quarter of 2008. The decrease
in net income was largely attributable to the Company's efforts to
increase sales and market share through an aggressive pricing
strategy in a very difficult market environment.
Nine-Month Financial Results
Revenue for the first nine months of 2009 reached record $41.1
million, a 20% increase from the $33.7 million recorded in the
first nine months of 2008. For the first nine months of 2009, net
income from continuing operations was $799,553 down from $1.11
million in the first nine months of 2008, mainly a result of
reduced margins of its main technological product sales.
Mr. Lawrence Wang, CEO of Dragon Capital Group, stated, "As we
are emerging away from a very challenging sales environment, Dragon
has made a strong effort to increase sales volume and market share
through aggressive pricing. Our dedication to this strategy has
enabled Dragon to post record sales while remaining profitable for
the quarter and the first nine months of the year. We are confident
that these gains in market share will result in a significant
expansion in our top and bottom line performance as the economy
continues to improve in the coming quarters and margins return to
normalized levels. We are confident that China's high-tech industry
will provide a significant growth opportunity for Dragon as we
continue to seek to grow internally and through opportunistic
acquisition of complimentary high tech operations for the benefit
of our shareholders."
Consolidated financial Statements
DRAGON CAPITAL GROUP, CORP. AND SUBSIDIARIES
CONSOLIDATED BALANCE SHEET
(Unaudited)
ASSETS
September 30 December 31,
------------ -------------
2009 2008
------------ -------------
CURRENT ASSETS:
Cash and cash equivalents $ 1,173,001 $ 1,812,809
Accounts receivable, net of allowance for
doubtful accounts of $152,903 and $152,533,
respectively 5,042,323 2,921,310
Other receivables 870,868 2,088,449
Inventories 5,909,810 5,829,686
Loan receivable - 114,000
Investment in marketable securities 112,000 266,000
Prepaid expenses and other 338,562 264,791
Subsidiaries held for sale - 2,273,900
------------ -------------
Total Current Assets 13,446,564 15,570,945
DUE FROM RELATED PARTY 71,663 71,489
PROPERTY AND EQUIPMENT - Net 232,503 275,098
------------ -------------
Total Assets $ 13,750,730 $ 15,917,532
============ =============
LIABILITIES AND STOCKHOLDERS' EQUITY
CURRENT LIABILITIES:
Loans payable $ 521,876 $ 320,971
Loans payable-related party - 43,769
Accounts payable and accrued expenses 4,572,367 3,675,375
Other payable 411,138 336,426
Taxes payable (150,047) 68,235
Advances from customers 1,521 1,230,135
Subsidiaries held for sale - 895
------------ -------------
Total Current Liabilities 5,356,855 5,675,806
------------ -------------
EQUITY:
Dragon Capital Group, Corp.
Common Stock ($0.001 Par Value; 500,000,000
Shares Authorized;
259,644,578 shares issued and outstanding) 259,645 259,645
Additional paid-in capital 5,061,071 6,108,800
Accumulated retained earnings 2,214,854 2,569,941
Subscription receivable (2,000) -
Accumulated comprehensive income (248,329) 245,235
------------ -------------
Total Dragon Capital Group, Corp. 7,285,241 9,183,621
------------ -------------
Noncontrolling interest 1,108,634 1,058,105
------------ -------------
Total Equity 8,393,875 10,241,726
------------ -------------
Total Liabilities and Equity $ 13,750,730 $ 15,917,532
============ =============
DRAGON CAPITAL GROUP, CORP. AND SUBSIDIARIES
CONSOLIDATED STATEMENT OF OPERATIONS
(Unaudited)
For the Three Months Ended For the Nine Months Ended
September 30, September 30,
-------------------------- --------------------------
2009 2008 2009 2008
------------ ------------ ------------ ------------
NET REVENUES $ 14,165,556 $ 11,352,590 $ 41,065,365 $ 33,695,969
COST OF SALES 13,299,065 10,640,081 38,746,832 31,534,898
------------ ------------ ------------ ------------
GROSS PROFIT 866,491 712,509 2,318,533 2,161,071
------------ ------------ ------------ ------------
OPERATING EXPENSES:
Selling expenses 341,807 150,560 910,513 464,261
General and
administrative 168,497 178,823 608,467 586,132
------------ ------------ ------------ ------------
Total Operating
Expenses 510,304 329,383 1,518,980 1,050,393
------------ ------------ ------------ ------------
INCOME FROM
OPERATIONS 356,187 383,126 799,553 1,110,678
------------ ------------ ------------ ------------
OTHER INCOME
Other income 142 (73) 2,847 (19)
Interest income
(expense) (22,827) (1,706) (23,931) (1,170)
------------ ------------ ------------ ------------
Total Other
expense (22,685) (1,779) (21,084) (1,189)
------------ ------------ ------------ ------------
INCOME BEFORE
DISCONTINUED
OPERATIONS,
INCOME TAX AND
NONCONTROLLING
INTEREST 333,502 381,347 778,469 1,109,489
DISCOUNTINUED
OPERATIONS:
Loss on sale of
Fomde
subsidiaries - - (714,983) -
Gain from
discontinued
operations - 3,226 5,603 17,360
------------ ------------ ------------ ------------
Total (loss)
gain from
discontinued
operations - 3,226 (709,380) 17,360
INCOME BEFORE
INCOME TAXES AND
NONCONTROLLING
INTEREST 333,502 384,573 69,089 1,126,849
INCOME TAXES (42,838) (74,530) (218,220) (255,103)
------------ ------------ ------------ ------------
NET (LOSS) INCOME 290,664 310,043 (149,131) 871,746
Less: Net income
attributable to
noncontrolling
interest (91,762) (44,780) (205,956) (141,532)
------------ ------------ ------------ ------------
NET (LOSS) INCOME
ATTRIBUTABLE TO
DRAGON CAPITAL
GROUP, CORP. 198,902 265,263 (355,087) 730,214
------------ ------------ ------------ ------------
NET INCOME (LOSS)
PER COMMON SHARE:
Net (loss) income
from continuing
operations $ 0.00 $ 0.00 $ 0.00 $ 0.00
============ ============ ============ ============
Net (loss) income
from
discontinued
operations $ - $ 0.00 $ (0.00) $ 0.00
============ ============ ============ ============
NET (LOSS) INCOME
PER COMMON SHARE $ 0.00 $ 0.00 $ (0.00) $ 0.00
============ ============ ============ ============
WEIGHTED AVERAGE
COMMON SHARES
OUTSTANDING:
Basic and Diluted 259,644,578 240,066,800 259,644,578 236,566,800
============ ============ ============ ============
AMOUNTS
ATTRIBUTABLE TO
DRAGON CAPITAL
GROUP, CORP.
COMMON
SHAREHOLDERS:
Income from
continuing
operations, net
of tax 198,902 262,037 354,293 712,854
Discontinued
operations, net
of tax - 3,226 (709,380) 17,360
------------ ------------ ------------ ------------
Net income 198,902 265,263 (355,087) 730,214
============ ============ ============ ============
DRAGON CAPITAL GROUP, CORP. AND SUBSIDIARIES
CONSOLIDATED STATEMENT OF CASH FLOWS
For the Nine Months
Ended Septemeber 30,
2009 2008
----------- -----------
CASH FLOWS FROM OPERATING ACTIVITIES: (Unaudited) (Unaudited)
Income from continuing operations $ 354,293 $ 712,854
Adjustments to reconcile income from operations
to net cash used in continuing operations:
Depreciation and amortization 31,586 41,197
Allowance for doubtful accounts - -
Stock based compensation - 16,737
Noncontrolling interest 205,957 141,532
Changes in assets and liabilities:
Accounts receivable (2,112,403) (703,091)
Other receivable 1,221,774 (63,363)
Inventories (65,924) (537,623)
Prepaid and other current assets (72,004) (44,052)
Accounts payable and accrued expenses 888,827 (554,043)
Other payable 73,843 65,153
Income tax payable (218,291) (17,500)
Advances from customers (1,230,716) 545,566
----------- -----------
Net cash used in continuing operations (923,058) (396,633)
----------- -----------
(Loss) income from discontinued operations (709,380) 17,360
Adjustments to reconcile (loss) income from
discontinued operations to net cash used in
discontinued operations
Non-cash loss from discontinued operations 714,983 -
Assets from discontinued operations (11,112) (2,362)
Liabilities from discontinued operations 126 (31,677)
Minority interest 5,383 16,679
----------- -----------
Net cash used in discontinued operations - -
----------- -----------
NET CASH USED IN OPERATING ACTIVITIES (923,058) (396,633)
----------- -----------
CASH FLOWS FROM INVESTING ACTIVITIES:
Cash acquired in acquisition - 221,684
Disposition (purchase) of property, plant and
equipment 11,646 (63,596)
----------- -----------
NET CASH PROVIDE BY INVESTING ACTIVITIES 11,646 158,088
----------- -----------
CASH FLOWS FROM FINANCING ACTIVITIES:
Write off the uncollectible loan 112,926 -
Proceeds from loans 292,290
Payments made - loans (102,302) (116,738)
Repayments of related party advance (33,844) (74,420)
----------- -----------
NET CASH PROVIDED BY (USED IN) FINANCING
ACTIVITIES 269,070 (191,158)
----------- -----------
EFFECT OF EXCHANGE RATE ON CASH 2,534 150,106
NET DECREASE IN CASH (639,808) (279,597)
CASH - beginning of the year 1,812,809 1,562,756
----------- -----------
CASH - end of period $ 1,173,001 $ 1,283,159
=========== ===========
SUPPLEMENTAL DISCLOSURE OF CASH FLOW
INFORMATION:
Cash paid for: Interest $ 7,397 $ 1,416
=========== ===========
Income taxes $ 55,909 $ 34,905
=========== ===========
NON-CASH INVESTING ACTIVITIES:
Subscription receivable for disposal of
Fomde subsidiary $ 2,000 $ -
=========== ===========
About Dragon Capital Group Corporation
Dragon Capital Group Corporation is a holding company serving as
a business incubator for emerging Chinese businesses. Dragon
currently controls seven subsidiaries operating in high-tech, IT
products and services and management consulting. Three of the
subsidiaries are growing strong recurring revenue streams from
electronics hardware distribution and network integration. The
company's other three subsidiaries, still in the emergent stage,
are focused on wireless Internet applications, mobile business
solutions, software development, enterprise management,
computerized automations systems integration and network
integration. For more information, visit,
http://www.dragoncapital.us.
Safe Harbor Statement
This news release contains forward-looking statements within the
meaning of the Private Securities Litigation Reform Act of 1995.
These forward-looking statements are based on current expectations
or beliefs, including, but not limited to, statements concerning
the company's operations, financial performance and, condition. For
this purpose, statements that are not statements of historical fact
may be deemed to be forward-looking statements. The company
cautions that these statements by their nature involve risks and
uncertainties, and actual results may differ materially depending
on a variety of important factors, including, but not limited to,
the impact of competitive products, pricing and new technology;
changes in consumer preferences and tastes; and effectiveness of
marketing; changes in laws and regulations; fluctuations in costs
of production, and other factors as those discussed in the
company's reports filed with the Securities and Exchange Commission
from time to time. In addition, the company disclaims any
obligation to update any forward-looking statements to reflect
events or circumstances after the date hereof.
Contact: Investor Relations: Gary Liu Tel: 954-363-7333 ext.
318
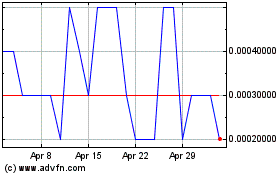
Dragon Capital (PK) (USOTC:DRGV)
Historical Stock Chart
From Jun 2024 to Jul 2024

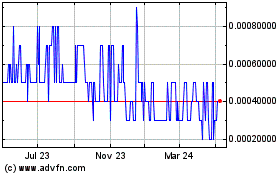
Dragon Capital (PK) (USOTC:DRGV)
Historical Stock Chart
From Jul 2023 to Jul 2024
