FORM 6-K
SECURITIES AND EXCHANGE COMMISSION
Washington, D.C. 20549
Report of Foreign Issuer
Pursuant to Rule 13a-16 or 15d-16 of
the Securities Exchange Act of 1934
For the month of December, 2023
Commission File Number: 001-12518
Banco Santander, S.A.
(Exact name of registrant as specified in its
charter)
Ciudad Grupo Santander
28660 Boadilla del Monte (Madrid) Spain
(Address of principal executive office)
Indicate by check mark whether the registrant files or will file annual
reports under cover of Form 20-F or Form 40-F:
Banco Santander, S.A.
TABLE OF CONTENTS
|
Item |
|
| |
|
| 1 |
Adapting reporting to our new operating model — Five global businesses (Presentation - December 2023) |
Item
1

Adapting reporting to our new operating model — Five global businesses December 2023

Important information 2 Non - IFRS and alternative performance measures This document contains financial information prepared according to International Financial Reporting Standards (IFRS) and taken from our consolidated financial statements, as well as alternative performance measures (APMs) as defined in the Guidelines on Alternative Performance Measures issued by the European Securities and Markets Authority (ESMA) on 5 October 2015 , and other non - IFRS measures . The APMs and non - IFRS measures were calculated with information from Grupo Santander ; however, they are neither defined or detailed in the applicable financial reporting framework nor audited or reviewed by our auditors . We use these APMs and non - IFRS measures when planning, monitoring and evaluating our performance . We consider them to be useful metrics for our management and investors to compare operating performance between periods . APMs we use are presented unless otherwise specified on a constant FX basis, which is computed by adjusting comparative period reported data for the effects of foreign currency translation differences, which distort period - on - period comparisons . Nonetheless, the APMs and non - IFRS measures are supplemental information ; their purpose is not to substitute IFRS measures . Furthermore, companies in our industry and others may calculate or use APMs and non - IFRS measures differently, thus making them less useful for comparison purposes . APMs using ESG labels have not been calculated in accordance with the Taxonomy Regulation or with the indicators for principal adverse impact in SFDR . For further details on APMs and Non - IFRS Measures, including their definition or a reconciliation between any applicable management indicators and the financial data presented in the consolidated financial statements prepared under IFRS, please see the 2022 Annual Report on Form 20 - F filed with the U . S . Securities and Exchange Commission (the SEC) on 1 March 2023 (https : // www . santander . com/content/dam/santander - com/en/documentos/informacion - sobre - resultados - semestrales - y - anuales - suministrada - a - la - sec/ 2023 /sec - 2022 - annual - 20 - f - 2022 - en . pdf), as well as the section “Alternative performance measures” of Banco Santander, S . A . (Santander) Q 3 2023 Financial Report, published on 25 October 2023 (https : // www . santander . com/en/shareholders - and - investors/financial - and - economic - information#quarterly - results) . Underlying measures, which are included in this document, are non - IFRS measures . The businesses included in each of our geographic segments and the accounting principles under which their results are presented here may differ from the businesses included and local applicable accounting principles of our public subsidiaries in such geographies . Accordingly, the results of operations and trends shown for our geographic segments may differ materially from those of such subsidiaries .

Important information 3 Forward - looking statements Santander hereby warns that this document contains “forward - looking statements” as per the meaning of the U . S . Private Securities Litigation Reform Act of 1995 . Such statements can be understood through words and expressions like “expect”, “project”, “anticipate”, “should”, “intend”, “probability”, “risk”, “VaR”, “RoRAC”, “RoRWA”, “TNAV”, “target”, “goal”, “objective”, “estimate”, “future”, “commitment”, “commit”, “focus”, “pledge” and similar expressions . They include (but are not limited to) statements on future business development, shareholder remuneration policy and NFI . While these forward - looking statements represent our judgement and future expectations concerning our business developments and results may differ materially from those anticipated, expected, projected or assumed in forward - looking statements . In particular, forward looking statements are based on current expectations and future estimates about Santander’s and third - parties’ operations and businesses and address matters that are uncertain to varying degrees and may change, including, but not limited to (a) changes in rules and regulations, regulatory requirements and internal policies, including those related to climate - related initiatives ; (b) our own decisions and actions including those affecting or changing our practices, operations, priorities, strategies, policies or procedures ; and (c) the uncertainty over the scope of actions that may be required by us, governments and others to achieve goals relating to climate, environmental and social matters, as well as the evolving nature of underlying science and industry and governmental standards and regulations . In addition, the important factors described in this report and other risk factors, uncertainties or contingencies detailed in our most recent Form 20 - F and subsequent 6 - Ks filed with, or furnished to, the SEC, as well as other unknown or unpredictable factors, could affect our future development and results and could lead to outcomes materially different from what our forward - looking statements anticipate, expect, project or assume . Forward - looking statements are therefore aspirational, should be regarded as indicative, preliminary and for illustrative purposes only, speak only as of the date of this report, are informed by the knowledge, information and views available on such date and are subject to change without notice . Santander is not required to update or revise any forward - looking statements, regardless of new information, future events or otherwise, except as required by applicable law . Santander does not accept any liability in connection with forward - looking statements except where such liability cannot be limited under overriding provisions of applicable law . Not a securities offer This report and the information it contains does not constitute an offer to sell nor the solicitation of an offer to buy any securities . Past performance does not indicate future outcomes Statements about historical performance or growth rates must not be construed as suggesting that future performance, share price or results (including earnings per share) will necessarily be the same or higher than in a previous period . Nothing in this report should be taken as a profit and loss forecast .

4 Executive Summary On 18 September, we announced our last step towards ONE SANTANDER to extract the full potential of our global and in - market va lue Previously reported Group consolidated financial information, as well as that of the regions, countries and Corporate Centre remains unchanged To align our financial reporting to the new operating model , we are introducing the following changes from 2024 onwards 1 : We will start reporting five global businesses, which will be our new primary segments , which incorporate: tter reflect their performance and recognize the value added by our branch network Regions and countries will be our new secondary segments – 1 New global businesses definitions, including three new segments: Retail & Commercial Banking, Digital Consumer Bank and Payments – 2 Full allocation of all local financial management activities to the global businesses and updated revenue sharing criteria to be Note: financial figures related to the new five global businesses have not been audited. (1) These changes will apply to results generated from 1 January 2024. We are sharing them in advance to facilitate analysis. t of These changes represent the final step in our strategic plan to become a global financial services platform to support the achievemen our strategic goals announced at the Investor Day Group - level targets do not change

We recently completed our last step towards ONE SANTANDER, creating a simpler, more efficient operating model DCB as a first step in personal finance Bring together our digital bank and SCF O NE First Global business Build a global platform sharing one single infrastructure across our footprint Forged a new Global business Promote a service model for clients, leveraging Group scale and capabilities S CIB W M &I PagoNxt & Cards, 2 global payments platforms Bring global merchants & SMEs (Getnet / OneTrade) into a single infrastructure Payments DCB T r a n s f ormat i on for three countries Now globally for all individuals and self employed Retail 2017 2021 2015 2021 2022 Global product factory / infrastructure Global SMEs, Corporates & Institutional factories along with Retail Commercial 2023 5 Our journey began in 2015 with SCIB leading the way

In September, we announced our last step towards ONE SANTANDER Our new model will allow us to… E urope North Americ a South Americ a DCB E urope One Sa n t a nder Retail & Commercial Banking Digital Consumer Bank Corporate & Investment Banking Wealth Management & Insurance Payments We will run the bank through a simpler and more efficient operating model that will enable us to capture the full potential of our in - market and global value and deliver profitable growth …serve our customers better • Simpler and common product offering, global platforms and best - in - class customer experience …be more efficient • Enhanced control over implementation of global initiatives • More agile structure to identify and react to emerging industry trends • Maximize cost savings …grow more and faster • Strengthened competitive position • Promote network revenue …improve capital allocation • Enhanced ability to steer capital allocation on a global level RCB DCB C IB WMI P A Y 6

7 We are adjusting the way we report our results to the new operating model Wealth Mana g e m e n t & Insurance Corporate & Investment Banking Retail & C om m e r c ial Banking Payments Digital C ons u m e r Bank Eu r ope South America North America United States Mexico Brazil Chile A r ge nt i n a Uruguay Peru Co l o m bi a UK P o la n d Other Europe DCB Europe Spain P o rt u gal Individuals SMEs Corporates Note: excl. cards business, which has been allocated to Payments Consumer business 1 SBNA consumer 2 Openbank Transactional Banking Investment Banking Markets Private Banking Asset Management (SAM) Insurance PagoNxt Global Cards Secondary (geographic) segments New primary segments (1) Includes all consumer finance companies across the Group. (2) Includes individuals. Corporate Centre The perimeters of our secondary (geographic) segments and the Corporate Centre remain unchanged SCF (auto, non - auto) Op en b a n k

8 Changes to the financial reporting Results from activities related mainly to financial management that are currently in the countries are fully allocated to their global businesses based on the segment that generates the financial position Local corporate centres are therefore fully allocated, leaving only one Corporate Centre at Group level, which remains unchanged Revenue sharing criteria have been revised to better reflect the contribution of the global businesses and the value added by the branch network Former Retail Banking is split in two new segments: Retail & Commercial Banking and Digital Consumer Bank The new Digital Consumer Bank manages all consumer activity (both auto and non - auto) across the Group to extract synergies from our agreements with OEMs and partners (see slide 12 for more details) A new segment called Payments , which brings together all payments businesses across the Group, including PagoNxt (which was formerly reported as a secondary segment), and the cards business previously included in the former Retail Banking Our geographic segments remain unchanged. The former DCB segment is renamed DCB Europe, which is now reported as a secondary segment Full allocation of local financial man a ge ment a c ti v iti e s and other 2 Definition of new global b u sin e s s e s 1

9 Breakdown of main financial impacts on attributable profit by business P a y m e n ts Corporate & Investment Banking Wealth Management & Insurance Note: - In line with our usual financial reporting, segments are reported on an underlying basis. - To reach Group’s total attributable profit, the Corporate Centre’s negative results ( - €1,084mn) need to be deducted. (*) Attributable profits under the new global business perimeters do not exactly match figures reported in Q3’23 due to non - material changes related to other minor global platforms that are not detailed here. …To Retail Banking is split in new Retail & Commercial, new Digital Consumer Bank and Payments 2 8,143 From… Reported SCI B 5 R e t a i l Ba n k i ng - P a g oN x t G r o u p WM &I Retail & Commercial Banking Digital Consumer Bank G r o u p 1,853 1 8,143 1 Definition of new global businesses Full allocation of local financial management activities and revised revenue sharing criteria Full allocation and other 2 9M ’ 23 Att. Profit € mn +1,218 3 1 - 238 +0 - 812 1 UNCHANGED Regions, countries and Group Corporate Centre financial information remains unchanged 4,419 1 Retail Banking is split into the new RCB and DCB segments. Cards, previously in former Retail Banking, is in the new Payments segment 1 - 168 2,665 * * New 9M ’ 23 Att. Profit € mn
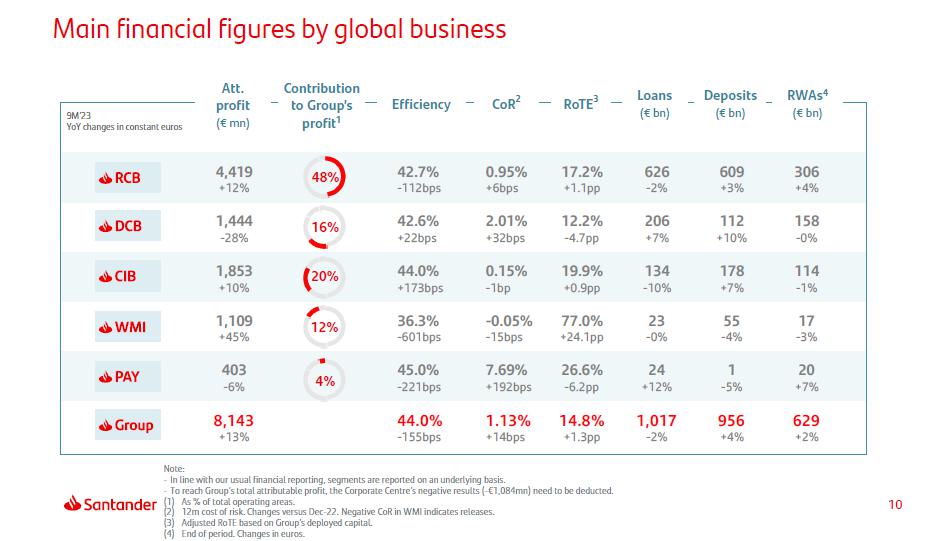
10 4 , 4 1 9 +12% 42.7% - 112 bp s 0 . 9 5 % +6bps 1 7 . 2 % +1.1pp 626 - 2% 609 +3% 306 +4% 1 , 4 4 4 - 28% 4 2 . 6 % +22bps 2 . 0 1 % +32bps 1 2 . 2 % - 4.7pp 206 +7% 112 +10% 158 - 0% 1 , 8 5 3 +10% 44.0% + 173 bp s 0 . 1 5 % - 1bp 1 9 . 9 % +0.9pp 134 - 10 % 178 +7% 114 - 1% 1 , 1 0 9 +45% 36.3% - 601 bp s - 0 . 0 5 % - 15bps 7 7 . 0 % +24.1pp 23 - 0 % 55 - 4 % 17 - 3 % 403 4 5 . 0 % 7 . 6 9 % 2 6 . 6 % 24 1 20 - 6% - 221 bp s +192 bp s - 6.2pp +12% - 5% +7% 8,143 44 . 0 % 1 . 13 % 14.8% 1,017 956 629 - 2 % +4% +2% 9M’23 YoY changes in constant euros C on t ri b u t ion to Group’s profit 1 Efficiency CoR 2 RoTE 3 A tt . profit (€ mn) Main financial figures by global business L o a n s (€ bn) Depos its (€ bn) RWAs 4 (€ bn) +13% - 155bps +14bps +1.3pp Note: - In line with our usual financial reporting, segments are reported on an underlying basis. - To reach Group’s total attributable profit, the Corporate Centre’s negative results ( - €1,084mn) need to be deducted. (1) As % of total operating areas. (2) 12m cost of risk. Changes versus Dec - 22. Negative CoR in WMI indicates releases. (3) Adjusted RoTE based on Group’s deployed capital. (4) End of period. Changes in euros. 48% 16% 20% 12% 4%

Appendix 11 Additional information New primary segments. Financial information

Global businesses. New primary segments Local customer banking businesses including business from individuals, SMEs and corporates Cards are excluded as they are now included within Payments segment Retail & Com m erci a l B a nking D igit a l Cons umer B a nk Corporate & Inv e s tment B a nk ing W e a l th Man a ge ment & Insurance Payments The new Digital Consumer Bank segment includes the activity of: i) DCB Europe (former DCB), which incorporates all consumer finance businesses in Europe, Openbank and Open Digital Services (ODS), ii) the consumer finance business that is originated in dedicated legal vehicles in South America and Mexico, iii) SC USA, and iv) SBNA consumer Global corporate banking, investment banking and markets worldwide including treasury activity managed globally (always after the appropriate client distribution with Retail & Commercial Banking), as well as equity business, with those customers under the Global Relationship Model Business with private banking clients in the countries, Private Banking and International Private Banking corporate unit in Miami and Switzerland (Santander Private Banking), the asset management business (Santander Asset Management) and the insurance business (Santander Insurance) Digital payment solutions, providing global technology solutions for our banks and new customers in the open market. It is structured into two main businesses: PagoNxt and Global Cards The Group’s Corporate Centre remains unchanged. It includes the centralized holding activities related to equity stakes in financial companies, financial management of the structural exchange rate position assumed within the sphere of the Group’s assets and liabilities committee, as well as management of liquidity and shareholders’ equity via issuances Co r por a t e Cen t r e 12

Appendix 13 Additional information New primary segments. Financial information

Retail & Commercial Banking EUR million (*). - Includes exchange differences. (**). - Excluding reverse repos. (***). - Excluding repos. 14 Q1'22 Q2'22 Q3'22 Q4'22 Q1'23 Q2'23 Q3'23 Underlying income statement Net interest income 4 , 97 4 5 , 39 9 5 , 83 9 5 , 88 0 5 , 97 3 6 , 51 2 6 , 74 7 Net fee income 1 , 13 0 1 , 21 1 1 , 22 6 1 , 10 5 1 , 07 4 1 , 21 2 1 , 19 6 Gains (losses) on financial transactions * 329 522 222 68 423 253 231 Other operating income ( 70 ) ( 287 ) ( 181 ) ( 374 ) ( 213 ) ( 315 ) ( 309 ) Total income 6 , 36 4 6 , 84 6 7 , 10 5 6 , 67 9 7 , 25 7 7 , 66 2 7 , 86 5 Administrative expenses and amortizations ( 2 , 790 ) ( 3 , 018 ) ( 3 , 101 ) ( 3 , 151 ) ( 3 , 111 ) ( 3 , 263 ) ( 3 , 361 ) Net operating income 3 , 57 4 3 , 82 8 4 , 00 4 3 , 52 9 4 , 14 6 4 , 39 8 4 , 50 4 Net loan - loss provisions ( 1 , 246 ) ( 1 , 607 ) ( 1 , 540 ) ( 1 , 495 ) ( 1 , 512 ) ( 1 , 599 ) ( 1 , 698 ) Other gains (losses) and provisions ( 369 ) ( 417 ) ( 645 ) ( 518 ) ( 566 ) ( 702 ) ( 513 ) Profit before tax 1 , 95 9 1 , 80 4 1 , 81 9 1 , 51 6 2 , 06 8 2 , 09 7 2 , 29 2 Tax on profit ( 523 ) ( 403 ) ( 454 ) ( 296 ) ( 542 ) ( 639 ) ( 549 ) Profit from continuing operations 1 , 43 6 1 , 40 2 1 , 36 6 1 , 22 0 1 , 52 6 1 , 45 8 1 , 74 3 Net profit from discontinued operations — — — — — — — Consolidated profit 1 , 43 6 1 , 40 2 1 , 36 6 1 , 22 0 1 , 52 6 1 , 45 8 1 , 74 3 Non - controlling interests ( 120 ) ( 121 ) ( 87 ) ( 79 ) ( 94 ) ( 100 ) ( 114 ) Profit attributable to the parent 1 , 31 6 1 , 28 1 1 , 27 9 1 , 14 1 1 , 43 2 1 , 35 8 1 , 62 9 Business volumes M a r - 2 2 J un - 2 2 Se p - 2 2 D e c - 2 2 M a r - 2 3 J un - 2 3 Se p - 2 3 Gross loans and advances to customers ** 628,977 631,091 638,623 629,478 628,233 633,631 625,558 Customer funds 697,130 680,940 681,037 689,330 686,464 699,432 707,567 Customer deposits *** 604,253 592,183 590,754 598,110 592,493 609,113 609,063 Mutual funds 92 , 87 7 88 , 75 7 90 , 28 3 91 , 22 0 93 , 97 2 90 , 32 0 98 , 50 4

Digital Consumer Bank EUR million (*). - Includes exchange differences. (**). - Excluding reverse repos. (***). - Excluding repos. 15 Q1'22 Q2'22 Q3'22 Q4'22 Q1'23 Q2'23 Q3'23 Underlying income statement Net interest income 2 , 46 3 2 , 49 5 2 , 59 3 2 , 57 0 2 , 54 6 2 , 47 7 2 , 60 0 Net fee income 297 321 317 334 288 295 316 Gains (losses) on financial transactions * 47 20 12 65 24 32 17 Other operating income 236 133 227 260 203 160 182 Total income 3 , 04 3 2 , 97 0 3 , 14 9 3 , 22 8 3 , 06 1 2 , 96 5 3 , 11 5 Administrative expenses and amortizations ( 1 , 287 ) ( 1 , 275 ) ( 1 , 319 ) ( 1 , 316 ) ( 1 , 317 ) ( 1 , 291 ) ( 1 , 284 ) Net operating income 1 , 75 7 1 , 69 5 1 , 83 0 1 , 91 2 1 , 74 4 1 , 67 5 1 , 83 1 Net loan - loss provisions ( 616 ) ( 755 ) ( 832 ) ( 1 , 019 ) ( 916 ) ( 887 ) ( 1 , 177 ) Other gains (losses) and provisions ( 45 ) ( 22 ) ( 9 ) ( 16 ) ( 71 ) ( 39 ) ( 78 ) Profit before tax 1 , 09 5 918 989 877 756 748 576 Tax on profit ( 263 ) ( 191 ) ( 239 ) ( 187 ) ( 169 ) ( 113 ) ( 87 ) Profit from continuing operations 833 727 750 690 587 635 489 Net profit from discontinued operations — — — — — — — Consolidated profit 833 727 750 690 587 635 489 Non - controlling interests ( 113 ) ( 114 ) ( 62 ) ( 100 ) ( 99 ) ( 96 ) ( 72 ) Profit attributable to the parent 720 612 688 590 488 539 417 Business volumes M a r - 2 2 J un - 2 2 Se p - 2 2 D e c - 2 2 M a r - 2 3 J un - 2 3 Se p - 2 3 Gross loans and advances to customers ** 183,675 190,786 197,986 196,878 197,828 200,157 205,681 Customer funds 103,439 105,872 107,628 106,027 107,998 109,016 115,587 Customer deposits *** 101,055 103,662 105,407 102,946 104,754 105,554 112,187 Mutual funds 2 , 38 4 2 , 21 0 2 , 22 2 3 , 08 1 3 , 24 4 3 , 46 1 3 , 40 0

Corporate & Investment Banking EUR million (*). - Includes exchange differences. (**). - Excluding reverse repos. (***). - Excluding repos. 16 Q1'22 Q2'22 Q3'22 Q4'22 Q1'23 Q2'23 Q3'23 Underlying income statement Net interest income 917 1 , 06 7 914 918 801 784 845 Net fee income 519 487 475 441 606 536 517 Gains (losses) on financial transactions * 91 41 351 479 292 396 653 Other operating income 33 ( 20 ) ( 23 ) 14 ( 32 ) 47 ( 38 ) Total income 1 , 55 9 1 , 57 5 1 , 71 7 1 , 85 2 1 , 66 7 1 , 76 3 1 , 97 7 Administrative expenses and amortizations ( 619 ) ( 670 ) ( 759 ) ( 852 ) ( 741 ) ( 771 ) ( 865 ) Net operating income 940 905 958 1 , 00 0 925 992 1 , 11 2 Net loan - loss provisions 13 11 ( 10 ) ( 271 ) 24 ( 31 ) 49 Other gains (losses) and provisions ( 24 ) ( 38 ) ( 33 ) ( 71 ) ( 104 ) ( 28 ) ( 28 ) Profit before tax 929 878 915 658 845 934 1 , 13 3 Tax on profit ( 275 ) ( 250 ) ( 251 ) ( 179 ) ( 275 ) ( 266 ) ( 339 ) Profit from continuing operations 654 628 664 479 571 667 794 Net profit from discontinued operations — — — — — — — Consolidated profit 654 628 664 479 571 667 794 Non - controlling interests ( 53 ) ( 43 ) ( 68 ) ( 27 ) ( 65 ) ( 64 ) ( 50 ) Profit attributable to the parent 601 585 595 452 506 603 744 Business volumes M a r - 2 2 J un - 2 2 Se p - 2 2 D e c - 2 2 M a r - 2 3 J un - 2 3 Se p - 2 3 Gross loans and advances to customers ** 136,514 142,473 152,488 142,646 139,562 136,918 134,027 Customer funds 137,884 155,213 182,322 196,021 182,682 179,008 191,960 Customer deposits *** 128,193 145,417 172,333 186,678 171,300 167,651 178,426 Mutual funds 9 , 69 1 9 , 79 7 9 , 98 9 9 , 34 3 11 , 38 2 11 , 35 7 13 , 53 4

Wealth Management & Insurance EUR million (*). - Includes exchange differences. (**). - Excluding reverse repos. (***). - Excluding repos. 17 Q1'22 Q2'22 Q3'22 Q4'22 Q1'23 Q2'23 Q3'23 Underlying income statement Net interest income 137 174 235 337 334 392 409 Net fee income 322 334 329 309 308 317 318 Gains (losses) on financial transactions * 33 21 31 23 36 43 45 Other operating income 97 94 109 93 80 79 66 Total income 589 623 704 762 758 830 838 Administrative expenses and amortizations ( 261 ) ( 269 ) ( 281 ) ( 293 ) ( 291 ) ( 293 ) ( 297 ) Net operating income 328 354 422 469 467 538 540 Net loan - loss provisions 0 ( 7 ) ( 14 ) ( 0 ) 1 14 ( 3 ) Other gains (losses) and provisions ( 9 ) ( 11 ) ( 6 ) ( 11 ) ( 24 ) ( 11 ) 0 Profit before tax 320 336 402 459 444 541 537 Tax on profit ( 72 ) ( 72 ) ( 95 ) ( 107 ) ( 108 ) ( 127 ) ( 126 ) Profit from continuing operations 247 263 307 352 335 415 412 Net profit from discontinued operations — — — — — — — Consolidated profit 247 263 307 352 335 415 412 Non - controlling interests ( 16 ) ( 17 ) ( 18 ) ( 18 ) ( 19 ) ( 20 ) ( 14 ) Profit attributable to the parent 232 246 289 334 316 395 397 Mar - 22 Jun - 22 Sep - 22 Dec - 22 Mar - 23 Jun - 23 Sep - 23 Business volumes Gross loans and advances to customers ** 21 , 57 8 22 , 51 6 23 , 27 5 22,247 21,925 22 , 55 6 22 , 66 2 Customer funds 140 , 59 4 139 , 10 8 141 , 07 4 137,423 139,282 144 , 88 0 143 , 02 5 Customer deposits *** 54 , 60 6 56 , 09 9 57 , 71 2 57,014 57,242 56 , 61 7 54 , 66 3 Mutual funds 85 , 98 8 83 , 00 9 83 , 36 2 80,409 82,040 88 , 26 3 88 , 36 2

Payments EUR million (*). - Includes exchange differences. (**). - Excluding reverse repos. (***). - Excluding repos. 18 Q1'22 Q2'22 Q3'22 Q4'22 Q1'23 Q2'23 Q3'23 Underlying income statement Net interest income 537 599 627 596 582 611 649 Net fee income 548 684 670 750 770 703 772 Gains (losses) on financial transactions * 5 3 9 4 ( 5 ) ( 1 ) 4 Other operating income ( 39 ) ( 39 ) ( 54 ) ( 25 ) ( 31 ) ( 15 ) ( 48 ) Total income 1 , 05 1 1 , 24 7 1 , 25 2 1 , 32 5 1 , 31 6 1 , 29 7 1 , 37 6 Administrative expenses and amortizations ( 492 ) ( 576 ) ( 606 ) ( 596 ) ( 589 ) ( 623 ) ( 581 ) Net operating income 559 671 646 728 726 674 795 Net loan - loss provisions ( 252 ) ( 271 ) ( 363 ) ( 246 ) ( 471 ) ( 397 ) ( 435 ) Other gains (losses) and provisions ( 3 ) ( 15 ) ( 18 ) ( 38 ) ( 14 ) ( 21 ) ( 18 ) Profit before tax 304 385 265 444 241 256 342 Tax on profit ( 143 ) ( 155 ) ( 127 ) ( 178 ) ( 118 ) ( 119 ) ( 140 ) Profit from continuing operations 161 230 138 266 124 137 202 Net profit from discontinued operations — — — — — — — Consolidated profit 161 230 138 266 124 137 202 Non - controlling interests ( 23 ) ( 26 ) ( 24 ) ( 29 ) ( 17 ) ( 21 ) ( 23 ) Profit attributable to the parent 137 204 114 238 107 116 179 Mar - 22 Jun - 22 Sep - 22 Dec - 22 Mar - 23 Jun - 23 Sep - 23 Business volumes Gross loans and advances to customers ** 20,785 21,395 21,978 22,161 22,091 23,307 23,524 Customer funds 35 550 685 688 603 600 654 Customer deposits *** 35 550 685 688 603 600 654 Mutual funds — — — — — — —
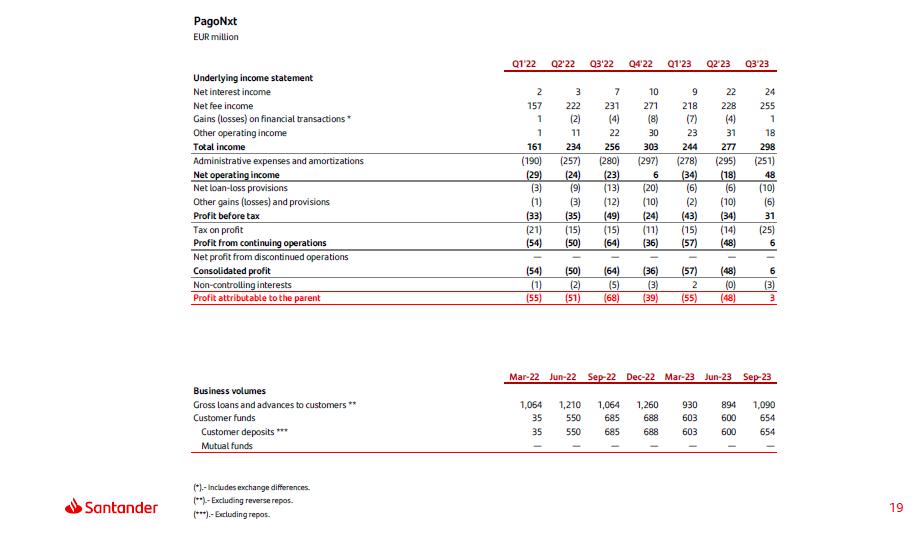
PagoNxt EUR million (*). - Includes exchange differences. (**). - Excluding reverse repos. (***). - Excluding repos. 19 Q1'22 Q2'22 Q3'22 Q4'22 Q1'23 Q2'23 Q3'23 Underlying income statement Net interest income 2 3 7 10 9 22 24 Net fee income 157 222 231 271 218 228 255 Gains (losses) on financial transactions * 1 ( 2 ) ( 4 ) ( 8 ) ( 7 ) ( 4 ) 1 Other operating income 1 11 22 30 23 31 18 Total income 161 234 256 303 244 277 298 Administrative expenses and amortizations ( 190 ) ( 257 ) ( 280 ) ( 297 ) ( 278 ) ( 295 ) ( 251 ) Net operating income ( 29 ) ( 24 ) ( 23 ) 6 ( 34 ) ( 18 ) 48 Net loan - loss provisions ( 3 ) ( 9 ) ( 13 ) ( 20 ) ( 6 ) ( 6 ) ( 10 ) Other gains (losses) and provisions ( 1 ) ( 3 ) ( 12 ) ( 10 ) ( 2 ) ( 10 ) ( 6 ) Profit before tax ( 33 ) ( 35 ) ( 49 ) ( 24 ) ( 43 ) ( 34 ) 31 Tax on profit ( 21 ) ( 15 ) ( 15 ) ( 11 ) ( 15 ) ( 14 ) ( 25 ) Profit from continuing operations ( 54 ) ( 50 ) ( 64 ) ( 36 ) ( 57 ) ( 48 ) 6 Net profit from discontinued operations — — — — — — — Consolidated profit ( 54 ) ( 50 ) ( 64 ) ( 36 ) ( 57 ) ( 48 ) 6 Non - controlling interests ( 1 ) ( 2 ) ( 5 ) ( 3 ) 2 ( 0 ) ( 3 ) Profit attributable to the parent ( 55 ) ( 51 ) ( 68 ) ( 39 ) ( 55 ) ( 48 ) 3 Mar - 22 Jun - 22 Sep - 22 Dec - 22 Mar - 23 Jun - 23 Sep - 23 Business volumes Gross loans and advances to customers ** 1 , 06 4 1 , 21 0 1 , 06 4 1 , 26 0 930 894 1 , 09 0 Customer funds 35 550 685 688 603 600 654 Customer deposits *** 35 550 685 688 603 600 654 Mutual funds — — — — — — —

Cards EUR million Q1'22 Q2'22 Q3'22 Q4'22 Q1'23 Q2'23 Q3'23 Underlying income statement Net interest income 535 596 620 586 573 589 625 Net fee income 391 462 439 480 551 475 517 Gains (losses) on financial transactions * 4 5 13 12 2 3 3 Other operating income ( 40 ) ( 50 ) ( 76 ) ( 56 ) ( 54 ) ( 47 ) ( 66 ) Total income 890 1 , 01 3 996 1 , 02 2 1 , 07 2 1 , 02 0 1 , 07 8 Administrative expenses and amortizations ( 302 ) ( 319 ) ( 327 ) ( 299 ) ( 312 ) ( 328 ) ( 331 ) Net operating income 588 695 669 723 760 692 747 Net loan - loss provisions ( 249 ) ( 262 ) ( 350 ) ( 226 ) ( 465 ) ( 391 ) ( 425 ) Other gains (losses) and provisions ( 2 ) ( 13 ) ( 5 ) ( 28 ) ( 11 ) ( 11 ) ( 11 ) Profit before tax 337 420 314 468 284 290 311 Tax on profit ( 122 ) ( 140 ) ( 112 ) ( 166 ) ( 103 ) ( 105 ) ( 115 ) Profit from continuing operations 215 280 202 302 181 185 196 Net profit from discontinued operations — — — — — — — Consolidated profit 215 280 202 302 181 185 196 Non - controlling interests ( 22 ) ( 25 ) ( 20 ) ( 25 ) ( 19 ) ( 21 ) ( 19 ) Profit attributable to the parent 192 255 182 277 162 164 177 Mar - 22 Jun - 22 Sep - 22 Dec - 22 Mar - 23 Jun - 23 Sep - 23 19 , 72 1 20 , 18 5 20 , 91 4 20 , 90 1 21 , 16 1 22 , 41 3 22 , 43 4 Business volumes Gross loans and advances to customers ** Customer funds Customer deposits *** Mutual funds — — — — — — — — — — — — — — — — — — — — — (*). - Includes exchange differences. (**). - Excluding reverse repos. (***). - Excluding repos. 20

Thank You. Our purpose is to help people and businesses prosper. Our culture is based on believing that everything we do should be:
SIGNATURE
Pursuant to the requirements of the Securities
Exchange Act of 1934, the registrant has duly caused this report to be signed on its behalf by the undersigned, thereunto duly authorized.
| |
|
Banco Santander, S.A. |
| |
|
|
| |
|
|
| Date: |
December 20, 2023 |
|
By: |
/s/ Pedro de Mingo Kaminouchi |
| |
|
|
|
Name: |
Pedro de Mingo Kaminouchi |
| |
|
|
|
Title: |
Head of Regulatory Compliance |
Banco Santander (PK) (USOTC:BCDRF)
Historical Stock Chart
From Jun 2024 to Jul 2024
 Charts.")
Banco Santander (PK) (USOTC:BCDRF)
Historical Stock Chart
From Jul 2023 to Jul 2024
 Charts.")