Southern Silver Announces Updated PEA on Cerro
Las Minitas: US$501M After-tax NPV5%; 21% IRR; 48 Month
payback
Vancouver, British Columbia -- June 11th, 2024
-- InvestorsHub NewsWire -- Southern Silver Exploration Corp.
(TSX.V:SSV) ("Southern Silver") reports results from
its Preliminary Economic Assessment ('PEA") on its 100% owned Cerro
Las Minitas project ("CLM").
PEA Highlights (all figures in $US
unless otherwise noted):
-
Robust Project
Economics – Base Case1:
after-tax NPV5%
of $501M
(C$682M) and IRR
of 21.2%
with a 48-month
payback;
-
Excellent Silver and
Zinc Price Leverage - Base-case + 20% Metal
Prices2:
after-tax NPV5%
of $876M
(C$1,193M) and
IRR
of 30.1%
with a 37-month
payback;
-
Base Case Metal Prices: Ag- $23.00/oz, Au - $1850/oz, Cu –
$4.00/lb, Pb – $1.00/lb and Zn - $1.25/lb
-
Base Case +20% metal prices: Ag- $27.60/oz, Au - $2220/oz, Cu –
$4.80/lb, Pb – $1.20/lb and Zn - $1.50/lb
The 2024 Preliminary Economic Assessment features:
-
A Large-Scale
Underground Mining Operation with a
17-year mine
life and an annual average plant feed of
14.3 Mozs
AgEq3
(inc. 5.8 Mozs Ag) and life-of-mine (LOM)
feed totalling 243.2 Mozs
AgEq3; (inc. 98.6 Mozs Ag). LOM product
sales total 194.3Mozs
AgEq3
at an AISC
of $13.23/oz
AgEq3
sold;
-
A High-Revenue
Project with gross revenues
totalling $4.47B
with silver and gold representing 45% of
revenues, and zinc representing 35% of projected revenues. The
project has an Initial CapEx of
$388M, an NPV5%-to-CapEx
ratio of 1.3X
and a paydown of 48 months on a post-tax
basis; and
-
A Well-Located
Project in a mining friendly jurisdiction with
excellent infrastructure in southeast Durango state,
Mexico;
-
AgEq is calculated on a (contained metal x metal price)/ Ag price
basis
In comparison to the earlier 2022 economic model, the updated PEA
now:
-
Increases the Life of Mine (LOM) production
by 5Mt, representing an approximate 20%
increase;
-
Increases daily mine production capacity
to 5300 tonnes per day
("tpd"), representing an approximate 18%
increase;
-
Extends the mine life by
2.6yrs;
-
Increases the LOM Revenue by
$765M, representing an approximate 17%
increase in revenues.
-
Increases the after-tax NPV5% by 45%
to $501M; and
-
Similarly, increases the post-tax IRR by 3.3%
to 21.2%
Lawrence Page. K. C. President, said: "This latest
economic update of Cerro Las Minitas represents a new milestone in
the ongoing evolution and development of the project which is the
culmination of a number of smaller technical improvements,
developed over the last 18 months, which together result in a
significant increase in the value of the Cerro Las Minitas asset.
This includes the addition of new mineral resources from the North
Felsite zone as first reported in March 2023; the standardization
of the metallurgical recoveries and charges across each of the
deposits, including the addition of gold revenues into the project
cash-flow; improvements in the mine scheduling and optimization
both the Operating and Capital costs of the project."
"Since acquisition of the property in 2010 and
subsequent identification of the mineral resources, a very
profitable and valuable mine has been modelled in the results of
the PEA disclosed today. Total acquisition, exploration and
development costs are approximately US$28 million and
significantly, the property is not burdened with royalties,
presenting potential financing opportunities for additional
drilling and development work on the property. This presentation of
the results of the PEA marks a significant milestone in the
development of the property and the best is yet to come."
PEA SUMMARY:
Study support
-
The study is based on an updated Mineral
Resource ("Resource") by KGL, as of March
20th
2024, using a $60NSR/t cut-off:
-
Indicated –
13.3Mt averaging 102g/t Ag, 0.07g/t Au,
0.17% Cu 1.3% Pb, and
3.1% Zn
totaling 43.4Moz Ag, 32Koz Au, 49Mlb
Cu, 374Mlb Pb and 921Mlb Zn;
and
-
Inferred –
23.4Mt averaging 111g/t Ag, 0.14g/t Au,
0.21% Cu, 1.1% Pb and
2.1% Zn
totaling 83.4Moz Ag, 104koz Au,
111Mlb Cu, 582Mlb Pb and 1,106Mlb Zn.
(see Appendices for Resource details, price and recovery
assumptions)
-
The PEA project team included Kirkham
Geosciences Ltd. ("KGL"), Ausenco Engineering USA South Inc and
Ausenco Sustainability ULC. ("Ausenco"), Entech Mining Limited
("Entech"), and MPC Metallurgical Process Consultants Limited
("MPC");
-
PEA metal price assumptions: Ag = $23.00/oz,
Au = $1850, Cu = $4.00/lb, Pb = $1.00/lb, Zn= $1.25/lb;
-
Terms: Net Present Value at a 5% discount
("NPV5%"); Internal Rate of Return ("IRR"); Operating Costs
("OpEx"); and Capital Costs ("CapEx"), All-in Sustaining Costs
("AISC")
Cautionary Statement
The PEA is preliminary in nature, it may
include mineral resources that are considered too speculative
geologically to have the economic considerations applied to them
that would enable them to be categorized as mineral reserves, and
there is no certainty that the PEA will be realized. Mineral
resources that are not mineral reserves have not demonstrated
economic viability. The mineral resources may be affected by
subsequent assessment of mining, environmental, processing,
permitting, taxation, socio-economic, and other factors.
Project Economics
The CLM project demonstrates robust LOM revenues over 17 years of
production and after-tax NPV5% of $501M. Total Capital Expenditure
for the project is $565M which requires $388M of initial capital
expenditure and $177M in sustaining and closure capital. The
project payback is 48 months.
Table 1: CLM Project Economics
|
Item
|
Units
|
Base Case
|
|
Revenue
|
US $M
|
$4,470
|
|
EBITDA
|
US $M
|
$2,076
|
|
LOM pre-tax
cash flow
|
US $M
|
$1,512
|
|
LOM
after-tax cash flow
|
US $M
|
$923
|
|
|
|
|
|
NPV pre-tax
(5% Discount)
|
US $M
|
$887
|
|
NPV pre-tax
(8% Discount)
|
US $M
|
$648
|
|
NPV pre-tax
(10% Discount)
|
US $M
|
$525
|
|
IRR
pre-tax
|
%
|
30.0%
|
|
|
|
|
|
NPV
after-tax (5% Discount)
|
US $M
|
$501
|
|
NPV
after-tax (8% Discount)
|
US $M
|
$340
|
|
NPV
after-tax (10% Discount)
|
US $M
|
$258
|
|
IRR After
Tax
|
%
|
21.2%
|
|
|
|
|
|
Initial
Capital Expenditures
|
US $M
|
$388
|
|
|
|
|
|
Payback
(discounted, after-tax)
|
months
|
48
|
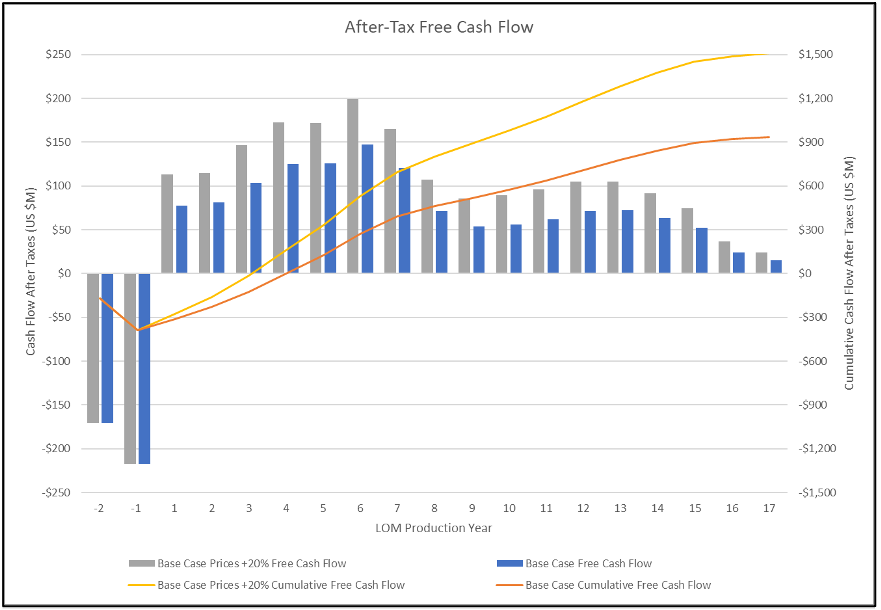
After-Tax, Free Cash Flow
Figure 1 illustrates the estimated annual and cumulative after-tax
cash flow over the life-of-mine for both the Base Case (blue) and
the Base Case +20% metal values (grey). Mine scheduling targets
higher margin mineralization in the first eight years of production
resulting in a more aggressive paydown of capital and improved
economics with an annual average After-tax Free-cashflow of $107M
in the first eight years of production and $78M over the
life-of-Mine.
Figure 1: Annual and LOM cashflow
Economic Sensitivities
The Project's gross revenues, NPV5% and IRR shows greatest
sensitivity to metal prices.
Table 2: Gross Revenue, NPV5% and IRR
sensitivity at base-case +/- 20% and current pricing
|
All Metal Price (Ag, Au, Cu, Pb,
Zn) Sensitivity
|
|
Metal Price
|
Revenue (US$M)
|
NPV, after tax @ 0%
(US$M)
|
NPV, after tax @ 5%
(US$M)
|
IRR, after Tax
|
|
Spot
|
$5,493
|
$1,583
|
$931
|
31.4%
|
|
+20%
|
$5,364
|
$1,501
|
$876
|
30.1%
|
|
Base Case
|
$4,470
|
$923
|
$501
|
21.2%
|
|
-20%
|
$3,576
|
$339
|
$122
|
9.9%
|
Note: Base Case price assumes Ag = $23.00/oz,
Au = $1850/oz, Cu = $4.00/lb, Pb = $1.00/lb, Zn = $1.25/lb
"Spot" assumes May 29 2024
prices: Ag = $31.53/oz, Au
= $2332/oz, Cu = $4.69/lb, Pb = $1.05/lb, Zn = $1.41/lb
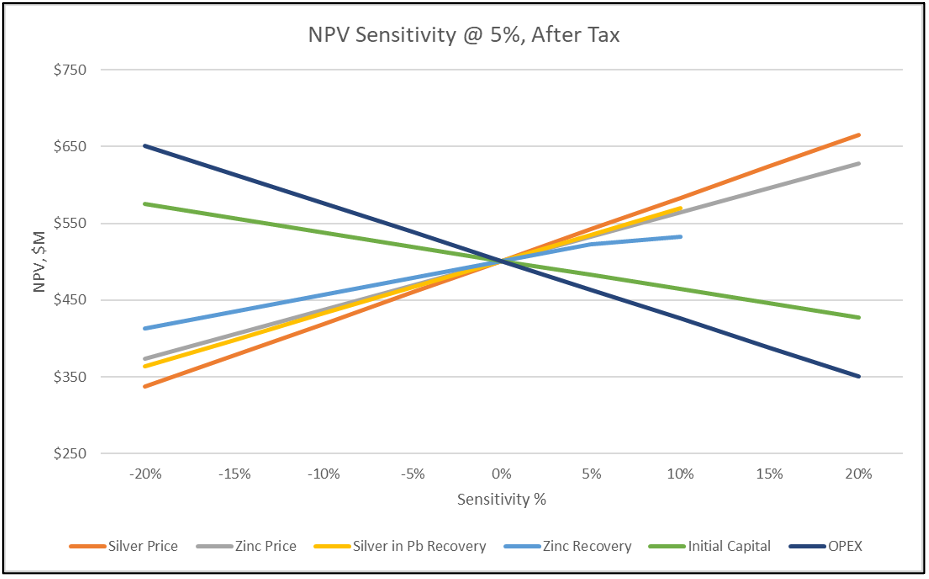
Other factors that may impact the NPV sensitivity include changes
in Operating Costs ("OpEx") and Initial Capital. These relative
impacts together with changes in silver and zinc prices are shown
in Table 3 and Figure 2.
Table 3: NPV sensitivity as a function of
select metals prices, recoveries, CapEx and OpEx:
|
Sensitivity
NPV @ 5%, after Tax (US$M)
|
|
Sensitivity
|
Silver
Price
|
Zinc
Price
|
Silver in Pb
Recovery
|
Zinc
Recovery
|
Initial
Capital
|
OPEX
|
|
20%
|
$665
|
$628
|
|
|
$427
|
$351
|
|
15%
|
$624
|
$596
|
|
|
$446
|
$388
|
|
10%
|
$583
|
$565
|
$570
|
$533
|
$464
|
$426
|
|
5%
|
$542
|
$533
|
$535
|
$523
|
$483
|
$464
|
|
0%
|
$501
|
$501
|
$501
|
$501
|
$501
|
$501
|
|
-5%
|
$460
|
$469
|
$467
|
$479
|
$520
|
$539
|
|
-10%
|
$419
|
$437
|
$433
|
$457
|
$538
|
$576
|
|
-15%
|
$378
|
$405
|
$398
|
$435
|
$556
|
$613
|
|
-20%
|
$337
|
$373
|
$364
|
$413
|
$575
|
$650
|
Note: +15% and +20% Silver and Zn recoveries
are not applicable
Figure 2: After-tax NPV5%
sensitivities
Production and Costs:
Annual mine production is estimated to deliver 14.3 Moz AgEq
(includes 5.8 Mozs Ag) to the processing facility averaged over a
17-year period. Potential annual product of sales (net deductions,
treatment and refining) averaging 11.4 Moz AgEq (includes 4.9 Mozs
Ag).
Peak annual Plant Feed is achieved in Year 6 with 22.3 Mozs AgEq
(includes 9.4 Moz Ag) being processed with peak annual product of
sales of 18.0 Moz AgEq (includes 7.9 Moz Ag). Table 4 summarizes
the estimated metal production from the CLM project.
Table 4: CLM LOM Production and Metal
Sales
|
|
Units
|
Y1-8
|
LOM
|
|
AgEq Plant
Feed (Yearly Average)
|
(Moz)
|
17.9
|
14.3
|
|
AgEq Product
of Sales (Yearly Average)
|
(Moz)
|
14.4
|
11.4
|
|
AgEq Plant
Feed (Total)
|
(Moz)
|
143.7
|
243.2
|
|
AgEq Product
of Sales (Total)
|
(Moz)
|
115.4
|
194.3
|
|
All-In
Sustaining Cost (AISC)
|
(US$/AgEq oz)
|
$12.23
|
$13.23
|
|
|
|
|
|
|
|
Units
|
Y1-8
|
LOM
|
|
Ag Plant
Feed (Yearly Average)
|
(Moz)
|
7.6
|
5.8
|
|
Ag Product
of Sales (Yearly Average)
|
(Moz)
|
6.5
|
4.9
|
|
Ag Plant
Feed (Total)
|
(Moz)
|
60.8
|
98.6
|
|
Ag Product
of Sales (Total)
|
(Moz)
|
51.9
|
83.9
|
Note: AgEq was determined assuming contained
metal and pricing
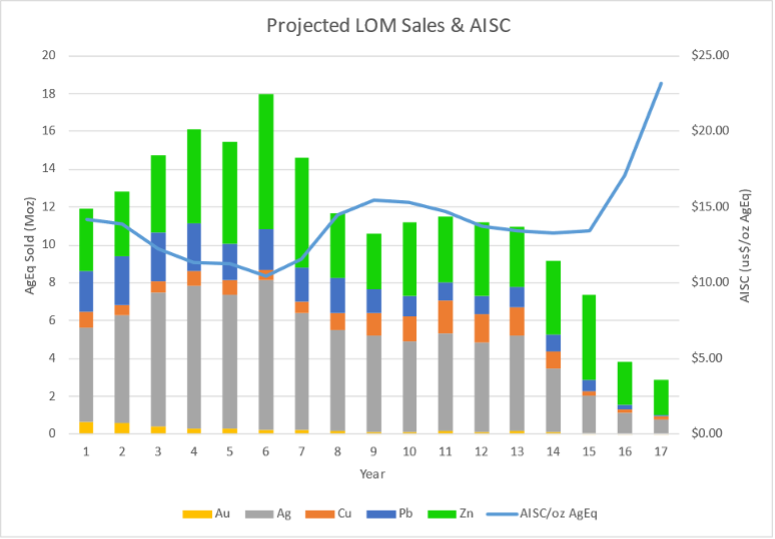
Mine Schedule and All-In-Sustaining-Cost
(AISC)
Mine scheduling targets higher value silver-lead production in the
first 8 years of mine life with lower AgEq grading material
(zinc-copper dominant) being targeted in the final 9 years. Total
plant feed (mine production) is estimated to be 243.2 Mozs AgEq
(includes 98.6 Mozs Ag) with 194.3 Moz AgEq (includes 83.9 Moz Ag)
sold. Total all-in sustaining costs ("AISC") are estimated to be
$US 2.57B averaging $US13.23/oz AgEq sold. LOM production and AISC
are illustrated in Figure 3.
Figure 3: LOM AgEq sales and AISC:
OPERATIONS:
Mining:
The mine plan was completed by Entech and incorporates longitudinal
and transverse longhole stoping methods. Two separate portals are
proposed to access the various deposits, with one portal accessing
the Blind-El Sol and Skarn Front deposits, and a second portal
accessing the La Bocona, South Skarn, and North Felsite deposits.
The process in creating the mine plan is further described
below:
-
Datamine® Mineable Stope Optimizer ("MSO")
was used to produce shapes for mine planning purposes. The Resource
model from March 22, 2023 by Kirkham Geosciences Ltd. was used for
the evaluation and MSO analyses considered a preliminary cut-off
value of $60/t NSR;
-
The Resource Model is restated with
standardized metal prices, metal recoveries and smelter terms in
this current disclosure (see Appendices);
-
MSOs considered a minimum mining width of 3.5
m (inclusive of 1.0 m width for unplanned dilution in rock), 25 m
sub-levels, and 20 m strike lengths;
-
A total of 29.5 Mt averaging $131/t NSR (104
g/t Ag, 0.11g/t Au, 0.19 % Cu, 1.06 % Pb, and 2.41 % Zn) was sent
to the processing facility, representing a conversion of
approximately 88.3% of the Resource value at a $60/t cut-off
value;
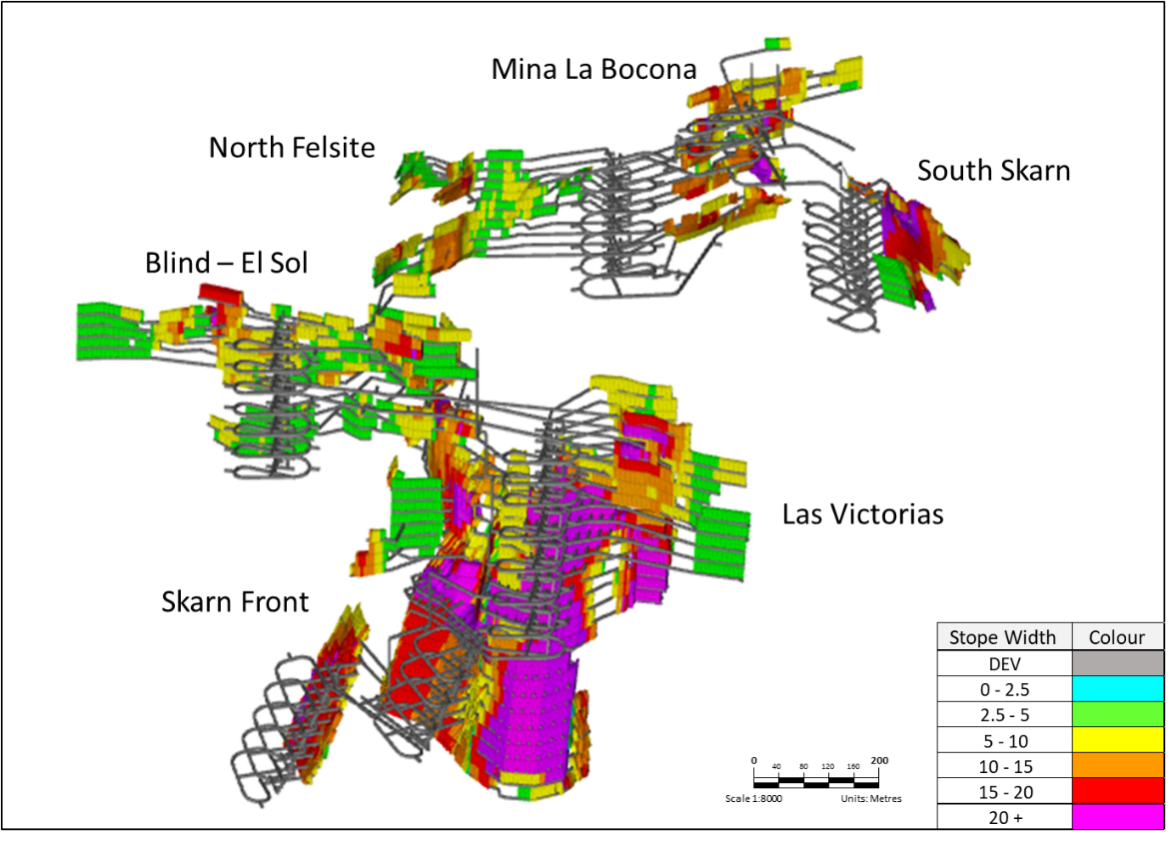
-
Depending on the width of the stope and the
strike of continuous sections of wider zones, transverse stoping
was selected and mined bottom-up. For predominately narrower zones
(typically less than 18m) longitudinal stoping was selected and
mined either top-down or bottom-up depending on location and timing
of development. Overall, the average stope width by tonnage was
16.5 m;
-
Detailed geotechnical analysis including
hydrogeological modelling is to be completed in further studies of
the deposit, however preliminary investigations have been
completed. The preliminary investigations support the selection of
longhole stoping as an appropriate method for this Preliminary
Economic Assessment. An equivalent linear overbreak slough (ELOS)
was assumed to be 1.0m (0.5m from each wall) and additional
dilution for mining of backfill was considered. Backfill dilution
was varied depending on exposure, with 0.5m considered from the
backs (top-down), 0.25m from the floor (bottom-up), 0.5m from the
far wall (longitudinal stoping), and 0.5m from one adjacent wall
(transverse stoping mined centre-out);
-
A stope recovery factor of 93% and
development recovery factor of 97% was considered.
The grade and average stoping widths are illustrated in Figure 4
and Figure 5 respectively.
Figure 4: US$NSR/t grade distribution of the
Cerro Las Minitas MSO model - looking northeast
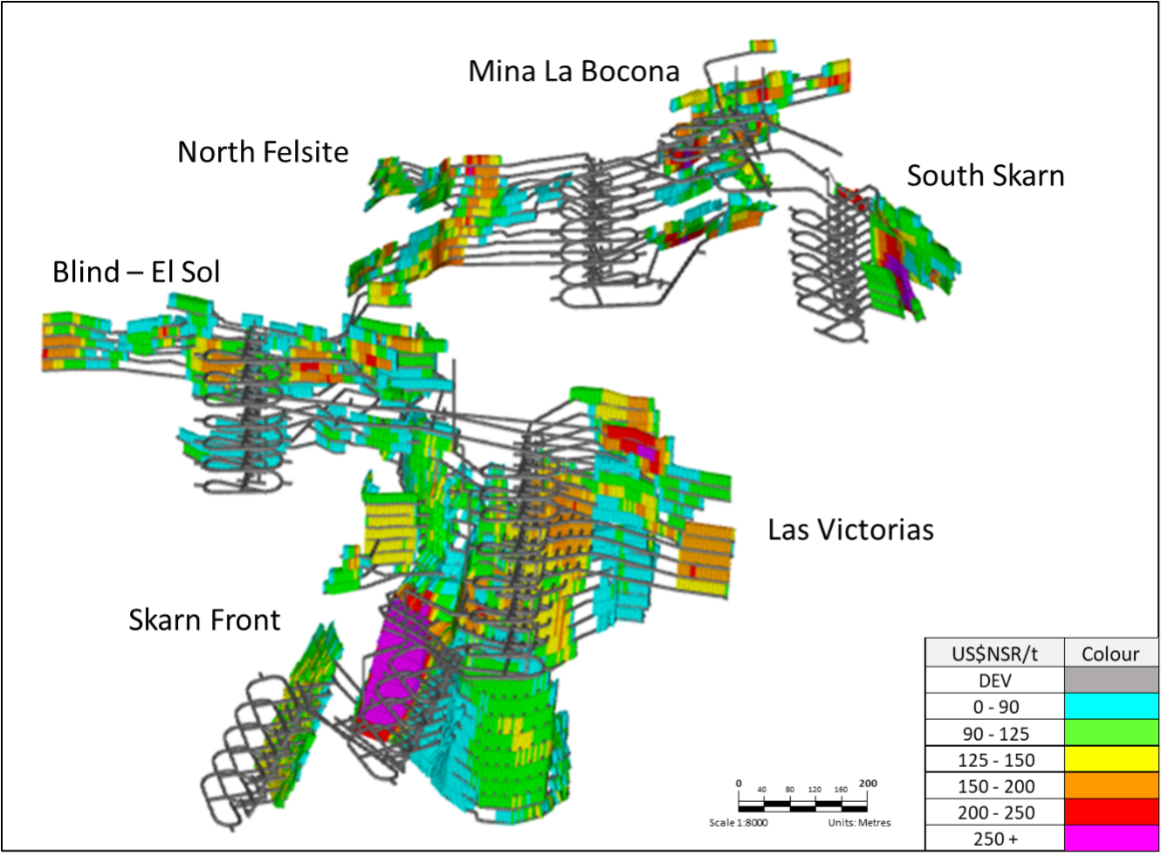
Figure 5: Average Stope Width of the Cerro Las
Minitas MSO model - looking northeast
Processing:
The process plant for the PEA study is a conventional sulphide
flotation system consisting of:
-
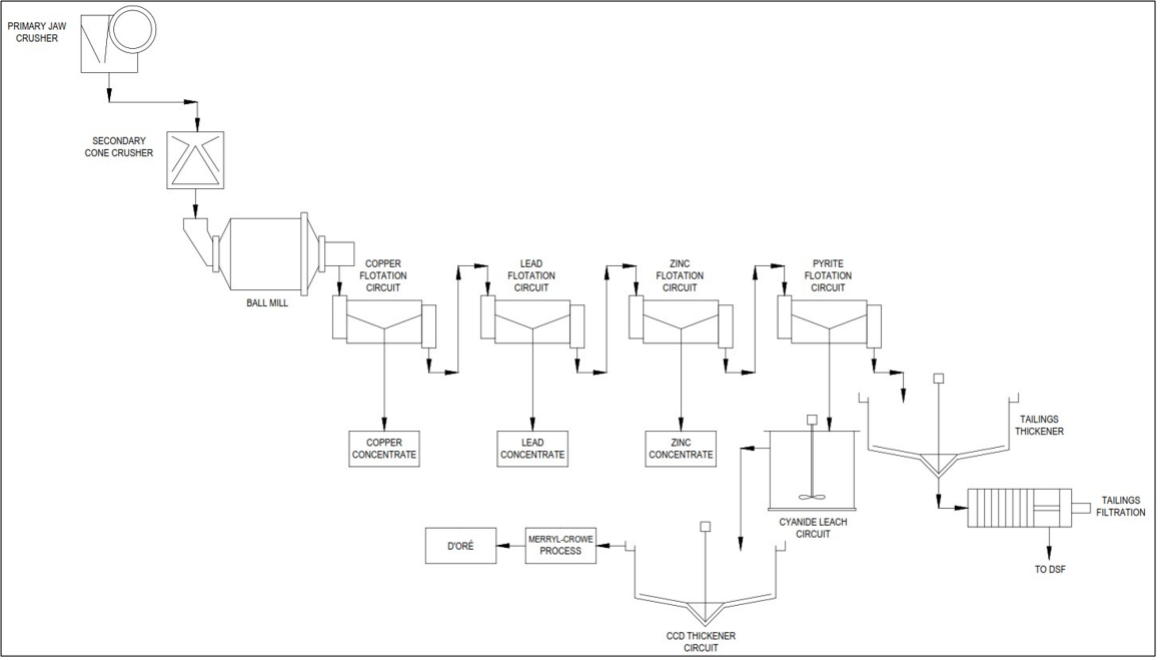
Primary jaw crushing to a 15,000 tonnes ROM
stockpile, reclaim and secondary crushing, closed-circuit ball mill
grinding and sequential Cu-Pb-Zn (each with rougher-regrind-cleaner
stages) flotation circuit producing three filtered concentrates for
sale and a gold-bearing pyrite concentrate for
leaching.
-
The pyrite leach incorporates ultra-fine
grinding to improve conventional cyanidation and gold recovery by
Merrill-Crowe precipitation and induction melting to produce Au-Ag
doré bars.
-
Barren tailings to Paste Plant for
underground mine cement backfill with the surplus, dry-stacked to
surface
-
Design Annual Throughput of 1,935 kilo-tonnes
based on nominal 5,300 tpd throughput.
Head grades:
MSO scheduling successfully prioritized higher grade material to
the mill earlier in the mine life resulting in higher heads grades
(and associated annual revenue) in the first eight years of
production as compared to the final 10 years.
Table 5: Head grade over Yr1-8 and LOM
|
HEAD GRADES
|
Units
|
Y1-8 Average
|
LOM
|
|
Avg. Annual
Plant Feed
|
(kt)
|
1,930
|
1,930
|
|
Ag
|
(g/t)
|
119
|
104
|
|
Au
|
(g/t)
|
0.14
|
0.11
|
|
Cu
|
(%)
|
0.15
|
0.19
|
|
Pb
|
(%)
|
1.37
|
1.06
|
|
Zn
|
(%)
|
2.45
|
2.41
|
|
AgEq
|
(g/t)
|
290
|
257
|
Recoveries and Tailings:
-
A series of Batch/Locked cycle
testwork/variability testwork programs conducted between 2018 and
2023 confirmed that the Cu-Pb-Zn sequential flotation flowsheet
would be appropriate for processing all the sulphide mineralization
from the deposit.
-
Testwork conducted in 2023 indicated that
gold in oxide was readily leachable at high (>80%) recoveries,
while approximately 70% of the gold present in sulphide material
could be concentrated in the pyrite-rich concentrate while 20%
reported to the copper concentrate.
Ultra-fine grinding of the pyrite to 80%
passing 6 micron improved the extraction of Au by cyanidation from
17% to 40% while oxidative pre-treatment increased the gold
extraction to 83% but with very high oxygen and cyanide
consumption. An economic evaluation determined that the oxidation
step could not be justified.
-
Circuit design based on stainless grinding
media and optimised reagent selection for sequential flotation
which maximizes base metal grades and recoveries while minimizing
misplacement of base metals to other concentrates.
-
While mining progresses through various
geo-metallurgical ore types, the plant is designed to handle wide
variations in both grade and sulphide mass pull.
-
Non-sulphide tailings surplus to the backfill
requirements are dry stacked in a suitable area some 1000m NW of
the process plant.
Concentrate Terms:
Metal Payables
The project is expected to produce four saleable concentrates of
sufficient quality to be marketable to a variety of global
smelters.
Approximately 93% of Ag is recovered with 77 % reporting to the Pb
concentrate, 6% to the Cu concentrate, 7% to the Zn concentrate and
3% to the leach circuit.
Table 6: Metal Recoveries established for the
PEA
|
Item
|
Pb Conc.
|
Zn Conc.
|
Cu Conc.
|
Dore
|
|
Pb Recovery
|
87%
|
|
|
|
|
Zn Recovery
|
|
93%
|
|
|
|
Cu Recovery
|
|
|
70%
|
|
|
Ag Recovery
|
77%
|
7%
|
6%
|
3%
|
|
Au Recovery
|
|
|
20%
|
28.6%
|
|
Concentrate Grade (Primary Base Metal)
|
65%
|
54%
|
27%
|
|
Refining and Treatment:
Treatment and refining charges were based on consultation with
industry professionals and generated the terms indicated below:
Table 7: Refining and Treatment
|
|
Ag
|
Au
|
Cu
|
Pb
|
Zn
|
|
Cu Concentrate
|
|
|
|
|
|
|
Average
Concentrate Grade LOM
|
1,266g/t
|
4.3g/t
|
27%
|
-
|
-
|
|
Payable
Metal
|
90%
|
90%
|
97%
|
-
|
-
|
|
Minimum
Deduction
|
-
|
-
|
1 unit
|
-
|
-
|
|
Pb Concentrate
|
|
|
|
|
|
|
Average
Concentrate Grade LOM
|
5,641g/t
|
-
|
-
|
65%
|
-
|
|
Payable
Metal
|
95%
|
-
|
-
|
95%
|
-
|
|
Minimum
Deduction
|
50g/t
|
-
|
-
|
3 Units
|
-
|
|
Zn Concentrate
|
|
|
|
|
|
|
Average
Concentrate Grade LOM
|
180g/t
|
-
|
-
|
-
|
53.50%
|
|
Payable
Metal
|
70%
|
-
|
-
|
-
|
85%
|
|
Minimum
Deduction
|
3oz/t
|
-
|
-
|
-
|
8 units
|
|
Dore
|
|
|
|
|
|
|
Contained
kozs
|
2,927
|
28.9
|
-
|
-
|
-
|
|
Payable
Metal
|
99%
|
100%
|
-
|
-
|
-
|
The high Ag grade in the Pb concentrate makes it attractive to
smelters and could result in more favourable treatment terms, but
these have not been considered at the PEA level. Penalty elements
are low, with Cd (in solution with Zn) ($8.9/t conc.) being the
major contributor to Zn penalties, and Sb (in solution with Pb)
being the major source of Pb penalties ($27/t conc).
Concentrate Transportation:
Transportation costs assume trucking of the concentrate via
containers to the international port at Manzanillo, Colima, and
then shipping via ocean freight to Asia. Estimated transportation
costs (trucking, port handling and ocean freight) are US$96/wmt
(wet metric tonnes) for Pb concentrate and US$106/wmt for Zn
concentrate. Moisture contents are assumed to be 8.5% based on the
grind size of the final concentrates.
CAPITAL EXPENDITURES:
Total initial capital investment in the project is estimated to be
$388 million and includes $50 million contingency, which represents
the total direct and indirect cost for the development of the
project, including associated infrastructure.
Table 8: Capital Expenditure
break down.
|
Item
|
Total ($M)
|
|
Process Plant and Infrastructure
|
|
|
Project Directs including freight
|
$159.7
|
|
Project Indirects
|
$38.9
|
|
Owner Costs
|
$8.0
|
|
Contingency
|
$50.1
|
|
Sub-Total
|
$257
|
|
Mining
|
|
|
Pre-Production Capital Costs
|
$131
|
|
Total Initial Capital Costs
|
$388
|
|
Sustaining Capital and Closure Costs
|
$177
|
|
Total Capital Costs
|
$565
|
Mining Development Costs:
Mining development costs were developed by Entech considering a
mining contractor model. Total capital costs including sustaining
capital allocated to mining are approximately $US291M comprising of
the following:
Table 9: Mining Capital Breakdown
|
Item
|
Total ($M)
|
|
Capitalised
Operating Expense
|
31
|
|
Pre-Production Capital Development
|
65
|
|
Pre-Production Fixed and Mobile Plant
|
6
|
|
Pre-Production Capital Infrastructure
|
28
|
|
Pre-Production Surface Infrastructure
|
2
|
|
Total Pre-Production Mining Capital
Costs
|
131
|
|
Sustaining
Capital Development
|
114
|
|
Sustaining
Fixed and Mobile Plant
|
25
|
|
Sustaining
Capital Infrastructure
|
22
|
|
Total Mining Sustaining Capital
Costs
|
160
|
|
Total Mining Capital Costs
|
291
|
-
Initial development costs are approximately
$65M;
-
Sustaining development are approximately
$114M;
-
Reallocated operating expense of
$31M.
-
Contractor mobilization, equipment purchases
and half-life rebuilds (pumps, primary and auxiliary fans,
compressors, and substations) are approximately $30M;
-
Initial project capital expenses (portals,
primary fans, initial pump stations, refuge chambers, etc. plus a
25% contingency) are approximately $50M; and,
-
Total lateral capital development cost of
$6,594 /m and includes a reallocation of operating expense to
capital of $845 /m;
Direct costs of $4,211 /m and indirect costs of $1,538
/m.
Operating Costs
Operating costs are broken down into Mining, Processing, G&A
and Treatment and Refining costs, plus additional production
charges including government royalty, employee profit sharing and
closure expenses. Operating costs were developed by Ausenco and
Entech (Mine Operating Cost).
Table 10: Operating cost breakdown on a per
tonnage basis
|
Area
|
$/t ore processed
|
|
Mine Operating Cost
|
$41.22
|
|
Process Plant Operating Cost
|
$15.82
|
|
G & A
|
$4.33
|
|
Operating Cost
|
$61.37
|
|
Treatment & Refining Charges
|
$19.88
|
|
Sustaining Capital Costs
|
$5.43
|
|
Closure Cost
|
$0.56
|
|
Other Production Cost
|
$25.87
|
|
Total
|
$87.24
|
Mining:
The operating costs reflect a contractor mining option which defers
capital but utilizes the experience of a contractor for initial
construction and development of the mine. Mining considers a modern
and large operation using large 21-t loaders and 63-t capable
trucks targeting an average daily plant feed of approximately 5,300
tpd and 6,900 tpd when including waste development (peak of 7,800
tpd in production Year 4) as both portals are in production.
Mining costs are developed by Entech and are from Entech's cost
database which includes pricing from mining contractors.
Table 11: Production and Development
Breakdown
|
Item
|
Total ($M)
|
Total ($/t)
|
|
Development
|
$190
|
$6.45
|
|
Production
|
$1,024
|
$34.77
|
|
Total Production and Development
Costs
|
$1,214
|
$41.22
|
Operating costs are summarized as follows and are appropriate for a
Preliminary Economic Assessment:
-
Total underground mining operating costs are
approximately $1,214M at an average of $41.22/t;
-
Operating development (including non-capital
waste development) of $3,087 /m (direct costs of $2,720 /m) and
averages on a per tonne basis of $6.45 /t;
-
Production costs of $34.77 /t of which $29.54
/t are direct costs and $5.23 /t are indirect costs which includes
labour (mine management/technical services), maintenance, power,
and other costs.
Processing and General & Administration
costs ("G+A"):
The process plant is a conventional sulphide flotation system
consisting of both primary and secondary crushing, a closed-circuit
ball mill grinding and sequential Cu-Pb-Zn flotation circuit
producing three filtered concentrates for sale. A fourth pyrite
concentrate is produced for leaching.
Operating costs are as follows:
Table 12: Breakdown of Process Plant Operating
cost
|
Operating &
Maintenance
|
$/t ore processed
|
|
Labor
|
$1.40
|
|
Electrical Power
|
$4.64
|
|
Reagents
|
$5.04
|
|
Liners/Grinding Media
|
$1.94
|
|
Maintenance Parts
|
$0.95
|
|
Supplies and Services
|
$1.65
|
|
Fresh Water Supply
|
$0.19
|
|
Total (US$)
|
$15.82
|
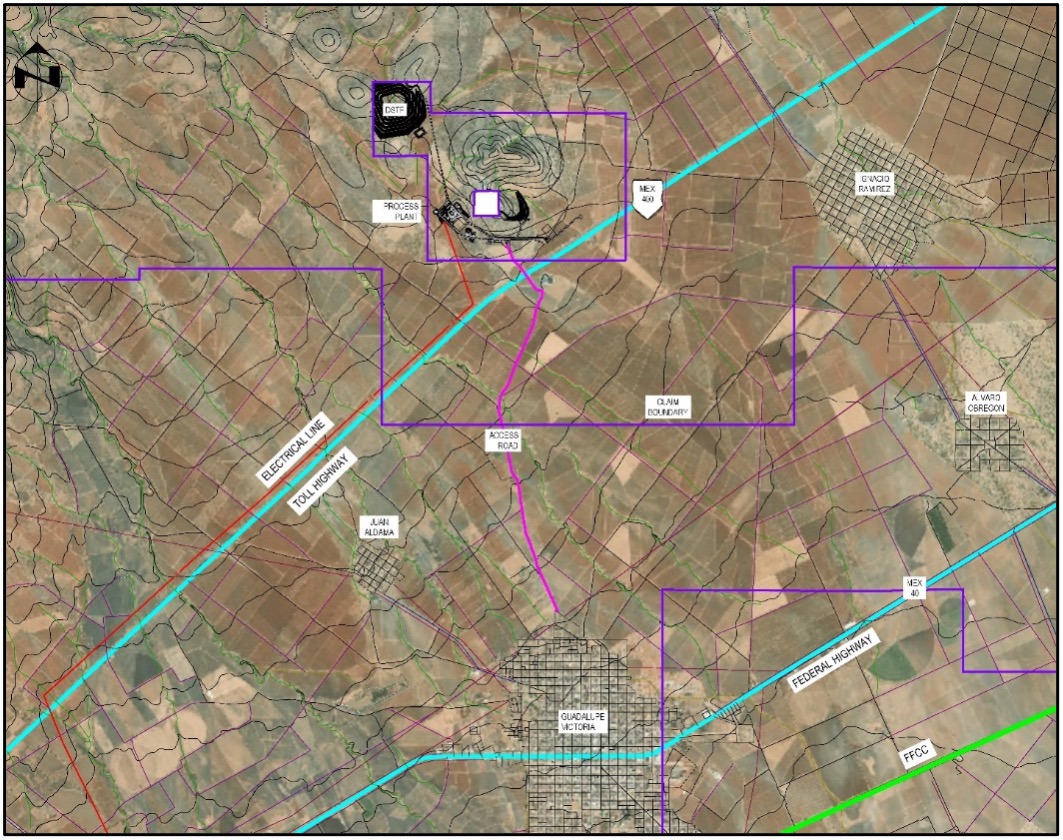
G&A costs reflect a well-located project in an area of
excellent infrastructure and immediately adjacent to the town of
Guadalupe Victoria (population: ~35,000).
Opportunities:
Mine life extension: Mineralization on
the eastern and northern sides of the Cerro remains relatively
under-drilled and several gaps occur in the current resource model
both at relatively shallow depths and down dip of several of the
main higher-grade zones. Identification of further mineralization
at relatively shallow depths would potentially add more value in
the earliest parts of the mine schedule.
Infill Drilling: Infill drilling,
specifically on the portions of the deposit that fall within the
Inferred category of classification will increase confidence in the
Mineral Resource estimate, will further de-risk the project and
potentially increase the value of the project.
Metallurgical Upside: XRT-based
preconcentration testwork showed excellent discrimination between
sulphide and oxide material enabling a 3-4x upgrade of run-of-mine
rock crushed to 80% passing 75mm with the sub-15 mm fines removed.
Pay metal retention in the sulphidic fraction exceeded 98%. This
option provides an excellent opportunity for further reductions in
project Capex and Opex should the need arise.
Technical Disclosure
-
All mineral resources have been estimated in
accordance with Canadian Institute of Mining and Metallurgy and
Petroleum (CIM) definitions, as required under
NI43-101.
-
Mineral resources reported demonstrate
reasonable prospect of eventual economic extraction, as required
under NI43-101.
-
Mineral resources are not mineral reserves
and do not have demonstrated economic viability. The mineral
resources may be materially affected by environmental, permitting,
legal, marketing, and other relevant issues.
-
The PEA is preliminary in nature, it may
include mineral resources that are considered too speculative
geologically to have the economic considerations applied to them
that would enable them to be categorized as mineral reserves, and
there is no certainty that the PEA will be realized.
-
An inferred mineral resource has a lower
level of confidence than that applying to an indicated mineral
resource and must not be converted to a mineral reserve. It is
reasonably expected that most of the inferred mineral resources
could be upgraded to indicated mineral resources with continued
exploration.
-
AISC is calculated as: Operating costs
(mining, processing and G&A) + Incremental PTUs + Concentrate
Transportation + Treatment & Refining Charges + Penalties +
Sustaining Capital + Closure Costs +Silver Revenue Royalty and is
reported on using a per tonne mined, AgEq plant feed and AgEq
payable basis
-
A full
technical report
will be
prepared in
accordance with
NI 43-101
and will
be filed
on SEDAR
within 45 days of this press
release.
Appendices
Appendices with the following supporting information is found at
the back of this release.
Appendix A: Sulphide Mineral Resource Estimate
Appendix B: Project location and Infrastructure
Appendix C: Simplified Process Flow Sheet
About Southern Silver Exploration
Corp.
Southern Silver Exploration Corp. is an exploration and development
company with a focus on the discovery of world-class mineral
deposits either directly or through joint-venture relationships in
mineral properties in major jurisdictions. Our specific emphasis is
the 100% owned Cerro Las Minitas silver-lead-zinc project located
in the heart of Mexico's Faja de Plata, which hosts multiple
world-class mineral deposits such as Penasquito, Los Gatos, San
Martin, Naica and Pitarrilla. We have assembled a team of highly
experienced technical, operational and transactional professionals
to support our exploration efforts in developing the Cerro Las
Minitas project into a premier, high-grade, silver-lead-zinc mine.
Our property portfolio also includes the Oro porphyry copper-gold
project and the Hermanas gold-silver vein project where permitting
applications for the conduct of a drill program is underway, both
located in southern New Mexico, USA
On behalf of the Board of Directors
"Lawrence Page"
Lawrence Page, K.C.
President & Director, Southern Silver Exploration Corp.
For further information, please visit Southern Silver's website at
https://www.southernsilverexploration.com
or contact us 604.641.2759 by email at corpdev@mnxltd.com.
Qualified Person
The PEA for the Cerro Las Minitas project as summarized in this
release was completed by Kirkham Geosystems Ltd. ("KGL"), Ausenco
Engineering USA South Inc. and Ausenco Sustainability ULC.
("Ausenco"), Entech Mining Limited ("Entech"), and MPC
Metallurgical Process Consultants Limited ("MPC"). A full technical
report will be prepared in accordance with NI43-101 and will be
filed on SEDAR within 45 days of this press release.
The scientific and technical content of this news release was
reviewed and approved by Robert Macdonald, MSc. P.Geo, VP.
Exploration, who is a Qualified Person as defined by National
Instrument 43-101 – Standards of Disclosure for Mineral
Projects.
Neither TSX Venture Exchange nor its Regulation
Services Provider (as that term is defined in the policies of the
TSX Venture Exchange) accepts responsibility for the adequacy or
accuracy of this release.
This news release contains forward-looking
statements. Forward-looking statements address future events and
conditions and therefore involve inherent risks and uncertainties.
Actual results may differ materially from those currently
anticipated in such statements. Factors that could cause actual
results to differ materially from those in forward looking
statements include the timing and receipt of government and
regulatory approvals, and continued availability of capital and
financing and general economic, market or business
conditions. Southern Silver
Exploration Corp. does not assume any obligation to update or
revise its forward-looking statements, whether as a result of new
information, future events or otherwise, except to the extent
required by applicable law.
Appendix A:
Sulphide Mineral Resource Estimate as of March 20, 2024


1)
The current Resource Estimate was prepared by Garth Kirkham,
P.Geo., of Kirkham Geosystems Ltd.
2)
All mineral resources have been estimated in
accordance with Canadian Institute of Mining and Metallurgy and
Petroleum ("CIM") definitions, as required under National
Instrument 43-101 ("NI43-101").
3)
Mineral resources were constrained using continuous mining units
demonstrating reasonable prospects of eventual economic
extraction.
4)
Silver Equivalents were calculated from the interpolated block
values using relative recoveries and prices between the component
metals and silver to determine a final AgEq value. Metal
recoveries: 95%. silver, 75% gold, 70% copper, 87% lead and 93.2%
zinc.
5)
Silver Equivalents and NSR$/t values were calculated using average
long-term prices of $22.5/oz. silver, $1,850/oz. gold, $3.78/lb.
copper, $0.94/lb. lead and $1.25/lb. zinc. All prices are stated in
US$.
6)
The formula used for NSR$/t calculations was as follows - $NSR =
(Ag g/t x 0.55) + (Au g/t x 34.45) + (Cu% x 48.68) + (Pb% x 13.41)
+ (Zn% x 15.59)
7)
Mineral resources are not mineral reserves
until they have demonstrated economic viability. Mineral resource
estimates do not account for a resource's mineability, selectivity,
mining loss, or dilution.
8)
An Inferred Mineral Resource has a lower level
of confidence than that applying to an Indicated Mineral Resource
and must not be converted to a Mineral Reserve. It is reasonably
expected that the majority of Inferred Mineral Resources could be
upgraded to Indicated Mineral Resources with continued
exploration.
9)
All figures are rounded to reflect the relative
accuracy of the estimate and therefore numbers may not appear to
add precisely.
Model
Parameters for the Blind, El Sol, Skarn, South Skarn, Bocona, and
North Felsite Zones
-
The mineralized zones were initially defined
by Southern personnel and subsequently adjusted and redefined,
validated and verified by KGL. The mineralized wire frames were
defined using a combination of geological constraints and grade
boundaries in addition to consideration of potential reasonable
mining thickness. Intervals that were not sampled were assigned a
zero grade.
-
The estimates were carried out using a
separate block models constrained by 3D wireframes of the
individual mineralized zones. The chosen block size was 10 m by 10
m by 2 m, roughly reflecting the drill hole spacing (i.e., 4–6
blocks between drill holes) which is spaced at approximately 50 m
centres. Note: MineSightTM uses the centroid of the blocks as the
origin. It should be noted that the South Skarn employs
sub-blocking as opposed to partial percentage for the coding of the
block models. In this case the parent block size is 10 m X 10 m X 3
m while the sub-block size is 0.5 m X 0.5 m X 0.3 m. Grades for Ag,
Au, Cu, Pb and Zn are interpolated using Ordinary Kriging within
the Bocona/North Felsite zone and Inverse Distance to the second
power (ID2) weighting for the South Skarn and North Felsite
Hangingwall zones. The Skarn zone is interpolated using inverse
distance to the third power (ID3) with a form of dynamic
anisotropy. NSR/t, silver equivalent and zinc equivalent values
were subsequently calculated from the interpolated block
grades.
-
The interpolation was carried out in two
passes using progressively larger search radii along strike and
down dip of 60m x 60m to a maximum of 100m x 100m. Composites were
restricted to a minimum of 3 and a maximum of 9 composites, with a
maximum of 3 composites from any one drill hole.
-
Bulk densities were based on a total of 3,146
individual measurements taken by Southern Silver field personnel
from key mineralized zones. Density values ranged from 1.04 t/m3 to
5.33 t/m3 and average to 2.89 t/m3. Specific gravities were
calculated on a block-by-block basis by interpolating the SG
measurements using inverse distance to the second power and limited
within the individual mineralized zone solids. A default density of
2.85 t/m3 was assigned to any blocks that were not assigned a
calculated value.
-
Silver composite values have been capped in
order to remove the effects of potential overestimation due to
statistical outliers. The threshold chosen was 700 g/t silver for
the Bocona/North Felsite and North Felsite HW zones. In addition,
outlier values for the co-product metals were capped at the
threshold levels of 1.5 g/t gold, 2% copper, 18% lead and 10% zinc
at Bocona/North Felsite and 2 g/t gold, 0.2% copper, 3% lead and 5%
zinc for the North Felsite HW zones, respectively.
-
The high-grade outlier thresholds were chosen
by domain and are based on an analysis of the breaks in the
cumulative probability plots for each of the mineralized domains
for each of the zones.
-
Mineral resources for the Cerro Las Minitas
deposit were classified according to the CIM Definition Standards
for Mineral Resources and Mineral Reserves (2014) by Garth Kirkham,
P.Geo., an "independent qualified person" as defined by National
Instrument 43-101. Drill hole spacing in the Cerro Las Minitas
deposit is sufficient for preliminary geostatistical analysis and
evaluating spatial grade variability. Kirkham Geosystems is,
therefore, of the opinion that the amount of sample data is
adequate to demonstrate very good confidence in the grade estimates
for the deposit. The estimated blocks were classified according to
the following:
confidence in interpretation of the mineralized zones;
number of data used to estimate a block;
number of composites allowed per drill hole; and
distance to nearest composite used to estimate a block.
-
Blocks were classified as indicated if they
were within approximately 50 m of a composite and were interpolated
with a minimum of two drill holes. Note: There were no blocks
classified as Measured resources. Blocks were classified as
Inferred if the nearest composite was less than 100 m from the
block being estimated. Furthermore, an interpreted boundary was
created for the indicated and inferred threshold in order to
exclude orphans and reduce "spotted dog" effect. The remaining
blocks were unclassified and may be considered as geologic
potential for further exploration. Furthermore, in consideration
for the requirement for resources to possess a "reasonable prospect
of eventual economic extraction" (RP3E), underground mineable
shapes were created that displayed continuity based on cut-off
grades and classification. Additionally, these RP3E shapes also
took into account must-take material that may fall below cut-off
grade but will be extracted by mining in the event that adjacent
economic material is extracted making below cut-off material by
virtue of the mining costs being paid for.
-
Appendix B:
Project Location and Site Infrastructure
Appendix C:
Simplified Process Flow Sheet
The process plant for the PEA study is a conventional sulphide
flotation system consisting of both Primary and secondary crushing,
a closed-circuit ball mill grinding and sequential Cu-Pb-Zn
flotation circuit producing three filtered concentrates for sale.
A fourth pyrite concentrate will be produced and leached.