BioSyent Releases Third Quarter Results; Record Quarterly Sales and Profit: Sales Up 60%, Profit Up 79%
November 15 2012 - 7:00AM
Marketwired Canada
BioSyent Inc. ("BioSyent") (TSX VENTURE:RX) today released a summary of its
Third Quarter (Q3) 2012 financial results.


--  Q3 2012 Sales of $1,575,598 sets an all time quarterly record and grew
    by 60% over Q3 2011
--  Q3 2012 Pharmaceutical Sales of $1,180,718 grew by 95% vs. $604,523 in
    Q3 2011
--  Sales for the nine months ended September 30, 2012 of $3,696,201 grew by
    76% over the prior year period
--  Total Comprehensive Income for Q3, 2012 of $423,015 hit an all time
    quarterly record and was higher than that of 2011 by 79%
--  Total Comprehensive Income for the nine months ended September 30, 2012
    of $1,034,828 grew by 196% over the corresponding prior year period
--  Cash generation of $878,751 for the nine months ended September 30, 2012
    increased by 147% over the corresponding period in 2011
--  Q3 2012 basic earnings per share (EPS) were $0.03
--  Cumulative Basic EPS over the last 4 consecutive quarters is $0.09


Total Sales for Q3 2012 hit a new quarter record and were $1,575,598 or 60%
higher compared to $983,857 in the corresponding prior year period and 30%
higher than the immediately preceding quarter (Q2 2012) which had sales of
$1,216,115. For the nine months ended September 30, 2012, the Total Sales of
$3,696,201 were 76% higher than the corresponding prior year period.


Pharmaceutical Sales were $1,180,718 in Q3 2012, or 95% higher than the
corresponding prior year period sales which were $604,523. For the nine months
ended September 30, 2012, Pharmaceutical Sales of $2,996,115 were 115% higher
than $1,392,334 in the corresponding prior year period.


The Company earned Total Comprehensive Income of $423,015 in Q3 2012, which was
79% higher than the Total Comprehensive Income of $235,999 in Q3 2011. For the
nine months ended September 30, 2012, the Total Comprehensive Income of
$1,034,828 was 196% higher than $349,452 in the corresponding prior year period.


Working capital has increased by 94% from $1,128,065 as at December 31, 2011 to
$2,184,891 as at September 30, 2012. Cash and cash equivalents on September 30,
2012 were 89% of working capital compared to 94% as at December 31, 2011. Total
Cash generation for the nine months ended September 30, 2012 of $878,751
increased by 147% over the corresponding prior year period.


The Company's subsidiary BioSyent Pharma Inc. is completing preparations for a
Q1 2013 launch of FeraMAX(R) Powder which was approved by Health Canada earlier
this year.


The Financial Statements and Management's Discussion & Analysis will be posted
on www.sedar.com on November 15, 2012.


As at the date of this press release the Company had 12,921,195 shares issued
and outstanding.


For a direct market quote (15 minutes delay) for the TSX Venture Exchange and
other Company financial information please visit www.tmxmoney.com.


BioSyent Inc. continues to concentrate on its pharmaceutical strategy to source
products that have been successfully developed and proven to be safe and
effective; manage these products through the regulatory process and product
registration (approval); and once approved, market these products in Canada. The
Company is focused on medications that occupy a niche in the market, that are
unique either due to complexity of manufacture or provide novel technological or
therapeutic advantages, or that are backed by strong partners holding
intellectual property rights that are defendable. This strategy allows the
Company to market these medications as brands owned by, or licensed to, it.


BioSyent Inc. is a publicly traded specialty pharmaceutical company whose wholly
owned subsidiary, BioSyent Pharma Inc., sources, acquires or in-licences
pharmaceutical products and markets these products in Canada. Wholly owned
BioSyent subsidiary Hedley Technologies Ltd. operates the company's legacy
business marketing bio and health friendly non-chemical insecticides. BioSyent
common shares are listed for trading on the TSX Venture Exchange (TSXV) under
the symbol RX.


This press release may contain information or statements that are
forward-looking. The contents herein represent our judgment, as at the release
date, and are subject to risks and uncertainties that may cause actual results
or outcomes to be materially different from the forward-looking information or
statements. Potential risks may include, but are not limited to, those
associated with clinical trials, product development, future revenue,
operations, profitability and obtaining regulatory approvals.


FOR FURTHER INFORMATION PLEASE CONTACT:
BioSyent Inc.
Rene C. Goehrum
President and CEO
www.biosyent.com
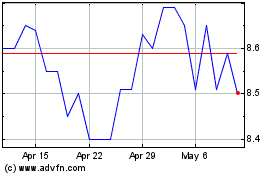
Biosyent (TSXV:RX)
Historical Stock Chart
From Jun 2024 to Jul 2024

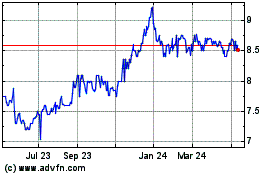
Biosyent (TSXV:RX)
Historical Stock Chart
From Jul 2023 to Jul 2024
