BioSyent Releases 2010 First Quarter Financial Results
May 28 2010 - 4:44PM
Marketwired Canada
BioSyent Inc. ("BioSyent") (TSX VENTURE:RX) today released a summary of its 2010
first quarter financial results.


Total Sales were 190% higher at $310,956 in the first quarter of 2010 compared
to $107,052 in the first quarter of 2009.


Gross Margins increased from 39.6% in Q1 of 2009, to 65.0% in 2010 primarily
because of lower sales of lower margin products and proportionately higher sales
of higher margin products.


The Company incurred a loss of ($50,907) in the first quarter of 2010, 70% lower
than a loss of ($168,197) in the first quarter of 2009.


Full details of 2010 first quarter results including March 31, 2010 Financial
Statements and Management's Discussion & Analysis will be posted on sedar.com on
April 28, 2010.


BioSyent Inc. continues to concentrate on its pharmaceutical strategy to source
products that have been successfully developed and proven to be safe and
effective; manage these products through the regulatory process and product
registration (approval); and once approved, market these products in Canada.
These pharmaceuticals will compete in both the branded and generic market
segments and will not require further product development investment other than
regulatory costs.


BioSyent Inc. is a publicly traded specialty pharmaceutical company whose wholly
owned subsidiary, BioSyent Pharma Inc., sources, acquires or in-licences
pharmaceutical products and markets these products in Canada. Wholly owned
BioSyent subsidiary Hedley Technologies Ltd. operates the company's legacy
business marketing bio and health friendly non-chemical insecticides. BioSyent
common shares are listed for trading on the TSX Venture Exchange (TSXV) under
the symbol RX.


This press release may contain information or statements that are
forward-looking. The contents herein represent our judgment, as at the release
date, and are subject to risks and uncertainties that may cause actual results
or outcomes to be materially different from the forward-looking information or
statements. Potential risks may include, but are not limited to, those
associated with clinical trials, product development, future revenue,
operations, profitability and obtaining regulatory approvals.
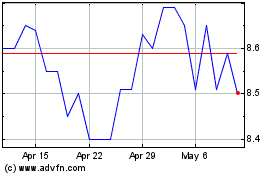
Biosyent (TSXV:RX)
Historical Stock Chart
From Jun 2024 to Jul 2024

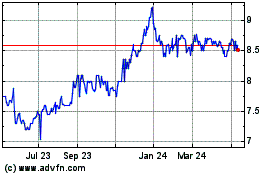
Biosyent (TSXV:RX)
Historical Stock Chart
From Jul 2023 to Jul 2024
