InterRent REIT Reports on Operations for Second Quarter 2010
August 12 2010 - 7:42PM
Marketwired Canada
NOT FOR DISTRIBUTION TO UNITED STATES NEWSWIRE SERVICES OR FOR DISSEMINATION IN
THE UNITED STATES


InterRent Real Estate Investment Trust (TSX:IIP.UN)(TSX:IIP.DB) ("InterRent")
today reported continued progress in the implementation of its strategic plan
along with the financial results for the second quarter ended June 30, 2010.


Highlights for the Three Months Ended June 30, 2010


--  Gross rental revenues for the quarter were $9.5 million, up 3.7%
    compared to Q2 2009 and 3.5% for the first half of the year compared to
    the first half of 2009.

--  Net revenues for the quarter were $8.4 million, a 4.5% decrease compared
    to Q2 2009 and a 3.4% decrease for the first half of the year compared
    to the first half of 2009. This decrease is as a result of the
    management's decision to move to market rates and more selective
    criteria for new tenants.

--  In keeping with management's repositioning strategy, the average monthly
    rent for the quarter increased to $789 per unit from $760 (Q2 2009) and
    from $780 (Q1 2010) an increase of 3.7% and 1.1% respectively.

--  The capital investments in rental units and common areas over the last
    quarter are expected to positively impact the ability to achieve market
    rents, attract stable tenants and reduce vacancies.

--  Net Operating Income (NOI) decreased by 15% to $3.9 million compared to
    Q2 2009 and a 16% decrease for the first half of the year compared to
    2009. Compared to Q1 2010, NOI is up by 29.8% over the first quarter of
    2010.

--  Operating costs increased, primarily due to the strategic decision in Q4
    2009 to outsource property management to a third party. This move was
    done in order to implement a complete restructuring of the operating
    model as well as property specific operating expenses and was required
    to achieve market rents. These costs have begun to return to stabilized
    levels and management expects them to decrease in Q3 and Q4.

--  Funds from Operations (FFO) were $0.60 million, up from $0.56 million
    over the three months ended March 31, 2009 and up $0.72 million from the
    first quarter of 2010. FFO per REIT unit was $0.02 for the three months
    ended June 30, 2010 compared to $0.03 in 2009.

--  Distributable Income (DI) was ($0.36) million, or ($0.01) per unit
    compared to ($0.06) million, or ($0.00) per REIT unit over the three
    months ended June 30, 2009.


Financial Highlights


----------------------------------------------------------------------------
                            3 Months     3 Months     6 Months     6 Months
                               Ended        Ended        Ended        Ended
 In $ OOO's (Except for     June 30,     June 30,     June 30,     June 30,
  per Unit)                    2010         2009          2010         2009
----------------------------------------------------------------------------
 Gross Rental revenue    $     9,451  $     9,118  $    18,823  $    18,181
 Less: Vacancy & rebates $     1,277  $       597  $     2,326  $     1,155
 Other revenue           $       218  $       271  $       450  $       509
  Net revenue            $     8,392  $     8,792  $    16,946  $    17,535
 Expenses
    Operating expenses   $     1,928  $     1,622  $     3,947  $     3,205
    Property taxes       $     1,472  $     1,415  $     2,947  $     2,830
    Utilities            $     1,130  $     1,210  $     3,214  $     3,362
                        ----------------------------------------------------
   Total expenses        $     4,530  $     4,247  $    10,108  $     9,397
                        ----------------------------------------------------
 Net operating income    $     3,862  $     4,545  $     6,838  $     8,138
                        ----------------------------------------------------
 Operating margins              46.0%        51.7%        40.4%        46.4%
----------------------------------------------------------------------------
 Funds from Operations
  (FFO)                  $       605  $       560  $       496  $     1,015
 FFO per weighted
  average Unit           $      0.02  $      0.03  $      0.02  $      0.06
----------------------------------------------------------------------------
 Distributable income
  (DI)                         ($356)        ($56)       ($991)        ($90)
 DI per weighted average
  Unit                        ($0.01)      ($0.00)      ($0.04)      ($0.00)
----------------------------------------------------------------------------

 Weighted average Units
  outstanding             28,486,967   18,286,719   28,269,933   18,282,874
----------------------------------------------------------------------------


Results for the Three Months Ended June 30, 2010

"The implementation of management's strategic plan is well underway. The
upgrades to property common areas and first impression upgrades will
significantly impact our ability to achieve market rents, attract stable tenants
and reduce vacancies" said Mike McGahan, Chief Executive Officer.


InterRent continues to focus on investing in energy efficient devices including
boilers as well as water and hydro saving devices. These investments help to
drive down operational costs while benefiting the environment. InterRent is also
upgrading common areas throughout the portfolio in order to maximize the
potential to increase rents on turnover throughout the portfolio.


"All the hard work our staff in the field have been doing is beginning to bear
fruit as we deliver on our plan. As of August 11, 2010, we have seen our per
unit vacancy rate come down to 7.4%. Although we still have much work to do,
this represents a significant increase in occupancy and indicates that we are on
the right path." said Mike McGahan, Chief Executive Officer.


In keeping with the management strategy of maximizing returns for unitholders
and focusing on clusters of buildings within geographical proximity to each
other in order to build operational efficiencies and attract focused,
professional staff, properties are reviewed on a regular basis to determine if
they should be kept or disposed of. As of August 11, 2010, two locations have
been listed and are conditionally sold. These locations represent a total of 26
units.


(i)Non-GAAP Measures

InterRent REIT assesses and measures segmented operating results based on
performance measures referred to as "Funds From Operations" ("FFO") and
Distributable Income ("Dl"). Both FFO and DI are widely accepted supplemental
measures on the performance of a Canadian real estate investment trust; however,
they are not measures defined by Canadian generally accepted accounting
principles ("GAAP"). The GAAP measurements most comparable to FFO and DI are
total cash flow from operating activities and net earnings. FFO and DI, however,
should not be construed as an alternative to net earnings or cash flow from
operating activities determined in accordance with GAAP as indicators of
InterRent REIT's performance. In addition, InterRent REIT's calculation
methodology for FFO and Dl may differ from that of other real estate companies
and trusts and therefore readers should not place reliance on these measures.


About InterRent

InterRent is a real estate investment trust engaged in building unitholder value
through the accretive acquisition, ownership and operation of strategically
located income producing multi-residential real estate, with 4,033 apartment
suites under ownership.


Forward Looking Statements

This news release contains "forward-looking statements" within the meaning of
the United States Private Securities Litigation Reform Act of 1995 and
applicable Canadian securities legislation. Generally, these forward-looking
statements can be identified by the use of forward-looking terminology such as
"plans", "anticipated", "expects" or "does not expect", "is expected", "budget",
"scheduled", "estimates", "forecasts", "intends", "anticipates" or "does not
anticipate", or "believes", or variations of such words and phrases or state
that certain actions, events or results "may", "could", "would", "might" or
"will be taken", "occur" or "be achieved". InterRent is subject to significant
risks and uncertainties which may cause the actual results, performance or
achievements to be materially different from any future results, performance or
achievements expressed or implied by the forward looking statements contained in
this release. A full description of these risk factors can be found in
InterRent's publicly filed information which may be located at www.sedar.com.
InterRent cannot assure investors that actual results will be consistent with
these forward looking statements and InterRent assumes no obligation to update
or revise the forward looking statements contained in this release to reflect
actual events or new circumstances.
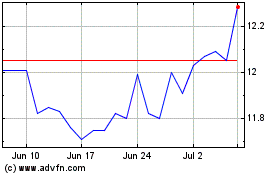
InterRent Real Estate In... (TSX:IIP.UN)
Historical Stock Chart
From Jun 2024 to Jul 2024

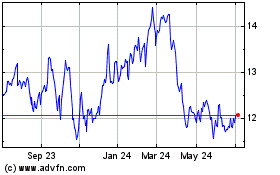
InterRent Real Estate In... (TSX:IIP.UN)
Historical Stock Chart
From Jul 2023 to Jul 2024
