Form 497AD - Filing by certain investment companies of Rule 482 advertising [Rule 497 and 482(c)]
April 11 2024 - 4:06PM
Edgar (US Regulatory)

CARLYLE CREDIT INCOME FUND (CCIF) March 2024 DIVERSIFICATION BY CREDIT TYPE OF UNDERLYING OBLIGORS Obligor % Total First Lien Loan 96.30% Unsecured Loan 0.00% Second Lien Loan 0.73% Senior Secured Bond 2.04% Senior Unsecured Bond 0.93% Total1 100.00% 1Past performance is not indicative of future results or a guarantee of future returns. Please review the Important Information. 1. Percentages may not add to 100 due to rounding. Ticker Symbol CCIF Total Net Asset Value (est.) $97.09 Million Net Asset Value per share (est.) $7.88 Closing Price per share $7.87 Premium / Discount (0.13%) Total Market Capitalization $97.03 Million Current Dividend Yield 12.88% Current Dividend Yield Based on Dividends Declared Through May 2024 16.01% Frequency of Common Stock Dividend Payments Monthly PIE CHART Reference PPT template for styling PORTFOLIO SUMMARY SUMMARY OF UNDERLYING PORTFOLIO Number of Unique Underlying Loan Obligors 1,554 Number of Underlying Loans 2,197 Aggregate Balance of Underlying Loans $20.65 Billion Average Individual Loan Obligor Exposure 0.06% Currency: USD Exposure 97.97% Aggregate Indirect Exposure to Senior Secured Loans 96.30% Weighted Average Junior OC Cushion 4.54 Weighted Average Market Value of Loan Collateral 97.38 TOP 5 EQUITY POSITIONS Voya CLO 2020-2 5.29% Benefit Street Partners CLO XXIII 5.28% Madison Park Funding LXII 5.08% CIFC Funding 2020-III 4.54% RR 2 4.46% DIVERSIFICATION BY CREDIT T E OF UNDERLYING OBILIGORS SUMMARY OF UN E LYING PORTFOLIO COMMON STOCK DATA AS OF 3/31/24 TOP 5 POSITIONS Weighted Average Remaining CLO Reinvestment Period 2.4 years Last 12 Month Default Rate of Underlying Loans 1.31% Ticker Symbol CCIA Closing Price per share $25.43 PREFERRED STOCK DATA AS OF 3/31/24 2.1% 96.6% 1.4% CLO Debt CLO Equity Legacy Real Estate Loans

1.7% 8.2% 12.9% 18.6% 23.9% 16.2% 9.2% 5.2% 2.3% 1.7% 0% 5% 10% 15% 20% 25% 30% 1.6% 1.7% 4.8% 5.7% 5.6% 43.6% 36.9% 0% 5% 10% 15% 20% 25% 30% 35% 40% 45% 50% 0.2% 3.2% 7.7% 16.2% 39.0% 16.0% 17.7% 0% 5% 10% 15% 20% 25% 30% 35% 40% 45% 2024 2025 2026 2027 2028 2029 2030+ 0.1%0.2% 0.6%1.7% 5.3% 7.5% 11.4% 17.9% 35.3% 14.6% 2.6%1.3%1.0% 0.4% 0% 5% 10% 15% 20% 25% 30% 35% 40% Wtd Avg = 4.4 years TOP 10 UNDERLYING OBLIGORS Obligor % Total Asurion 0.56% Altice France 0.53% Caesars Entertainment 0.52% TransDigm 0.51% Virgin Media 0.51% UKG 0.49% Medline 0.47% Peraton 0.46% 1011778 ULC Burger King Corporation 0.44% Citadel Securities LP 0.43% Total 4.92% 2 TOP 10 INDUSTRIES OF UNDERLYING OBLIGORS Industry % Total High Tech 12.80% Healthcare & Pharmaceuticals 12.18% Banking, Finance, Insurance & Real Estate 8.69% Services: Business 7.54% Hotels, Gaming & Leisure 5.36% Chemicals, Plastics & Rubber 4.74% Construction & Building 4.74% Capital Equipment 4.46% Telecommunications 4.20% Media: Broadcasting & Subscription 3.92% Total 68.63% WEIGHTED AVERAGE RATING DISTRIBUTION1 WEIGHTED AVERAGE MATURITY DISTRIBUTION1 TOP 10 UND ING OBLIGORS TOP 10 INDUSTRIES F NDERLYING OBLIGORS WEIGHTED AVERAGE STATED SPREAD DISTRIBUTION1WEIGHTED AVERAGE PRICE DISTRIBUTION1 UNDERLYING LOAN METRICS CARLYLE CREDIT INCOME FUND (CCIF) March 2024 Wtd Avg = 97.5 – 100 Wtd Avg = 3.5 – 4.0% Wtd Avg = B+ Past performance is not indicative of future results or a guarantee of future returns. Please review the Important Information. 1. Percentages may not add to 100 due to rounding.

IMPORTANT INFORMATION © 2023 Carlyle Credit Income Fund. All Rights Reserved Investors should consult with their financial advisor about the suitability of CCIF in their portfolio. Investing in CCIF involves a high degree of risk, including the risk that you may receive little or no return on your investment or that you may lose part or all of your investment. This is a non-diversified closed-end fund. Shares of CCIF’s common stock are listed on the New York Stock Exchange. Shares of closed-end funds frequently trade at a discount from their net asset value (NAV), which may increase investors’ risk of loss. CCIF cannot predict whether its shares will trade at, below or above NAV. There is no assurance that CCIF’s investment objectives will be achieved or that monthly distributions paid by CCIF will be maintained at the targeted level or that dividends will be paid at all. CCIF’s distributions may be funded from unlimited amounts of offering proceeds or borrowings, which may constitute a return of capital and reduce the amount of capital available to CCIF for investment. A return of capital to shareholders is a return of a portion of their original investment in CCIF, thereby reducing the tax basis of their investment. This material is provided for general and educational purposes only, is not intended to provide legal or tax advice, does not constitute a solicitation of an offer to buy or sell CCIF’s shares, and is not for use to avoid any penalties that may be imposed under U.S. federal tax laws. Contact your attorney or other advisor regarding your specific legal, investment or tax situation. Investing involves risk. CCIF invests primarily in below investment grade instruments, which are commonly referred to as “high yield” securities or “junk” bonds. CCIF invests a significant portion of its assets in CLO junior debt and equity securities, which often involve risks that are different from or more pronounced than risks associated with other types of credit instruments. Because of the risks associated with investing in high yield securities, an investment in CCIF should be considered speculative. Investors should carefully consider the investment objective, risks, charges and expenses of CCIF before investing. CCIF’s filings with the Securities and Exchange Commission (“SEC”) contain information about CCIF’s investment objectives, risks, charges and expenses as well as other information about CCIF. These filings should be read carefully before investing. CCIF’s filings with the SEC may be found on the SEC’s website (www.sec.gov) or on CCIF’s website, www.carlylecreditincomefund.com. ABOUT CARLYLE The Carlyle Group (NASDAQ: CG) is a global investment firm with deep industry experience that deploys private capital across three business segments: Global Private Equity, Global Credit and Global Investment Solutions. With approximately $426 billion of assets under management as of December 31, 2023, Carlyle’s purpose is to invest wisely and create value on behalf of its investors, portfolio companies and the communities in which we live and invest. The Carlyle Group employs more than 2,200 people in 28 offices across 4 continents as of December 31, 2023. 3 CARLYLE CREDIT INCOME FUND (CCIF) March 2024 Past performance is not indicative of future results or a guarantee of future returns. Please review the Important Information.
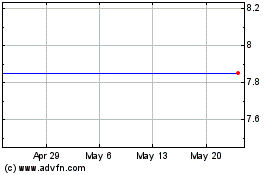
Carlyle Credit Income (NYSE:VCIF)
Historical Stock Chart
From Jun 2024 to Jul 2024

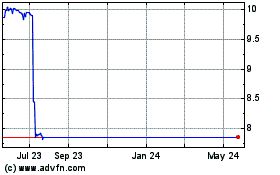
Carlyle Credit Income (NYSE:VCIF)
Historical Stock Chart
From Jul 2023 to Jul 2024
