0001406666FALSE00014066662022-07-152022-07-15
UNITED STATES
SECURITIES AND EXCHANGE COMMISSION
WASHINGTON, D.C. 20549
FORM 8-K
CURRENT REPORT
Pursuant to Section 13 or 15(d) of the
Securities Exchange Act of 1934
Date of Report (Date of earliest event reported): October 23, 2023
CALIX, INC.
(Exact name of Registrant as specified in its charter)
| | | | | | | | | | | | | | |
| | | | |
| Delaware | | 001-34674 | | 68-0438710 |
(State or other jurisdiction
of incorporation) | | (Commission
File No.) | | (I.R.S. Employer
Identification No.) |
| | |
2777 Orchard Parkway, San Jose, California | | 95134 |
| (Address of principal executive offices) | | (Zip Code) |
| | |
(408) 514-3000 |
| (Registrant’s telephone number, including area code) |
| | |
| Not Applicable |
| (Former name or former address if changed since last report) |
Check the appropriate box below if the Form 8-K filing is intended to simultaneously satisfy the filing obligation of the registrant under any of the following provisions:
| | | | | |
| ☐ | Written communications pursuant to Rule 425 under the Securities Act (17 CFR 230.425) |
| | | | | |
| ☐ | Soliciting material pursuant to Rule 14a-12 under the Exchange Act (17 CFR 240.14a-12) |
| | | | | |
| ☐ | Pre-commencement communications pursuant to Rule 14d-2(b) under the Exchange Act (17 CFR 240.14d-2(b)) |
| | | | | |
| ☐ | Pre-commencement communications pursuant to Rule 13e-4(c) under the Exchange Act (17 CFR 240.13e-4(c)) |
Securities registered pursuant to Section 12(b) of the Act:
| | | | | | | | | | | | | | |
Title of Each Class | | Trading Symbol | | Name of Each Exchange on Which Registered |
Common Stock, par value $0.025 per share | | CALX | | New York Stock Exchange |
Indicate by check mark whether the registrant is an emerging growth company as defined in Rule 405 of the Securities Act of 1933 (§ 230.405 of this chapter) or Rule 12b-2 of the Securities Exchange Act of 1934 (§ 240.12b-2 of this chapter).
If an emerging growth company, indicate by check mark if the registrant has elected not to use the extended transition period for complying with any new or revised financial accounting standards provided pursuant to Section 13(a) of the Exchange Act). o
Item 2.02 Results of Operations and Financial Condition.
On October 23, 2023, Calix, Inc. (the “Company”) issued a press release announcing it has publicly disseminated a stockholder letter with its financial results for the third quarter ended September 30, 2023. The press release is attached hereto as Exhibit 99.1. The stockholder letter, a copy of which is attached hereto as Exhibit 99.2 and incorporated herein by reference, includes reference to the non-GAAP measures of non-GAAP gross margin, non-GAAP operating expenses, non-GAAP net income, non-GAAP net income per diluted common share and non-GAAP free cash flow. These non-GAAP measures are provided to enhance the reader’s understanding of the Company’s operating performance as they primarily exclude non-cash charges for stock-based compensation, intangible asset amortization and impact from changes in income taxes, which the Company believes are not indicative of its core operating results. Management believes that the non-GAAP measures used in this stockholder letter provide investors with important perspectives into the Company’s ongoing business performance and management uses these non-GAAP measures to evaluate financial results and to establish operational goals. The presentation of these non-GAAP measures is not meant to be a substitute for results presented in accordance with U.S. GAAP, but rather should be evaluated in conjunction with those GAAP results. A reconciliation of the non-GAAP results to the most directly comparable U.S. GAAP results is contained in tabular form in Exhibit 99.2. The non-GAAP financial measures used by the Company may be calculated differently from, and therefore may not be comparable to, similarly titled measures used by other companies. The ConneXions presentations referenced in the stockholder letter and available for replay on Calix.com are not incorporated by reference herein or into the press release.
Such information shall not be deemed “filed” for purposes of Section 18 of the Securities Exchange Act of 1934, as amended (the “Exchange Act”), and is not incorporated by reference into any filing of the Company, whether made before or after the date hereof, regardless of any general incorporation language in such filing.
Item 9.01 Financial Statements and Exhibits.
(d) Exhibits
| | | | | | | | |
| Exhibit No. | | Description |
| 99.1 | | |
| 99.2 | | |
SIGNATURES
Pursuant to the requirements of the Securities Exchange Act of 1934, the Registrant has duly caused this report to be signed on its behalf by the undersigned hereunto duly authorized.
| | | | | | | | | | | | | | | | | | | | | | | | | | |
| Date: | October 23, 2023 | | | | | CALIX, INC. |
| | | | |
| | | | | | By: | | /s/ Cory Sindelar |
| | | | | | | | Cory Sindelar |
| | | | | | | | Chief Financial Officer |
EXHIBIT INDEX
| | | | | | | | |
| Exhibit No. | | Description |
| 99.1 | | |
| 99.2 | | |
Exhibit 99.1
Calix Releases Third Quarter 2023 Financial Results
SAN JOSE, CA – October 23, 2023 – Calix, Inc. (NYSE: CALX) today announced unaudited financial results for its third quarter 2023, which have been posted as a letter to stockholders to the investor relations section of its website. Please visit the Calix investor relations website at https://investor-relations.calix.com to view the letter to stockholders, along with accompanying supplemental financial information.
A conference call to discuss these results with President & CEO Michael Weening and CFO Cory Sindelar will be held tomorrow, October 24, 2023, at 5:30 a.m. Pacific Time / 8:30 a.m. Eastern Time.
Interested parties may listen to a live webcast of the conference call by visiting the Events section of the Calix Investor Relations website. The live conference call will be available by dialing (877) 407-4019, or international (201) 689-8337, with conference ID# 13741144. Participants may also click this link for instant telephone access to the event. The link will become active approximately 15 minutes prior to the start of the conference call. The conference call and webcast will include forward-looking information.
A webcast replay of the conference call will be available following its completion and will be archived on the Calix Investor Relations website.
About Calix
Calix, Inc. (NYSE: CALX) – Broadband service providers of all sizes leverage the Calix platform and teams to simplify their business and excite their subscribers to grow the value of their business and for their communities for generations. The democratizing power of the platform and portfolio of managed services enables them to operate efficiently, acquire subscribers, and deliver exceptional experiences. Calix is dedicated to driving continuous improvement in partnership with our growing ecosystem to support the transformation of our customers and their communities.
Category: Financial
Investor Inquiries:
Jim Fanucchi
VP, Investor Relations
InvestorRelations@calix.com
(408) 404-5400
Exhibit 99.2
October 23, 2023
Fellow Calix stockholders:
In the third quarter of 2023, the Calix team executed our tenth consecutive quarter of sequential revenue growth and our fifth consecutive quarter of sequential gross margin expansion, once again demonstrating predictability in our performance due to the unique strength of our platform and managed services model. We delivered record revenue of $263.8 million, record GAAP gross margin of 53.3% and non-GAAP gross margin of 53.8%.
Adoption of our platform continued with 12 new BSPs choosing to partner with Calix. This included BOYCOM Cablevision, Inc., a visionary rural cable operator in southeast Missouri. BOYCOM chose the Calix platform and managed services to transform their business to simplify, thereby increasing efficiency to slash operating expense, excite subscribers through our managed services and grow their brand value in the communities they serve.
The strength of the team’s ongoing disciplined execution was once again illustrated by our stellar balance sheet with no debt, including record-low days sales outstanding (DSO) of 28 and inventory turns of 3.0.
Our balance sheet continues to be a strong foundation for our team as we pursue our mission of enabling BSPs of all sizes to simplify, excite and grow.
For the third quarter of 2023, we also delivered our second consecutive quarter of double-digit free cash flow and repurchased $32.4 million of our common stock, bringing our utilization of the $100 million authorized share repurchase plan to $42.4 million. We will continue our share repurchase program as we expect free cash flow to remain strong and increase into the future.
Calix has a long history of supporting our customers when it comes to government funding programs and their related requirements; and the Broadband Equity, Access and Deployment (BEAD) program is no different. Last month, we publicly affirmed our commitment to “Build America, Buy America” (BABA) for the BEAD program. The decision to manufacture certain products in the United States ensures that Calix customers can leverage the BEAD program while helping create new U.S.-based manufacturing jobs. We are honing our operations in anticipation of the billions of dollars in stimulus that will target the underserved and unserved markets typically addressed by our customers. We expect to begin BEAD/BABA shipments in late 2024 or early 2025.
Last week, we hosted a record number of attendees at the ConneXions 2023 Innovation and Customer Success Conference in Las Vegas. The CEOs of industry leading BSPs, such as ALLO, Bulloch Solutions, CTC, Hunter Communications, Lumos, Schurz Communications, Tombigbee Fiber, Tri-CoGo and United Fiber, participated on the main stage sharing their Grow Your Community playbook as a BSP working to simplify their operations, excite their subscribers and grow their value for investors, cooperative members and the communities they serve. Their presentations, with their incredible results, are available for replay on Calix.com.
Last, but certainly not least, the unique Calix platform and our managed services are enriched by a growing ecosystem of partners who share the same goals as Calix – innovating and making customers successful. An example of the growth in the ecosystem is the recent expansion of our partnerships with the National Information Solutions Cooperative (NISC), which is the largest provider of systems and
services, such as billing systems, to rural electric cooperatives and broadband providers. Together, NISC and Calix have agreed to expand our joint innovation roadmap of cloud and software capabilities by enabling data and workflows to seamlessly flow between Calix Cloud and NISC’s clouds, thereby streamlining broadband marketing, operations and support while enhancing the subscriber’s experience.
The industry continues to acknowledge the Calix purpose-driven culture and the strength of our innovative platform and managed services through awards including:
•Calix named #5 for “Best Company Compensation, #8 for “Best Company Perks and Benefits”, and #15 for “Best Company Happiness” by Comparably.
•Calix was awarded the 2023 Tech Culture Award by TMC, recognizing the best tech cultures.
•Calix Marketing Cloud named the Business Intelligence Group 2023 Sales and Marketing “Sammy’s” Technology Award for demonstrating superior performance in marketing insights and analysis.
•Calix was awarded ACA Connects Partnership Award demonstrating Calix’s support to smaller, independent cable businesses.
•Calix named for innovation in the Top 10 Businesses list from The CEO Forum Group.
As the only end-to-end platform company enabling BSPs to maximize the once-in-a-generation opportunity presented by the disruption of the broadband industry, our leadership team is confident that our financial performance will continue to improve across four measurable objectives:
•Deliberate revenue growth
•Gross margin expansion
•Disciplined operating expense investment
•Ongoing predictability
The Calix team has executed with excellence and remains committed to enabling our customers to transform their businesses and lead in their markets. As legacy providers continue to scale back their spending plans and see their balance sheets come under further stress in a high interest rate environment, our customers are deploying their high-growth, high-margin, high-cash-flow business to secure capital and grow. We will continue to align our investments to support our mission, vision and strategy while maintaining our operating expense discipline and are confident our model will deliver consistent improvement in our financial performance over many years.
Third Quarter 2023 Financial Results
| | | | | | | | | | | |
| Actual GAAP | Actual Non-GAAP | Guidance Non-GAAP 1 |
| Revenue | $263.8m | $263.8m | $260.0m – $265.0m |
| Gross margin | 53.3% | 53.8% 2 | 52.5% – 54.5% 1 |
| Operating expenses | $124.6m | $109.3m 2 | $108.5m – $111.5m 1 |
| Net income per diluted common share | $0.24 | $0.45 2 | $0.32 – $0.38 1 |
| | | | | | | |
1 | Non-GAAP guidance provided on July 19, 2023. | | |
2 | Non-GAAP excludes stock-based compensation and intangible asset amortization as well as the income tax impact of these items. See GAAP to non-GAAP reconciliations beginning on page 15. | | |
| | | |
| | | |
| | | |
| | | |
| | | |
| | | |
| | | |
| | | |
Continued demand for our platform and managed service offerings led to our tenth quarter of sequential revenue growth. For the third quarter of 2023, revenue was a record $263.8 million, representing an increase of 1% from the prior quarter and 12% compared with the same quarter a year ago.
Revenue EDGE revenue decreased by 8% from the prior quarter due to continued management of customer buffers and was up 12% compared with the year ago quarter as both new and existing customers continued to add subscribers.
We achieved another record quarter for the Intelligent Access EDGE with revenue up 8% from the prior quarter and increased 60% compared with the year ago quarter, due to some seasonality as customers worked to complete their summer network builds and driven by the technology upgrade cycle to consolidated networks and 10 Gigabit PON.
U.S. revenue was 89% of revenue for the third quarter of 2023, the same as the second quarter of 2023, and down 2% from 91% of revenue for the year ago quarter. U.S. revenue increased 1% in absolute dollars sequentially, and 9% compared with the year ago quarter. International revenue was 11% of revenue in the third quarter of 2023, up by 0.4% in absolute dollars. Higher shipments to Europe were mostly offset by lower shipments to Americas customers outside of the United States and Middle East/Africa customers. International revenue was up 40% compared with the year ago period, primarily due to higher shipments to European customers and partially offset by lower shipments to Americas customers outside of the United States.
We continue to focus on finding strategically aligned customers of all types and sizes that recognize the need for business transformation enabled by our platform and managed service offerings. During the third quarter of 2023, we added 12 new BSP customers, bringing our year-to-date additions to 39.
As we have discussed previously, technology disruptions start with small customers and eventually work their way up to large customers. Revenue from small customers was 74% of revenue for the third quarter of 2023, down from 76% for the prior quarter, and decreased 0.3% in absolute dollars due in part to the lower Revenue Edge revenue within this customer group. Revenue from medium-sized customers was 16% of revenue in the third quarter of 2023, up from 14% in the prior quarter, and increased 11% in absolute dollars due primarily to increased sales to a medium-sized customer we added in 2022. Revenue from large customers was 10% of revenue for the third quarter of 2023, the same as the prior quarter and down 3% in absolute dollars from the second quarter of 2023. Shipments were slightly lower across our large customer base from the prior quarter except for the continued strength from the same large customer we noted in the last two quarterly stockholder letters.

Greater customer adoption of our platform and managed services was again evidenced by the
continued increase in all three metrics compared with the prior quarter. As we have noted previously, our platform and managed services monetize based on subscriber count, and the growth in subscribers and on-going adoption of our platform and managed services form the “expand” in our “land and expand” strategy. Over time, the recurring revenue from continued platform and managed services adoption will drive higher gross margin.
Our platform consists of Revenue EDGE, Intelligent Access EDGE and Calix Cloud. We added 13 new Revenue EDGE and/or Intelligent Access EDGE customer deployments in the third quarter of 2023. By deploying the Revenue EDGE, BSPs can quickly implement and sell managed services, thereby
increasing their average revenue per user at the highest possible margin with the greatest levels of subscriber satisfaction.
We added 5 new Calix Cloud deployments, which include Engagement Cloud (formerly Marketing Cloud), Service Cloud (formerly Support Cloud) and/or Operations Cloud in the third quarter of 2023. Calix Cloud allows our BSPs to benefit from the power of data-driven insights to drive best-in-class net promoter scores.
Our managed services showed continued growth as 18 additional customers began deploying a managed service. We currently offer 9 managed services consisting of Wi-FiIQ, CommandIQ, ProtectIQ, ExperienceIQ, Arlo Secure, Bark, Servify, SmartBiz and SmartTown.
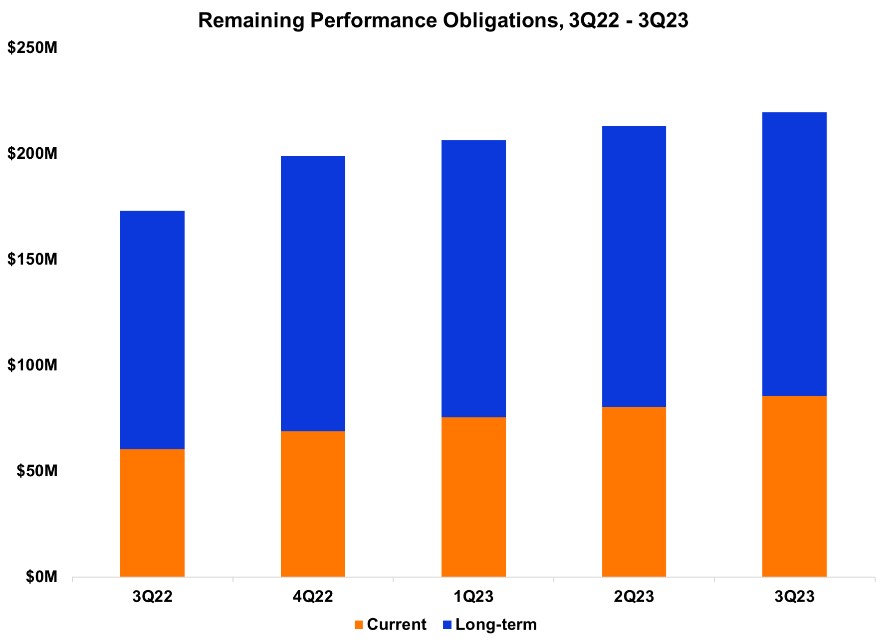
Remaining performance obligations, or RPOs, result from long-term commitments made by our customers and consist mainly of Calix Cloud, managed services, extended warranties and support/ maintenance agreements, while excluding licensed software, usage-based models and true-ups. These commitments generally have an initial term of three years. As of the end of the third quarter of 2023, our RPOs were $219.5 million, which is an increase of $6.5 million, or 3%, from the prior quarter and an increase of $46.4 million, or 27%, from the quarter a year ago. Current RPO at the end of the third quarter of 2023 was $85.4 million, up 6% from $80.4 million at the prior quarter end and up 42% from $60.3 million at the quarter end a year ago. The increases reflect the continued adoption of our platform offerings by an increasing number of our BSP customers. Our expectation is that we will see RPO growth every quarter for the foreseeable future, albeit these quarterly increases will vary.

For the fifth consecutive quarter, gross margin moved higher as our platform solutions grew and the supply chain continued to improve. GAAP gross margin increased 100 basis points sequentially, and 320 basis points year-over-year, to 53.3%. Included in GAAP gross margin is stock-based compensation and intangible asset amortization. Excluding these items, our non-GAAP gross margin was 53.8% for the third quarter of 2023, representing an increase of 100 basis points sequentially and 310 basis points from the year ago period. The continued improvement is primarily due to higher platform and managed services revenue as we continue to grow our platform model. Also, during the third quarter of 2023, we benefited from a shift in product mix and the sell through of a lower amount of excessively priced components acquired in the secondary market in prior periods. Our expectation is the long-term trend for gross margin on an annual basis will continue to increase with varied rates on a quarterly basis.
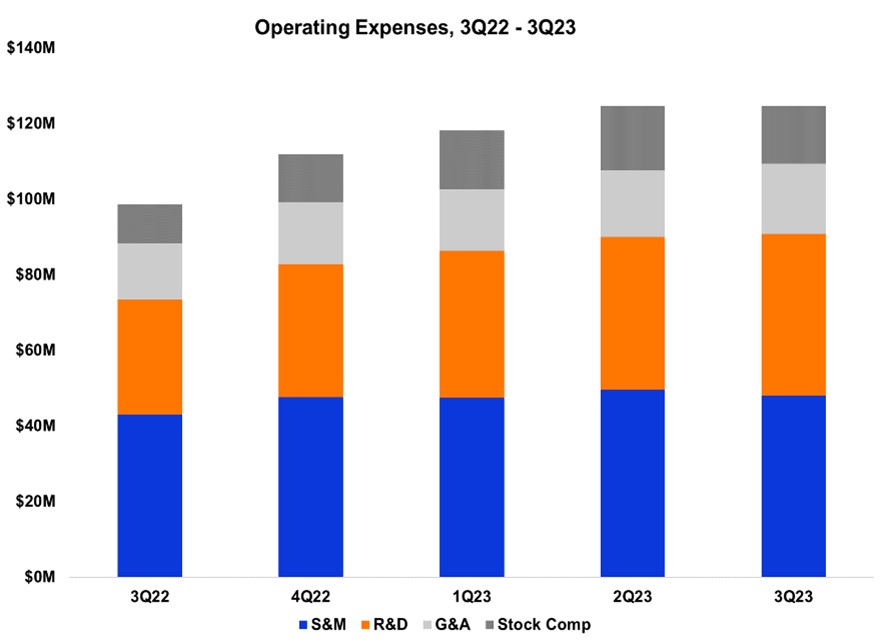
We continue to invest within our target financial model to capitalize on the once-in-a-generation opportunity ahead. Our GAAP and non-GAAP operating expenses for the third quarter of 2023 were $124.6 million and $109.3 million, representing 47.2% and 41.4% of revenue, respectively. Sequentially, GAAP operating expenses decreased by $0.1 million and non-GAAP operating expenses increased by $1.7 million. The GAAP decrease was due to lower stock-based compensation while the non-GAAP increase resulted primarily from increased personnel costs. Compared with the year ago quarter, GAAP and non-GAAP operating expenses increased by 26% and 24%, respectively, primarily due to ongoing investments in headcount across our organization. These investments are needed to support the current and future demand for our platform offerings as we focus on our BSP customers’ success. Non-GAAP sales and marketing investments were 18.2% of revenue, which is at the lower end of our target financial model range of 18% to 20%. Non-GAAP research and development investments were 30.1% of gross
profit, which is above our target financial model of 29%. Non-GAAP general and administrative investments were 7.0% of revenue and inline our target financial model of 7%.
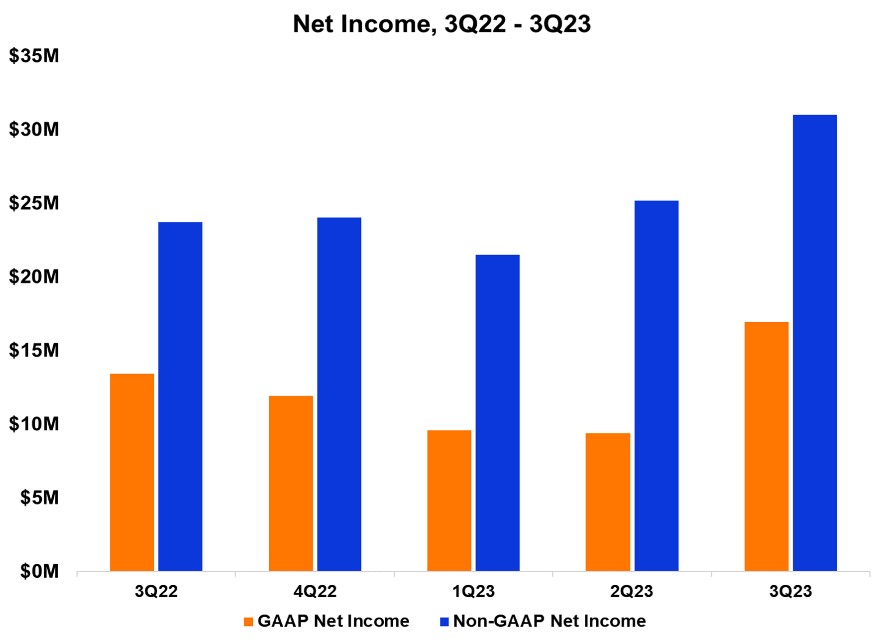
GAAP net income of $17.0 million for the third quarter of 2023 increased by approximately $7.6 million sequentially, primarily due to higher revenue and gross margin and a lower income tax rate. GAAP net income was up $3.5 million compared with the same quarter a year ago. GAAP net income for the third quarter of 2023 included stock-based compensation of $16.0 million and intangible asset amortization of $0.7 million, partially offset by the income tax effect for these items of $2.6 million. Our non-GAAP net income for the third quarter of 2023 was $31.0 million, an increase of $5.8 million when compared with $25.2 million in the prior quarter, and an increase of $7.2 million when compared with $23.8 million in the same quarter a year ago. The increases are mainly due to a lower income tax rate and to a lesser extent the higher revenue and gross margin performance. Our income tax rate for the third quarter of 2023 included favorable adjustments to our 2022 estimated income taxes as a result of finalizing our 2022 income tax returns as well as improvements in the current year assumptions.
Balance Sheet and Cash Flow
Our pristine balance sheet continued to strengthen. Our DSO at the end of the third quarter 2023 was a record low at 28 days, down 6 days from the prior quarter and down 11 days from the same quarter a year ago. Our target financial model for DSO remains between 35 and 45 days. Inventory turns were 3.0, the same as the prior quarter, and down from 3.1 at the end of the third quarter a year ago. Inventory turns for the third quarter of 2023 were at the low end of our target financial model of 3 to 4 turns. In the third quarter of 2023, we also increased our support to our contract manufacturers with additional inventory deposits of $14.5 million related to component materials, bringing our total inventory deposits to
$65.9 million. With the supplier lead times normalizing, we expect over the next six quarters our inventory turns will adjust to the middle of the target financial model range and the suppliers’ excess components will diminish. Days payable outstanding (DPO) at the end of the third quarter was 16 days, down 9 days from the prior quarter and 23 days from the year ago quarter, due to timing of inventory purchases. Our target financial model for DPO is to be between 25 and 35 days. Our cash conversion cycle was 133 days compared with 131 days in the prior quarter and 117 days in the same quarter last year. Our target financial model remains for our cash conversion cycle to be between 100 and 130 days.

We ended the third quarter of 2023 with cash and investments of $250.1 million, a sequential decrease of $14.0 million as a result of purchasing $32.4 million of our common stock at an average price of $44.44. This investment was partially offset by positive non-GAAP free cash flow of $12.0 million and proceeds from equity-based employee benefit plans of $8.4 million. Over the past year, our cash and investments increased by $15.4 million due primarily to proceeds from equity-based employee benefit plans of $32.7 million and positive non-GAAP free cash flow of $28.7 million. These increases were partially offset by investments in our common stock of $42.4 million at an average price of $44.47. Over the next year, we expect both operating and non-GAAP free cash flow to remain strong due to continued gross margin expansion, profitable growth, improved inventory turns and a reduction of supplier inventory deposits as our supply chain continues to return to normal lead times.
Fourth Quarter 2023 Guidance
| | | | | | | | |
| Guidance Non-GAAP | Guidance Reconciled to GAAP |
| Revenue | $261.0m – $267.0m | $261.0m – $267.0m |
| Gross margin | 53.0% – 55.0% 1 | 52.5% – 54.5% |
| Operating expenses | $111.0m – $114.0m 1 | $129.0m – $132.0m |
Net income per diluted common share 2 | $0.33 – $0.39 1 | $0.11 – $0.17 |
| | | | | | | |
1 | Non-GAAP excludes stock-based compensation and intangible asset amortization as well as the income tax impact of these items. See GAAP to non-GAAP reconciliation on page 16. | | |
2 | Based on 69.3 million weighted-average diluted common shares outstanding. | | |
| | | |
| | | |
| | | |
| | | |
| | | |
| | | |
| | | |
| | | |
Our guidance for the fourth quarter of 2023, ending December 31, 2023, reflects our expectations as of the date of this letter.
Our revenue guidance for the fourth quarter of 2023, at the midpoint, is for revenue to increase slightly compared with the prior quarter as we experience continued demand for our platform and managed services. When using the midpoint of the fourth quarter 2023 guidance, it would result in 2023 revenue increasing 20% from 2022, representing our fourth consecutive year of 20% or higher revenue growth.
Our non-GAAP gross margin guidance for the fourth quarter of 2023, at the midpoint, represents an increase of 20 basis points compared with the prior quarter. When using the midpoint of the gross margin outlook for the fourth quarter of 2023, annual gross margin for fiscal 2023 would be approximately 53.1%, an increase of 240 basis points from fiscal 2022.
Our non-GAAP operating expense guidance for the fourth quarter of 2023 includes the additional expenses associated with our annual ConneXions event held last week. It also reflects our continued commitment to invest fully to our target model to address the opportunity in front of us.
We expect our non-GAAP effective income tax rate in the fourth quarter will decline slightly to a range of 22.5% to 23.5%.
Summary
We are excited about the growth opportunity ahead for Calix and our strategically aligned customers. Calix is partnering with BSPs to transform and disrupt the broadband industry through the power of our unique end-to-end platform and growing ecosystem of managed services business model to deliver offerings across residential, business, education and the communities they serve. Through this relationship, our customers will grow market share against the legacy incumbents who continue to follow a ‘speed-first’ model.
The foundation for our growth continues to be based on three vectors:
•New subscribers: BSP customers leverage our clouds, software and managed services to differentiate themselves in their markets thereby adding subscribers.
•Existing subscribers: BSP customers adopt new clouds, software and managed services to reduce their operational costs and grow revenue per subscriber.
•New BSPs: We continue to sign new strategically aligned service providers who recognize that our platform enables their team to transform their business as they simplify their operational costs and time to market and excite their subscribers with market differentiating managed services to grow for their members/investors and the communities they serve.
Our financial strength is unmatched in the industry, with expanding revenue and margins, growing cash generation and a pristine balance sheet. We will continue to invest in our business, developing and deploying the platforms and managed services that are enabling our customers to add subscribers at a faster pace and achieve their business goals. The opportunity ahead of us is immense, and we are confident that we will maintain quarter-on-quarter revenue growth and margin expansion in a predictable manner.
We sincerely thank our employees, customers, partners, vendors and stockholders for their continued support.
Sincerely,
| | | | | | | | |
Michael Weening President and CEO | | Cory Sindelar CFO |
Conference Call
In conjunction with this announcement, Calix will host a conference call tomorrow, October 24, 2023, at 5:30 a.m. Pacific Time / 8:30 a.m. Eastern Time to answer questions regarding our third quarter 2023 financial results. A live audio webcast and replay of the call will be available in the Investor Relations section of the Calix website at http://investor-relations.calix.com.
Live call access information: Dial-in number: (877) 407-4019 (U.S.) or (201) 689-8337 (outside the U.S.) ID# 13741144.
The conference call and webcast will include forward-looking information.
Investor Inquiries
Jim Fanucchi
VP, Investor Relations
InvestorRelations@calix.com
(408) 404-5400
About Calix
Calix, Inc. (NYSE: CALX) — Broadband service providers of all sizes leverage the Calix platform and teams to simplify their business and excite their subscribers to grow the value of their business and for their communities for generations. The democratizing power of the platform and portfolio of managed services enables them to operate efficiently, acquire subscribers, and deliver exceptional experiences. Calix is dedicated to driving continuous improvement in partnership with our growing ecosystem to support the transformation of our customers and their communities.
Forward-Looking Statements
Statements made in this stockholder letter and the earnings call referencing the stockholder letter that are not statements of historical fact are forward-looking statements. Forward-looking statements are subject to the “safe harbor” provisions of the Private Securities Litigation Reform Act of 1995. Forward-looking statements relate to, but are not limited to, component and logistics costs, potential customer or market opportunities, growth and future opportunities, customer demand or the sustainability of continued demand, anticipated customer purchase trends, expected customer and product mix or anticipated adoption or deployment of our platform, systems or services offerings, industry, market and customer trends, opportunities with existing and prospective customers, free cash flow and liquidity, and future financial performance (including the outlook for the fourth quarter of 2023 and future periods and performance against our target financial model). Forward-looking statements are subject to risks and uncertainties that could cause actual results to differ materially from expectations, including but not limited to fluctuations in our financial and operating results, the capital spending decisions of our customers, changes and disruptions in the market and industry, availability of capital in the market, changes in and impacts of regulations and/or government sponsored programs, competition, our ability to achieve market acceptance of our platform, systems and solutions, our ability to grow our customer base, fluctuations in costs associated with our systems and services including higher costs, dependence on third-parties for production and resource management associated with our global supply chain that may cause delays in production, protracted product shortages and unavailability of systems to meet customer orders, cost overruns, disruptions in global trade and relations, social unrest and political uncertainties and other unanticipated factors, as well as the risks and uncertainties described in our annual reports on Form 10-K and our quarterly reports on Form 10-Q, each as filed with the SEC and available at www.sec.gov, particularly in the sections titled “Risk Factors.” Forward-looking statements speak only as of the date the statements are made and are based on information available to us at the time those statements are made and/or management’s good faith belief as of that time with respect to future events. Calix assumes no obligation to update forward-looking statements to reflect actual performance or
results, changes in assumptions or changes in other factors affecting forward-looking information, except to the extent required by applicable securities laws. Accordingly, investors should not place undue reliance on any forward-looking statements.
Use of Non-GAAP Financial Information
The Company uses certain non-GAAP financial measures in this stockholder letter to supplement its consolidated financial statements, which are presented in accordance with U.S. GAAP. These non-GAAP measures include non-GAAP gross margin, non-GAAP operating expenses, non-GAAP net income, non-GAAP net income per diluted common share and non-GAAP free cash flow. These non-GAAP measures are provided to enhance the reader’s understanding of the Company’s operating performance as they primarily exclude non-cash charges for stock-based compensation, intangible asset amortization and impact from changes in income taxes, which the Company believes are not indicative of its core operating results. Management believes that the non-GAAP measures used in this stockholder letter provide investors with important perspectives into the Company’s ongoing business performance and management uses these non-GAAP measures to evaluate financial results and to establish operational goals. The presentation of these non-GAAP measures is not meant to be a substitute for results presented in accordance with GAAP, but rather should be evaluated in conjunction with those GAAP results. A reconciliation of the non-GAAP results to the most directly comparable GAAP results is provided in this stockholder letter. The non-GAAP financial measures used by the Company may be calculated differently from, and therefore may not be comparable to, similarly titled measures used by other companies.
Net Promoter®, NPS®, NPS Prism® and the NPS-related emoticons are registered trademarks of Bain & Company, Inc., Satmetrix Systems, Inc. and Fred Reichheld. Net Promoter Score℠ and Net Promoter System℠ are service marks of Bain & Company, Inc., Satmetrix Systems, Inc. and Fred Reichheld.
| | | | | | | | | | | | | | | | | | | | | | | | | | | | | | | | |
| Calix, Inc. |
| Condensed Consolidated Statements of Income |
| (Unaudited, in thousands, except per share data) |
| | | | | | | | | | |
| | | | Three Months Ended | | Nine Months Ended |
| | | | September 30, | | October 1, | | September 30, | | October 1, |
| | | | 2023 | | 2022 | | 2023 | | 2022 |
| | | | | | |
| Revenue | | $ | 263,835 | | | $ | 236,334 | | | $ | 774,859 | | | $ | 623,324 | |
| Cost of revenue | | 123,286 | | | 117,762 | | | 369,789 | | | 312,780 | |
| Gross profit | | 140,549 | | | 118,572 | | | 405,070 | | | 310,544 | |
| Operating expenses: | | | | | | | | |
| Sales and marketing | | 52,356 | | | 46,134 | | | 158,817 | | | 123,363 | |
| Research and development | | 46,963 | | | 33,196 | | | 135,477 | | | 93,443 | |
| General and administrative | | 25,301 | | | 19,237 | | | 73,100 | | | 54,179 | |
| | Total operating expenses | | 124,620 | | | 98,567 | | | 367,394 | | | 270,985 | |
| Operating income | | 15,929 | | | 20,005 | | | 37,676 | | | 39,559 | |
| Interest income and other expense, net: | | | | | | | | |
| Interest income, net | | 2,658 | | | 595 | | | 6,553 | | | 870 | |
| Other expense, net | | (444) | | | (134) | | | (448) | | | (474) | |
| | Total interest income and other expense, net | | 2,214 | | | 461 | | | 6,105 | | | 396 | |
| Income before income taxes | | 18,143 | | | 20,466 | | | 43,781 | | | 39,955 | |
| Income taxes | | 1,190 | | | 7,023 | | | 7,857 | | | 10,872 | |
| Net income | | $ | 16,953 | | | $ | 13,443 | | | $ | 35,924 | | | $ | 29,083 | |
| Net income per common share: | | | | | | | | |
| | Basic | | $ | 0.26 | | | $ | 0.21 | | | $ | 0.54 | | | $ | 0.45 | |
| | Diluted | | $ | 0.24 | | | $ | 0.19 | | | $ | 0.52 | | | $ | 0.42 | |
| Weighted average number of shares used to compute net income per common share: | | | | | | | |
| | Basic | | 66,288 | | | 65,355 | | | 66,201 | | | 64,892 | |
| | Diluted | | 69,579 | | | 69,174 | | | 69,644 | | | 68,587 | |
| | | | | | | | | | |
| | | | | | | | | | | | | | |
| Calix, Inc. |
| Condensed Consolidated Balance Sheets |
| (Unaudited, in thousands) |
| | | | |
| | September 30, | | December 31, |
| | 2023 | | 2022 |
| ASSETS |
| Current assets: | | | | |
| Cash and cash equivalents | | $ | 135,675 | | | $ | 79,073 | |
| Marketable securities | | 114,417 | | | 162,642 | |
| Accounts receivable, net | | 80,661 | | | 93,804 | |
| Inventory | | 150,033 | | | 149,160 | |
| Prepaid expenses and other current assets | | 106,839 | | | 62,691 | |
| Total current assets | | 587,625 | | | 547,370 | |
| Property and equipment, net | | 29,123 | | | 25,834 | |
| Right-of-use operating leases | | 9,964 | | | 9,283 | |
| Deferred tax assets | | 162,901 | | | 167,031 | |
| Goodwill | | 116,175 | | | 116,175 | |
| Other assets | | 20,872 | | | 19,142 | |
| | $ | 926,660 | | | $ | 884,835 | |
LIABILITIES AND STOCKHOLDERS’ EQUITY |
| Current liabilities: | | | | |
| Accounts payable | | $ | 22,134 | | | $ | 41,407 | |
| Accrued liabilities | | 82,078 | | | 90,474 | |
| Deferred revenue | | 34,944 | | | 33,541 | |
| Total current liabilities | | 139,156 | | | 165,422 | |
| Long-term portion of deferred revenue | | 25,413 | | | 25,072 | |
| Operating leases | | 8,446 | | | 8,442 | |
| Other long-term liabilities | | 2,700 | | | 6,332 | |
| Total liabilities | | 175,715 | | | 205,268 | |
| Stockholders’ equity: | | | | |
| Common stock | | 1,649 | | | 1,644 | |
| Additional paid-in capital | | 1,104,435 | | | 1,070,100 | |
| Accumulated other comprehensive loss | | (1,359) | | | (2,473) | |
| Accumulated deficit | | (353,780) | | | (389,704) | |
| Total stockholders’ equity | | 750,945 | | | 679,567 | |
| | $ | 926,660 | | | $ | 884,835 | |
| | | | | | | | | | | | | | |
| Calix, Inc. |
| Condensed Consolidated Statements of Cash Flows |
| (Unaudited, in thousands) |
| | | | |
| | Nine Months Ended |
| | September 30, | | October 1, |
| | 2023 | | 2022 |
| Operating activities: | | | | |
| Net income | | $ | 35,924 | | | $ | 29,083 | |
| Adjustments to reconcile net income to net cash provided by operating activities: | | | | |
| Stock-based compensation | | 50,090 | | | 31,502 | |
| Depreciation and amortization | | 12,181 | | | 10,837 | |
| Deferred income taxes | | 4,294 | | | 5,225 | |
| Net accretion of available-for-sale securities | | (3,119) | | | (533) | |
| Changes in operating assets and liabilities: | | | | |
| Accounts receivable, net | | 13,143 | | | (15,308) | |
| Inventory | | (873) | | | (52,236) | |
| Prepaid expenses and other assets | | (48,532) | | | (32,854) | |
| Accounts payable | | (19,756) | | | 36,170 | |
| Accrued liabilities | | (141) | | | 9,825 | |
| Deferred revenue | | 1,745 | | | 9,112 | |
| Other long-term liabilities | | (3,629) | | | (9,745) | |
| Net cash provided by operating activities | | 41,327 | | | 21,078 | |
Investing activities: | | | | |
| Purchases of property and equipment | | (13,883) | | | (9,260) | |
| Purchases of marketable securities | | (133,521) | | | (142,280) | |
| Maturities of marketable securities | | 185,888 | | | 134,325 | |
| Net cash provided by (used in) investing activities | | 38,484 | | | (17,215) | |
| Financing activities: | | | | |
| Proceeds from common stock issuances related to employee benefit plans | | 26,659 | | | 21,498 | |
| Repurchases of common stock | | (42,409) | | | — | |
| Payments related to financing arrangements | | (7,560) | | | (995) | |
| Net cash provided by (used in) financing activities | | (23,310) | | | 20,503 | |
| Effect of exchange rate changes on cash and cash equivalents | | 101 | | | (527) | |
| Net increase in cash and cash equivalents | | 56,602 | | | 23,839 | |
| Cash and cash equivalents at beginning of period | | 79,073 | | | 51,333 | |
| Cash and cash equivalents at end of period | | $ | 135,675 | | | $ | 75,172 | |
| | | | | | | | | | | | | | | | | | | | | | | | | | | | | | | | |
| Calix, Inc. |
| Reconciliation of GAAP to Non-GAAP Gross Margin |
| (Unaudited) |
| | Three Months Ended |
| | September 30,
2023 | | July 1,
2023 | | April 1,
2023 | | December 31,
2022 | | October 1,
2022 |
| GAAP gross margin | | 53.3 | % | | 52.3 | % | | 51.2 | % | | 51.1 | % | | 50.1 | % |
| Adjustments to GAAP amount: | | | | | | | | | | |
| Stock-based compensation | | 0.3 | | | 0.3 | | | 0.3 | | | 0.3 | | | 0.3 | |
| Intangible asset amortization | | 0.2 | | | 0.2 | | | 0.3 | | | 0.2 | | | 0.3 | |
| Non-GAAP gross margin | | 53.8 | % | | 52.8 | % | | 51.8 | % | | 51.6 | % | | 50.7 | % |
| | | | | | | | | | | | | | | | | | | | | | | | | | | | | | | | |
| Calix, Inc. |
| Reconciliation of GAAP to Non-GAAP Operating Expenses |
| (Unaudited, in thousands) |
| | | | | | |
| | Three Months Ended |
| | September 30, | | July 1, | | April 1, | | December 31, | | October 1, |
| | 2023 | | 2023 | | 2023 | | 2022 | | 2022 |
| GAAP operating expenses | | $ | 124,620 | | | $ | 124,659 | | | $ | 118,115 | | | $ | 111,833 | | | $ | 98,567 | |
| Stock-based compensation | | (15,292) | | | (17,064) | | | (15,420) | | | (12,590) | | | (10,329) | |
| Non-GAAP operating expenses | | $ | 109,328 | | | $ | 107,595 | | | $ | 102,695 | | | $ | 99,243 | | | $ | 88,238 | |
| | | | | | | | | | | | | | | | | | | | | | | | | | | | | | | | |
| Calix, Inc. |
| Non-GAAP Free Cash Flow Reconciliation |
| (Unaudited, in thousands) |
| | | | | | |
| | Three Months Ended |
| | September 30, | | July 1, | | April 1, | | December 31, | | October 1, |
| | 2023 | | 2023 | | 2023 | | 2022 | | 2022 |
| Net cash provided by operating activities | | $ | 15,751 | | | $ | 17,464 | | | $ | 8,112 | | | $ | 6,105 | | | $ | 6,714 | |
| Purchases of property and equipment | | (3,776) | | | (5,489) | | | (4,618) | | | (4,807) | | | (3,394) | |
| Non-GAAP free cash flow | | $ | 11,975 | | | $ | 11,975 | | | $ | 3,494 | | | $ | 1,298 | | | $ | 3,320 | |
| | | | | | | | | | | | | | | | | | | | | | | | | | | | | | | | | | | |
| Calix, Inc. |
| Reconciliation of GAAP Net Income to Non-GAAP Net Income |
| (Unaudited, in thousands) |
| | Three Months Ended | |
| | September 30, | | July 1, | | April 1, | | December 31, | | October 1, | |
| | 2023 | | 2023 | | 2023 | | 2022 | | 2022 | |
| GAAP net income | | $ | 16,953 | | | $ | 9,373 | | | $ | 9,598 | | | $ | 11,927 | | | $ | 13,443 | | |
| Adjustments to GAAP amount: | | | | | | | | | | | |
| Stock-based compensation | | 16,026 | | | 17,844 | | | 16,220 | | | 13,325 | | | 11,027 | | |
| Intangible asset amortization | | 658 | | | 658 | | | 658 | | | 658 | | | 658 | | |
Income tax effect of non-GAAP adjustments | | (2,641) | | | (2,672) | | | (4,978) | | | (1,857) | | | (1,362) | | |
| Non-GAAP net income | | $ | 30,996 | | | $ | 25,203 | | | $ | 21,498 | | | $ | 24,053 | | | $ | 23,766 | | |
| | | | | | | | | | | |
| | | | | | | | |
| Calix, Inc. |
Reconciliation of GAAP to Non-GAAP Net Income Per Diluted Common Share 1 |
| (Unaudited) |
| | Three Months Ended
September 30, 2023 |
| |
| GAAP net income per diluted common share | | $ | 0.24 | |
| Adjustments to GAAP amount: | | |
| Stock-based compensation | | 0.23 | |
| Intangible asset amortization | | 0.01 | |
| | |
Income tax effect of non-GAAP adjustments | | (0.03) | |
| Non-GAAP net income per diluted common share | | $ | 0.45 | |
| | | | | | | |
1 | Based on 69.6 million weighted-average diluted common shares outstanding. | | |
| | | |
| | | |
| | | |
| | | |
| | | |
| | | |
| | | |
| | | |
| | | | | | | | | | | | | | | | | | | | | | | | | | |
| Calix, Inc. |
| Reconciliation of GAAP to Non-GAAP Guidance |
| (Unaudited, dollars in thousands, except per share data) |
| Three Months Ending December 31, 2023 |
| | GAAP | | Stock-Based Compensation | | Intangible
Asset Amortization | | Non-GAAP |
| Gross margin | | 52.5% - 54.5% | | 0.3% | | 0.2% | | 53.0% - 55.0% |
| Operating expenses | | $129,000 - $132,000 | | $(18,000) | | $ — | | $111,000 - $114,000 |
Net income per diluted common share 1 | | $0.11 - $0.17 | | $0.21 2 | | $0.01 2 | | $0.33 - $0.39 |
| | | | | | | |
1 | Based on 69.3 million weighted-average diluted common shares outstanding. | | |
2 | Net of income taxes. | | |
| | | |
| | | |
| | | |
| | | |
| | | |
| | | |
| | | |
| | | |
| X |
- DefinitionBoolean flag that is true when the XBRL content amends previously-filed or accepted submission.
| Name: |
dei_AmendmentFlag |
| Namespace Prefix: |
dei_ |
| Data Type: |
xbrli:booleanItemType |
| Balance Type: |
na |
| Period Type: |
duration |
|
| X |
- DefinitionFor the EDGAR submission types of Form 8-K: the date of the report, the date of the earliest event reported; for the EDGAR submission types of Form N-1A: the filing date; for all other submission types: the end of the reporting or transition period. The format of the date is YYYY-MM-DD.
| Name: |
dei_DocumentPeriodEndDate |
| Namespace Prefix: |
dei_ |
| Data Type: |
xbrli:dateItemType |
| Balance Type: |
na |
| Period Type: |
duration |
|
| X |
- DefinitionThe type of document being provided (such as 10-K, 10-Q, 485BPOS, etc). The document type is limited to the same value as the supporting SEC submission type, or the word 'Other'.
| Name: |
dei_DocumentType |
| Namespace Prefix: |
dei_ |
| Data Type: |
dei:submissionTypeItemType |
| Balance Type: |
na |
| Period Type: |
duration |
|
| X |
- DefinitionAddress Line 1 such as Attn, Building Name, Street Name
| Name: |
dei_EntityAddressAddressLine1 |
| Namespace Prefix: |
dei_ |
| Data Type: |
xbrli:normalizedStringItemType |
| Balance Type: |
na |
| Period Type: |
duration |
|
| X |
- Definition
+ References
+ Details
| Name: |
dei_EntityAddressCityOrTown |
| Namespace Prefix: |
dei_ |
| Data Type: |
xbrli:normalizedStringItemType |
| Balance Type: |
na |
| Period Type: |
duration |
|
| X |
- DefinitionCode for the postal or zip code
| Name: |
dei_EntityAddressPostalZipCode |
| Namespace Prefix: |
dei_ |
| Data Type: |
xbrli:normalizedStringItemType |
| Balance Type: |
na |
| Period Type: |
duration |
|
| X |
- DefinitionName of the state or province.
| Name: |
dei_EntityAddressStateOrProvince |
| Namespace Prefix: |
dei_ |
| Data Type: |
dei:stateOrProvinceItemType |
| Balance Type: |
na |
| Period Type: |
duration |
|
| X |
- DefinitionA unique 10-digit SEC-issued value to identify entities that have filed disclosures with the SEC. It is commonly abbreviated as CIK. Reference 1: http://www.xbrl.org/2003/role/presentationRef
-Publisher SEC
-Name Exchange Act
-Number 240
-Section 12
-Subsection b-2
| Name: |
dei_EntityCentralIndexKey |
| Namespace Prefix: |
dei_ |
| Data Type: |
dei:centralIndexKeyItemType |
| Balance Type: |
na |
| Period Type: |
duration |
|
| X |
- DefinitionIndicate if registrant meets the emerging growth company criteria. Reference 1: http://www.xbrl.org/2003/role/presentationRef
-Publisher SEC
-Name Exchange Act
-Number 240
-Section 12
-Subsection b-2
| Name: |
dei_EntityEmergingGrowthCompany |
| Namespace Prefix: |
dei_ |
| Data Type: |
xbrli:booleanItemType |
| Balance Type: |
na |
| Period Type: |
duration |
|
| X |
- DefinitionCommission file number. The field allows up to 17 characters. The prefix may contain 1-3 digits, the sequence number may contain 1-8 digits, the optional suffix may contain 1-4 characters, and the fields are separated with a hyphen.
| Name: |
dei_EntityFileNumber |
| Namespace Prefix: |
dei_ |
| Data Type: |
dei:fileNumberItemType |
| Balance Type: |
na |
| Period Type: |
duration |
|
| X |
- DefinitionTwo-character EDGAR code representing the state or country of incorporation.
| Name: |
dei_EntityIncorporationStateCountryCode |
| Namespace Prefix: |
dei_ |
| Data Type: |
dei:edgarStateCountryItemType |
| Balance Type: |
na |
| Period Type: |
duration |
|
| X |
- DefinitionThe exact name of the entity filing the report as specified in its charter, which is required by forms filed with the SEC. Reference 1: http://www.xbrl.org/2003/role/presentationRef
-Publisher SEC
-Name Exchange Act
-Number 240
-Section 12
-Subsection b-2
| Name: |
dei_EntityRegistrantName |
| Namespace Prefix: |
dei_ |
| Data Type: |
xbrli:normalizedStringItemType |
| Balance Type: |
na |
| Period Type: |
duration |
|
| X |
- DefinitionThe Tax Identification Number (TIN), also known as an Employer Identification Number (EIN), is a unique 9-digit value assigned by the IRS. Reference 1: http://www.xbrl.org/2003/role/presentationRef
-Publisher SEC
-Name Exchange Act
-Number 240
-Section 12
-Subsection b-2
| Name: |
dei_EntityTaxIdentificationNumber |
| Namespace Prefix: |
dei_ |
| Data Type: |
dei:employerIdItemType |
| Balance Type: |
na |
| Period Type: |
duration |
|
| X |
- DefinitionLocal phone number for entity.
| Name: |
dei_LocalPhoneNumber |
| Namespace Prefix: |
dei_ |
| Data Type: |
xbrli:normalizedStringItemType |
| Balance Type: |
na |
| Period Type: |
duration |
|
| X |
- DefinitionBoolean flag that is true when the Form 8-K filing is intended to satisfy the filing obligation of the registrant as pre-commencement communications pursuant to Rule 13e-4(c) under the Exchange Act. Reference 1: http://www.xbrl.org/2003/role/presentationRef
-Publisher SEC
-Name Exchange Act
-Number 240
-Section 13e
-Subsection 4c
| Name: |
dei_PreCommencementIssuerTenderOffer |
| Namespace Prefix: |
dei_ |
| Data Type: |
xbrli:booleanItemType |
| Balance Type: |
na |
| Period Type: |
duration |
|
| X |
- DefinitionBoolean flag that is true when the Form 8-K filing is intended to satisfy the filing obligation of the registrant as pre-commencement communications pursuant to Rule 14d-2(b) under the Exchange Act. Reference 1: http://www.xbrl.org/2003/role/presentationRef
-Publisher SEC
-Name Exchange Act
-Number 240
-Section 14d
-Subsection 2b
| Name: |
dei_PreCommencementTenderOffer |
| Namespace Prefix: |
dei_ |
| Data Type: |
xbrli:booleanItemType |
| Balance Type: |
na |
| Period Type: |
duration |
|
| X |
- DefinitionTitle of a 12(b) registered security. Reference 1: http://www.xbrl.org/2003/role/presentationRef
-Publisher SEC
-Name Exchange Act
-Number 240
-Section 12
-Subsection b
| Name: |
dei_Security12bTitle |
| Namespace Prefix: |
dei_ |
| Data Type: |
dei:securityTitleItemType |
| Balance Type: |
na |
| Period Type: |
duration |
|
| X |
- DefinitionName of the Exchange on which a security is registered. Reference 1: http://www.xbrl.org/2003/role/presentationRef
-Publisher SEC
-Name Exchange Act
-Number 240
-Section 12
-Subsection d1-1
| Name: |
dei_SecurityExchangeName |
| Namespace Prefix: |
dei_ |
| Data Type: |
dei:edgarExchangeCodeItemType |
| Balance Type: |
na |
| Period Type: |
duration |
|
| X |
- DefinitionBoolean flag that is true when the Form 8-K filing is intended to satisfy the filing obligation of the registrant as soliciting material pursuant to Rule 14a-12 under the Exchange Act. Reference 1: http://www.xbrl.org/2003/role/presentationRef
-Publisher SEC
-Name Exchange Act
-Section 14a
-Number 240
-Subsection 12
| Name: |
dei_SolicitingMaterial |
| Namespace Prefix: |
dei_ |
| Data Type: |
xbrli:booleanItemType |
| Balance Type: |
na |
| Period Type: |
duration |
|
| X |
- DefinitionTrading symbol of an instrument as listed on an exchange.
| Name: |
dei_TradingSymbol |
| Namespace Prefix: |
dei_ |
| Data Type: |
dei:tradingSymbolItemType |
| Balance Type: |
na |
| Period Type: |
duration |
|
| X |
- DefinitionBoolean flag that is true when the Form 8-K filing is intended to satisfy the filing obligation of the registrant as written communications pursuant to Rule 425 under the Securities Act. Reference 1: http://www.xbrl.org/2003/role/presentationRef
-Publisher SEC
-Name Securities Act
-Number 230
-Section 425
| Name: |
dei_WrittenCommunications |
| Namespace Prefix: |
dei_ |
| Data Type: |
xbrli:booleanItemType |
| Balance Type: |
na |
| Period Type: |
duration |
|
Calix (NYSE:CALX)
Historical Stock Chart
From Jun 2024 to Jul 2024

Calix (NYSE:CALX)
Historical Stock Chart
From Jul 2023 to Jul 2024
