0001140536 False 0001140536 2024-02-06 2024-02-06 iso4217:USD xbrli:shares iso4217:USD xbrli:shares
UNITED STATES
SECURITIES AND EXCHANGE COMMISSION
Washington, D.C. 20549
_________________
FORM 8-K
_________________
CURRENT REPORT
Pursuant to Section 13 or 15(d)
of the Securities Exchange Act of 1934
Date of Report (Date of earliest event reported): February 6, 2024
_______________________________
WILLIS TOWERS WATSON PLC
(Exact name of registrant as specified in its charter)
_______________________________
| Ireland | 001-16503 | 98-0352587 |
| (State or Other Jurisdiction of Incorporation) | (Commission File Number) | (I.R.S. Employer Identification No.) |
c/o Willis Group Limited, 51 Lime Street, London, EC3M 7DQ, England
(Address, including Zip Code, of Principal Executive Offices)
Registrant's telephone number, including area code: (011) (44)-(20)-3124-6000
Not Applicable
(Former name or former address, if changed since last report)
_______________________________
Check the appropriate box below if the Form 8-K filing is intended to simultaneously satisfy the filing obligation of the registrant under any of the following provisions:
| ☐ | Written communications pursuant to Rule 425 under the Securities Act (17 CFR 230.425) |
| ☐ | Soliciting material pursuant to Rule 14a-12 under the Exchange Act (17 CFR 240.14a-12) |
| ☐ | Pre-commencement communications pursuant to Rule 14d-2(b) under the Exchange Act (17 CFR 240.14d-2(b)) |
| ☐ | Pre-commencement communications pursuant to Rule 13e-4(c) under the Exchange Act (17 CFR 240.13e-4(c)) |
Securities registered pursuant to Section 12(b) of the Act:
| Title of each class | Trading Symbol(s) | Name of each exchange on which registered |
| Ordinary Shares, nominal value $0.000304635 per share | WTW | NASDAQ Global Select Market |
Indicate by check mark whether the registrant is an emerging growth company as defined in Rule 405 of the Securities Act of 1933 (§230.405 of this chapter) or Rule 12b-2 of the Securities Exchange Act of 1934 (§240.12b-2 of this chapter).
Emerging growth company ☐
If an emerging growth company, indicate by check mark if the registrant has elected not to use the extended transition period for complying with any new or revised financial accounting standards provided pursuant to Section 13(a) of the Exchange Act. ☐
Item 2.02. Results of Operations and Financial Condition.
On February 6, 2024, Willis Towers Watson Public Limited Company (“WTW”) issued a press release announcing its financial results for the period ended December 31, 2023.
A copy of WTW’s press release is attached hereto as Exhibit 99.1 to this Current Report on Form 8-K and is incorporated by reference herein. A reconciliation between certain non-GAAP financial measures and reported financial results is provided as an attachment to the press release.
Item 7.01. Regulation FD Disclosure.
WTW also posted to the investor relations section of its website a slide presentation, which it may refer to during its conference call to discuss the results. The slide presentation is attached hereto as Exhibit 99.2 to this Current Report on Form 8-K and is incorporated by reference herein.
The information contained in Item 2.02 and Item 7.01 of this Current Report on Form 8-K (including Exhibits 99.1 and 99.2) is being furnished and shall not be deemed “filed” for the purposes of Section 18 of the Securities Exchange Act of 1934, as amended (the “Exchange Act”), or otherwise subject to the liabilities of that section. Such information shall not be incorporated by reference into any registration statement or other document pursuant to the Securities Act of 1933, as amended, or the Exchange Act, except as shall be expressly set forth by specific reference in any such filing.
Item 9.01. Financial Statements and Exhibits.
(d) Exhibits
The following exhibits are furnished herewith:
SIGNATURE
Pursuant to the requirements of the Securities Exchange Act of 1934, the registrant has duly caused this report to be signed on its behalf by the undersigned hereunto duly authorized.
| | WILLIS TOWERS WATSON PLC |
| | (Registrant) |
| | | |
| | | |
| Date: February 6, 2024 | By: | /s/ Andrew Krasner |
| | Name: | Andrew Krasner |
| | Title: | Chief Financial Officer |
| | | |
EXHIBIT 99.1
WTW Reports Fourth Quarter and Full Year 2023 Earnings
- Revenue1 increased 7% to $2.9 billion for the quarter and increased 7% to $9.5 billion for the year
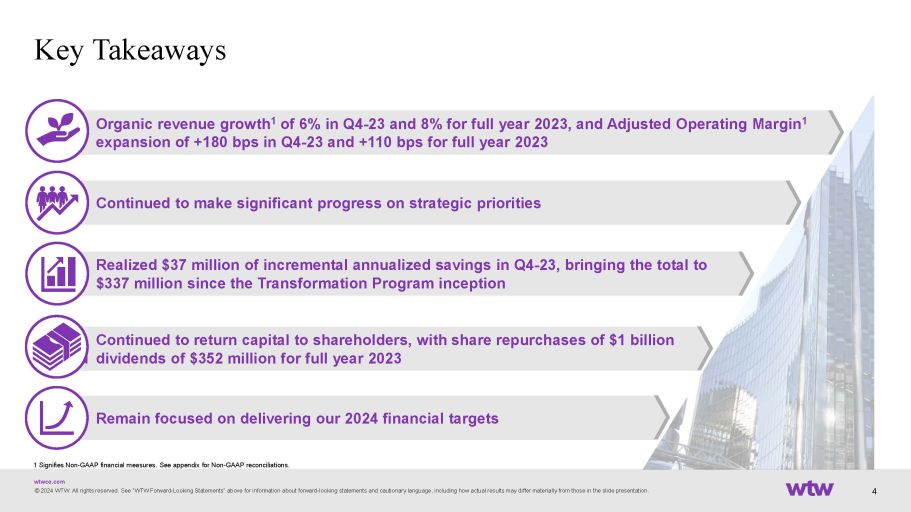
- Organic Revenue growth of 6% for the quarter and 8% for the year
- Diluted Earnings per Share were $5.97 for the quarter, up 11% over prior year, and $9.95 for the year, up 11% over prior year
- Adjusted Diluted Earnings per Share were $7.44 for the quarter, up 18% from prior year, and $14.49 for the year, up 8% over prior year
- Operating Margin was 26.7% for the quarter, up 70 basis points from prior year, and 14.4% for the year, up 110 basis points over prior year
- Adjusted Operating Margin was 34.2% for the quarter, up 180 basis points from prior year, and 22.0% for the year, up 110 basis points over prior year
LONDON, Feb. 06, 2024 (GLOBE NEWSWIRE) -- WTW (NASDAQ: WTW) (the “Company”), a leading global advisory, broking and solutions company, today announced financial results for the fourth quarter and year ended December 31, 2023.
“WTW closed 2023 with robust momentum, delivering strong organic revenue, margin, and earnings growth in the fourth quarter to cap a solid financial performance for the year,” said Carl Hess, WTW’s chief executive officer. “Our topline results and healthy pipeline for 2024 reflect the success of our growth initiatives with both new and existing clients. Alongside the strong revenue growth, our progress simplifying and transforming our operations drove efficiencies and margin expansion in the quarter. We also made progress on our commitment to improve cash flow. I applaud my colleagues for their hard work in growing, simplifying and transforming WTW. I look forward to our working together in 2024 as we aim to achieve our strategic and financial goals and create value for our shareholders.”
Consolidated Results
Fourth Quarter 2023, as reported, USD millions, except %
| Key Metrics | Q4-23 | Q4-22 | Y/Y Change |
| Revenue1 | $2,914 | $2,722 | Reported 7% | CC 6% | Organic 6% |
| Income from Operations | $779 | $708 | 10% |
| Operating Margin % | 26.7% | 26.0% | 70 bps |
| Adjusted Operating Income | $998 | $882 | 13% |
| Adjusted Operating Margin % | 34.2% | 32.4% | 180 bps |
| Net Income | $623 | $593 | 5% |
| Adjusted Net Income | $775 | $689 | 12% |
| Diluted EPS | $5.97 | $5.40 | 11% |
| Adjusted Diluted EPS | $7.44 | $6.33 | 18% |
| 1 | The revenue amounts included in this release are presented on a U.S. GAAP basis except where stated otherwise. This excludes reinsurance revenue which is reported in discontinued operations. The segment discussion is on an organic basis.
|
Revenue was $2.91 billion for the fourth quarter of 2023, an increase of 7% as compared to $2.72 billion for the same period in the prior year. Excluding the impact of foreign currency, revenue increased 6%. On an organic basis, revenue increased 6%. See Supplemental Segment Information on page 9 for additional detail on book-of-business settlements and interest income included in revenue.
Net Income for the fourth quarter of 2023 was $623 million, an increase of 5% compared to Net Income of $593 million in the prior-year fourth quarter. Adjusted EBITDA for the fourth quarter was $1.1 billion, or 37.1% of revenue, an increase of 7%, compared to Adjusted EBITDA of $1.0 billion, or 37.1% of revenue, in the prior-year fourth quarter. The U.S. GAAP tax rate for the fourth quarter was 15.7%, and the adjusted income tax rate for the fourth quarter used in calculating adjusted diluted earnings per share was 19.1%.
Full Year 2023, as reported, USD millions, except %
| Key Metrics | FY-23 | FY-22 | Y/Y Change |
| Revenue1 | $9,483 | $8,866 | Reported 7% | CC 7% | Organic 8% |
| Income from Operations | $1,365 | $1,178 | 16% |
| Operating Margin % | 14.4% | 13.3% | 110 bps |
| Adjusted Operating Income | $2,082 | $1,851 | 12% |
| Adjusted Operating Margin % | 22.0% | 20.9% | 110 bps |
| Net Income | $1,064 | $1,024 | 4% |
| Adjusted Net Income | $1,536 | $1,507 | 2% |
| Diluted EPS | $9.95 | $8.98 | 11% |
| Adjusted Diluted EPS | $14.49 | $13.41 | 8% |
| 1 | The revenue amounts included in this release are presented on a U.S. GAAP basis except where stated otherwise. This excludes reinsurance revenue which is reported in discontinued operations. The segment discussion is on an organic basis.
|
Revenue was $9.48 billion for the year ended December 31, 2023, an increase of 7% as compared to $8.87 billion for the prior year. On an organic basis, revenue increased 8%. See Supplemental Segment Information on page 9 for additional detail on book-of-business settlements and interest income included in revenue.
Net Income for the year ended December 31, 2023 was $1.1 billion, an increase of 4% compared to Net Income of $1.0 billion in the prior year. Adjusted EBITDA for 2023 was $2.4 billion, or 25.6% of revenue, an increase of $43 million, compared to Adjusted EBITDA of $2.4 billion, or 26.9% of revenue, in the prior year.
The U.S. GAAP tax rate for 2023 was 16.8%, and the adjusted income tax rate for 2023 used in calculating adjusted diluted earnings per share was 20.9%. The adjusted income tax rate for 2023 was impacted by one-time favorable items. Excluding these items, our adjusted income tax rate for 2023 would have been 22.4%.
Cash Flow and Capital Allocation
Cash flow from operating activities were $1.3 billion for the year ended December 31, 2023, compared to $812 million for the prior year. Free cash flow for the years ended December 31, 2023 and 2022 was $1.2 billion and $674 million, respectively, an improvement of $518 million. During the fourth quarter and year ended December 31, 2023, the Company repurchased $196 million and $1.0 billion of WTW shares, respectively.
Quarterly Business Highlights
- Realized $37 million of incremental annualized Transformation program savings, bringing the total to $337 million in cumulative savings since the program's inception. Refer to the Supplemental Slides for additional detail.
- Repurchased 832,009 of our shares for $196 million.
- Announced the formation of a newly created team, Strategic Client Engagement Leaders, focused on driving growth of large, complex clients within the twelve industry vertical divisions of Corporate Risk & Broking in North America, to further advance our specialization strategy in the Risk & Broking segment.
Fourth Quarter 2023 Segment Highlights
Health, Wealth & Career
As reported, USD millions, except %
| Health, Wealth & Career | Q4-23 | Q4-22 | Y/Y Change |
| Total Revenue | $1,798 | $1,722 | Reported 4% | CC 3% | Organic 4% |
| Operating Income | $729 | $672 | 8% |
| Operating Margin % | 40.5% | 39.0% | 150 bps |
The HWC segment had revenue of $1.80 billion in the fourth quarter of 2023, an increase of 4% (3% increase constant currency and 4% organic) from $1.72 billion in the prior year. Organic growth in Benefits Delivery & Outsourcing was driven by higher volumes and placements of Medicare Advantage and life policies in Individual Marketplace and increased compliance and other project activity in Outsourcing. Our Wealth businesses generated organic revenue growth from higher levels of Retirement work in North America and Europe, along with new client acquisitions, pension brokerage and higher fees in Investments. Organic revenue growth in Health was driven by the continued expansion of our Global Benefits Management client portfolio, increased brokerage income and a modest tailwind from book-of-business settlement revenue. Career had organic revenue growth from our compensation survey sales and executive compensation, reward-based advisory and employee experience services.
Operating margins in the HWC segment increased 150 basis points from the prior-year fourth quarter to 40.5%, primarily from Transformation savings.
Risk & Broking
As reported, USD millions, except %
| Risk & Broking | Q4-23 | Q4-22 | Y/Y Change |
| Total Revenue | $1,076 | $952 | Reported 13% | CC 12% | Organic 12% |
| Operating Income | $354 | $269 | 32% |
| Operating Margin % | 32.9% | 28.3% | 460 bps |
The R&B segment had revenue of $1.08 billion in the fourth quarter of 2023, an increase of 13% (12% increase constant currency and organic) from $952 million in the prior year. Corporate Risk & Broking generated exceptional organic revenue growth driven by strong new business, improved client retention and rate increases. Insurance Consulting and Technology had organic revenue growth from software sales and increased project revenue.
Operating margins in the R&B segment increased 460 basis points from the prior-year fourth quarter to 32.9%, due to higher operating leverage, driven by strong organic revenue growth and increased productivity from recent hires, and Transformation savings.
Outlook
Based on current and anticipated market conditions, the Company's full-year targets for 2024, consistent with those targets that have been previously provided, are as follows. Refer to the Supplemental Slides for additional detail.
- Expect to deliver revenue of $9.9 billion or greater and mid-single digit organic revenue growth for the full year 2024
- Expect to deliver adjusted operating margin of 22.5% - 23.5% for the full year 2024
- Expect to deliver adjusted diluted earnings per share of $15.40 - $17.00 for the full year 2024
- Expect approximately $88 million in non-cash pension income for the full year 2024
- Expect a foreign currency headwind on adjusted earnings per share of approximately $0.02 for the full year 2024 at today’s rates
- Expect to deliver approximately $425 million of cumulative run-rate savings from the Transformation program by the end of 2024, up from $380 million previously, and total program costs of $1.125 billion, up from $900 million previously.
Outlook includes Non-GAAP financial measures. We do not reconcile forward-looking Non-GAAP measures for reasons explained below.
Conference Call
The Company will host a live webcast and conference call to discuss the financial results for the fourth quarter and full year 2023. It will be held on Tuesday, February 6, 2024, beginning at 9:00 a.m. Eastern Time. A live broadcast of the conference call will be available on WTW’s website here. The conference call will include a question-and-answer session. To participate in the question-and-answer session, please register here. An online replay will be available at www.wtwco.com shortly after the call concludes.
About WTW
At WTW (NASDAQ: WTW), we provide data-driven, insight-led solutions in the areas of people, risk and capital. Leveraging the global view and local expertise of our colleagues serving 140 countries and markets, we help organizations sharpen their strategy, enhance organizational resilience, motivate their workforce and maximize performance. Working shoulder to shoulder with our clients, we uncover opportunities for sustainable success—and provide perspective that moves you. Learn more at www.wtwco.com.
WTW Non-GAAP Measures
In order to assist readers of our consolidated financial statements in understanding the core operating results that WTW’s management uses to evaluate the business and for financial planning, we present the following non-GAAP measures: (1) Constant Currency Change, (2) Organic Change, (3) Adjusted Operating Income/Margin, (4) Adjusted EBITDA/Margin, (5) Adjusted Net Income, (6) Adjusted Diluted Earnings Per Share, (7) Adjusted Income Before Taxes, (8) Adjusted Income Taxes/Tax Rate, (9) Free Cash Flow and (10) Free Cash Flow Margin.
We believe that those measures are relevant and provide pertinent information widely used by analysts, investors and other interested parties in our industry to provide a baseline for evaluating and comparing our operating performance, and in the case of free cash flow, our liquidity results.
Within the measures referred to as ‘adjusted’, we adjust for significant items which will not be settled in cash, or which we believe to be items that are not core to our current or future operations. Some of these items may not be applicable for the current quarter, however they may be part of our full-year results. Additionally, we have historically adjusted for certain items which are not described below, but for which we may adjust in a future period when applicable. Items applicable to the quarter or full year results, or the comparable periods, include the following:
- Income and loss from discontinued operations, net of tax – Adjustment to remove the after-tax income or loss from discontinued operations and the after-tax gain attributable to the divestiture of our Willis Re business.
- Restructuring costs and transaction and transformation – Management believes it is appropriate to adjust for restructuring costs and transaction and transformation when they relate to a specific significant program with a defined set of activities and costs that are not expected to continue beyond a defined period of time, or significant acquisition-related transaction expenses. We believe the adjustment is necessary to present how the Company is performing, both now and in the future when the incurrence of these costs will have concluded.
- Impairment – Adjustment to remove the impairment related to the net assets of our Russian business that are held outside of our Russian entities.
- Gains and losses on disposals of operations – Adjustment to remove the gains or losses resulting from disposed operations that have not been classified as discontinued operations.
- Tax effect of the Coronavirus Aid, Relief, and Economic Security (‘CARES’) Act – Relates to the incremental tax expense or benefit, primarily from the Base Erosion and Anti-Abuse Tax (‘BEAT’), generated from electing or changing elections of certain income tax provisions available under the CARES Act.
- Tax effect of internal reorganizations – Relates to the U.S. income tax expense resulting from the completion of internal reorganizations of the ownership of certain businesses that reduced the investments held by our U.S.-controlled subsidiaries.
We evaluate our revenue on an as reported (U.S. GAAP), constant currency and organic basis. We believe presenting constant currency and organic information provides valuable supplemental information regarding our comparable results, consistent with how we evaluate our performance internally.
We consider Constant Currency Change, Organic Change, Adjusted Operating Income/Margin, Adjusted EBITDA/Margin, Adjusted Net Income, Adjusted Diluted Earnings Per Share, Adjusted Income Before Taxes, Adjusted Income Taxes/Tax Rate and Free Cash Flow to be important financial measures, which are used to internally evaluate and assess our core operations and to benchmark our operating and liquidity results against our competitors. These non-GAAP measures are important in illustrating what our comparable operating and liquidity results would have been had we not incurred transaction-related and non-recurring items. Reconciliations of these measures are included in the accompanying tables with the following exception: The Company does not reconcile its forward-looking non-GAAP financial measures to the corresponding U.S. GAAP measures, due to variability and difficulty in making accurate forecasts and projections and/or certain information not being ascertainable or accessible; and because not all of the information, such as foreign currency impacts necessary for a quantitative reconciliation of these forward-looking non-GAAP financial measures to the most directly comparable U.S. GAAP financial measure, is available to the Company without unreasonable efforts. For the same reasons, the Company is unable to address the probable significance of the unavailable information. The Company provides non-GAAP financial measures that it believes will be achieved, however it cannot accurately predict all of the components of the adjusted calculations and the U.S. GAAP measures may be materially different than the non-GAAP measures.
Our non-GAAP measures and their accompanying definitions are presented as follows:
Constant Currency Change – Represents the year-over-year change in revenue excluding the impact of foreign currency fluctuations. To calculate this impact, the prior year local currency results are first translated using the current year monthly average exchange rates. The change is calculated by comparing the prior year revenue, translated at the current year monthly average exchange rates, to the current year as reported revenue, for the same period. We believe constant currency measures provide useful information to investors because they provide transparency to performance by excluding the effects that foreign currency exchange rate fluctuations have on period-over-period comparability given volatility in foreign currency exchange markets.
Organic Change – Excludes the impact of fluctuations in foreign currency exchange rates, as described above and the period-over-period impact of acquisitions and divestitures on current-year revenue. We believe that excluding transaction-related items from our U.S. GAAP financial measures provides useful supplemental information to our investors, and it is important in illustrating what our core operating results would have been had we not included these transaction-related items, since the nature, size and number of these transaction-related items can vary from period to period.
Adjusted Operating Income/Margin – Income from operations adjusted for amortization, restructuring costs, transaction and transformation and non-recurring items that, in management’s judgment, significantly affect the period-over-period assessment of operating results. Adjusted operating income margin is calculated by dividing adjusted operating income by revenue. We consider adjusted operating income/margin to be important financial measures, which are used internally to evaluate and assess our core operations and to benchmark our operating results against our competitors.
Adjusted EBITDA/Margin – Net Income adjusted for loss/(income) from discontinued operations, net of tax, provision for income taxes, interest expense, depreciation and amortization, restructuring costs, transaction and transformation, gains and losses on disposals of operations and non-recurring items that, in management’s judgment, significantly affect the period-over-period assessment of operating results. Adjusted EBITDA Margin is calculated by dividing adjusted EBITDA by revenue. We consider adjusted EBITDA/margin to be important financial measures, which are used internally to evaluate and assess our core operations, to benchmark our operating results against our competitors and to evaluate and measure our performance-based compensation plans.
Adjusted Net Income – Net Income Attributable to WTW adjusted for loss/(income) from discontinued operations, net of tax, amortization, restructuring costs, transaction and transformation, gains and losses on disposals of operations and non-recurring items that, in management’s judgment, significantly affect the period-over-period assessment of operating results and the related tax effect of those adjustments and the tax effects of internal reorganizations. This measure is used solely for the purpose of calculating adjusted diluted earnings per share.
Adjusted Diluted Earnings Per Share – Adjusted Net Income divided by the weighted-average number of ordinary shares, diluted. Adjusted diluted earnings per share is used to internally evaluate and assess our core operations and to benchmark our operating results against our competitors.
Adjusted Income Before Taxes – Income from operations before income taxes adjusted for amortization, restructuring costs, transaction and transformation, gains and losses on disposals of operations and non-recurring items that, in management’s judgment, significantly affect the period-over-period assessment of operating results. Adjusted income before taxes is used solely for the purpose of calculating the adjusted income tax rate.
Adjusted Income Taxes/Tax Rate – Provision for income taxes adjusted for taxes on certain items of amortization, restructuring costs, transaction and transformation, gains and losses on disposals of operations, the tax effects of internal reorganizations, and non-recurring items that, in management’s judgment, significantly affect the period-over-period assessment of operating results, divided by adjusted income before taxes. Adjusted income taxes is used solely for the purpose of calculating the adjusted income tax rate. Management believes that the adjusted income tax rate presents a rate that is more closely aligned to the rate that we would incur if not for the reduction of pre-tax income for the adjusted items and the tax effects of internal reorganizations, which are not core to our current and future operations.
Free Cash Flow – Cash flows from operating activities less cash used to purchase fixed assets and software for internal use. Free Cash Flow is a liquidity measure and is not meant to represent residual cash flow available for discretionary expenditures. Management believes that free cash flow presents the core operating performance and cash-generating capabilities of our business operations.
Free Cash Flow Margin – Free Cash Flow as a percentage of revenue, which represents how much of revenue would be realized on a cash basis. We consider this measure to be a meaningful metric for tracking cash conversion on a year-over-year basis due to the non-cash nature of our pension income, which is included in our GAAP and Non-GAAP earnings metrics presented herein.
These non-GAAP measures are not defined in the same manner by all companies and may not be comparable to other similarly titled measures of other companies. Non-GAAP measures should be considered in addition to, and not as a substitute for, the information contained within our condensed consolidated financial statements.
WTW Forward-Looking Statements
This document contains ‘forward-looking statements’ within the meaning of Section 27A of the Securities Act of 1933, and Section 21E of the Securities Exchange Act of 1934, which are intended to be covered by the safe harbors created by those laws. These forward-looking statements include information about possible or assumed future results of our operations. All statements, other than statements of historical facts, that address activities, events, or developments that we expect or anticipate may occur in the future, including such things as our outlook, the potential impact of natural or man-made disasters like health pandemics and other world health crises; future capital expenditures; ongoing working capital efforts; future share repurchases; financial results (including our revenue, costs, or margins) and the impact of changes to tax laws on our financial results; existing and evolving business strategies and acquisitions and dispositions, including our completed sale of Willis Re to Arthur J. Gallagher & Co. (‘Gallagher’) and transitional arrangements related thereto; demand for our services and competitive strengths; strategic goals; the benefits of new initiatives; growth of our business and operations; the sustained health of our product, service, transaction, client, and talent assessment and management pipelines; our ability to successfully manage ongoing leadership, organizational and technology changes, including investments in improving systems and processes; our ability to implement and realize anticipated benefits of any cost-savings initiatives including the multi-year operational Transformation program; our recognition of future impairment charges; and plans and references to future successes, including our future financial and operating results, short-term and long-term financial goals, plans, objectives, expectations and intentions are forward-looking statements including with respect to free cash flow generation, adjusted net revenue, adjusted operating margin, and adjusted earnings per share. Also, when we use words such as ‘may’, ‘will’, ‘would’, ‘anticipate’, ‘believe’, ‘estimate’, ‘expect’, ‘intend’, ‘plan’, ‘continues’, ‘seek’, ‘target’, ‘goal’, ‘focus’, ‘probably’, or similar expressions, we are making forward-looking statements. Such statements are based upon the current beliefs and expectations of the Company’s management and are subject to significant risks and uncertainties. Actual results may differ from those set forth in the forward-looking statements. All forward-looking disclosure is speculative by its nature.
There are important risks, uncertainties, events and factors that could cause our actual results or performance to differ materially from those in the forward-looking statements contained in this document, including the following[A1] : our ability to successfully establish, execute and achieve our global business strategy as it evolves; our ability to fully realize anticipated benefits of our growth strategy; our ability to achieve our short-term and long-term financial goals, such as with respect to our cash flow generation, and the timing with respect to such achievement; the risks related to changes in general economic (including a possible recession), business and political conditions, including changes in the financial markets, inflation, credit availability, increased interest rates and trade policies; the risks to our short-term and long-term financial goals from any of the risks or uncertainties set forth herein; the risks relating to the adverse impacts of macroeconomic trends, including inflation, changes in interest rates and trade policies, as well as political events, trade and other international disputes, war, such as the Russia-Ukraine and Israel-Hamas wars, terrorism, natural disasters, public health issues and other business interruptions on the global economy and capital markets, which could have a material adverse effect on our business, financial condition, results of operations, and long-term goals; the risks associated with our withdrawal from our high margin businesses in Russia and our ability to achieve cost-mitigation measures; our ability to successfully hedge against fluctuations in foreign currency rates; the risks relating to the adverse impacts of natural or man-made disasters like health pandemics and other world health crises, on the demand for our products and services, our cash flows and our business operations; material interruptions to or loss of our information processing capabilities, or failure to effectively maintain and upgrade our information technology resources and systems and related risks of cybersecurity breaches or incidents; our ability to comply with complex and evolving regulations related to data privacy, cybersecurity and artificial intelligence; the risks relating to the transitional arrangements in effect subsequent to our now-completed sale of Willis Re to Gallagher; significant competition that we face and the potential for loss of market share and/or profitability; the impact of seasonality and differences in timing of renewals and non-recurring revenue increases from disposals and book-of-business sales; the failure to protect client data or breaches of information systems or insufficient safeguards against cybersecurity breaches or incidents; the risk of increased liability or new legal claims arising from our new and existing products and services, and expectations, intentions and outcomes relating to outstanding litigation; the risk of substantial negative outcomes on existing litigation or investigation matters; changes in the regulatory environment in which we operate, including, among other risks, the impacts of pending competition law and regulatory investigations; various claims, government inquiries or investigations or the potential for regulatory action; our ability to make divestitures or acquisitions, including our ability to integrate or manage such acquired businesses, as well as identify and successfully execute on opportunities for strategic collaboration; our ability to integrate direct-to-consumer sales and marketing solutions with our existing offerings and solutions; our ability to successfully manage ongoing organizational changes, including investments in improving systems and processes; disasters or business continuity problems; the ongoing impact of Brexit on our business and operations; our ability to properly identify and manage conflicts of interest; reputational damage, including from association with third parties; reliance on third-party service providers and suppliers; risks relating to changes in our management structures and in senior leadership; the loss of key employees or a large number of employees and rehiring rates; our ability to maintain our corporate culture; doing business internationally, including the impact of foreign currency exchange rates; compliance with extensive government regulation; the risk of sanctions imposed by governments, or changes to associated sanction regulations (such as sanctions imposed on Russia) and related counter-sanctions; our ability to effectively apply technology, data and analytics changes for internal operations, maintaining industry standards and meeting client preferences; changes and developments in the insurance industry or the U.S. healthcare system, including those related to Medicare and any legislative actions from the current U.S. Congress, and any other changes and developments in legal, economic, business or operational conditions impacting our Medicare benefits businesses such as TRANZACT; the inability to protect our intellectual property rights, or the potential infringement upon the intellectual property rights of others; fluctuations in our pension assets and liabilities and related changes in pension income, including as a result of, related to, or derived from movements in the interest rate environment, investment returns, inflation, or changes in other assumptions that are used to estimate our benefit obligations and its effect on adjusted earnings per share; our capital structure, including indebtedness amounts, the limitations imposed by the covenants in the documents governing such indebtedness and the maintenance of the financial and disclosure controls and procedures of each; our ability to obtain financing on favorable terms or at all; adverse changes in our credit ratings; the impact of recent or potential changes to U.S. or foreign laws, and the enactment of additional, or the revision of existing, state, federal, and/or foreign laws and regulations, recent judicial decisions and development of case law, other regulations and any policy changes and legislative actions, including those that impact our effective tax rate; U.S. federal income tax consequences to U.S. persons owning at least 10% of our shares; changes in accounting principles, estimates or assumptions; our recognition of future impairment charges; risks relating to or arising from environmental, social and governance (‘ESG’) practices; fluctuation in revenue against our relatively fixed or higher than expected expenses; the risk that investment levels, including cash spending, to achieve additional transformation savings increase; the laws of Ireland being different from the laws of the U.S. and potentially affording less protections to the holders of our securities; and our holding company structure potentially preventing us from being able to receive dividends or other distributions in needed amounts from our subsidiaries. The foregoing list of factors is not exhaustive and new factors may emerge from time to time that could also affect actual performance and results. For more information, please see Part I, Item 1A in our Annual Report on Form 10-K, and our subsequent filings with the SEC. Copies are available online at www.sec.gov or www.wtwco.com.
Although we believe that the assumptions underlying our forward-looking statements are reasonable, any of these assumptions, and therefore also the forward-looking statements based on these assumptions, could themselves prove to be inaccurate. Given the significant uncertainties inherent in the forward-looking statements included in this document, our inclusion of this information is not a representation or guarantee by us that our objectives and plans will be achieved.
Our forward-looking statements speak only as of the date made, and we will not update these forward-looking statements unless the securities laws require us to do so. With regard to these risks, uncertainties and assumptions, the forward-looking events discussed in this document may not occur, and we caution you against unduly relying on these forward-looking statements.
Contact
INVESTORS
Claudia De La Hoz | Claudia.Delahoz@wtwco.com
| |
WTW
Supplemental Segment Information
(In millions of U.S. dollars)
(Unaudited) |
| |
| REVENUE | | |
| | | | | | | | Components of Revenue Change(i) |
| | | | | | | | | | | Less: | | | | Less: | | |
| | | Three Months Ended
December 31, | | | As Reported | | Currency | | Constant Currency | | Acquisitions/ | | Organic |
| | | 2023 | | | 2022 | | | % Change | | Impact | | Change | | Divestitures | | Change |
| | | | | | | | | | | | | | | | | |
| Health, Wealth & Career | | $ | 1,798 | | | $ | 1,722 | | | 4 | % | | 1 | % | | 3 | % | | 0 | % | | 4 | % |
| Risk & Broking | | | 1,076 | | | | 952 | | | 13 | % | | 1 | % | | 12 | % | | 0 | % | | 12 | % |
| Segment Revenue | | | 2,874 | | | | 2,674 | | | 7 | % | | 1 | % | | 6 | % | | 0 | % | | 7 | % |
| Reimbursable expenses and other | | | 40 | | | | 48 | | | | | | | | | | | |
| Revenue | | $ | 2,914 | | | $ | 2,722 | | | 7 | % | | 1 | % | | 6 | % | | 0 | % | | 6 | % |
| | | | | | | | | | | Components of Revenue Change(i) |
| | | | | | | | Less: | | | | Less: | | |
| | | Years Ended
December 31, | | | As Reported | | Currency | | Constant Currency | | Acquisitions/ | | Organic |
| | | 2023 | | | 2022 | | | % Change | | Impact | | Change | | Divestitures | | Change |
| | | | | | | | | | | | | | | | | |
| Health, Wealth & Career | | $ | 5,582 | | | $ | 5,287 | | | 6 | % | | 0 | % | | 6 | % | | 0 | % | | 6 | % |
| Risk & Broking | | | 3,735 | | | | 3,460 | | | 8 | % | | 0 | % | | 8 | % | | (1 | )% | | 10 | % |
| Segment Revenue | | | 9,317 | | | | 8,747 | | | 7 | % | | 0 | % | | 7 | % | | (1 | )% | | 7 | % |
| Reimbursable expenses and other | | | 166 | | | | 119 | | | | | | | | | | | |
| Revenue | | $ | 9,483 | | | $ | 8,866 | | | 7 | % | | 0 | % | | 7 | % | | 0 | % | | 8 | % |
(i) Components of revenue change may not add due to rounding.
BOOK-OF-BUSINESS SETTLEMENTS AND INTEREST INCOME
| | | Three Months Ended December 31, | |
| | | HWC | | | R&B | | | Corporate | | | Total | |
| | | 2023 | | | 2022 | | | 2023 | | | 2022 | | | 2023 | | | 2022 | | | 2023 | | | 2022 | |
| Book-of-business settlements | | $ | 1 | | | $ | — | | | $ | 14 | | | $ | 11 | | | $ | — | | | $ | — | | | $ | 15 | | | $ | 11 | |
| Interest income | | | 7 | | | | 4 | | | | 27 | | | | 10 | | | | 5 | | | | 13 | | | | 39 | | | | 27 | |
| Total interest and other income | | $ | 8 | | | $ | 4 | | | $ | 41 | | | $ | 21 | | | $ | 5 | | | $ | 13 | | | $ | 54 | | | $ | 38 | |
| | | Years Ended December 31, | |
| | | HWC | | | R&B | | | Corporate | | | Total | |
| | | 2023 | | | 2022 | | | 2023 | | | 2022 | | | 2023 | | | 2022 | | | 2023 | | | 2022 | |
| Book-of-business settlements | | $ | 1 | | | $ | 19 | | | $ | 25 | | | $ | 52 | | | $ | — | | | $ | — | | | $ | 26 | | | $ | 71 | |
| Interest income | | | 25 | | | | 8 | | | | 79 | | | | 25 | | | | 41 | | | | 22 | | | | 145 | | | | 55 | |
| Total interest and other income | | $ | 26 | | | $ | 27 | | | $ | 104 | | | $ | 77 | | | $ | 41 | | | $ | 22 | | | $ | 171 | | | $ | 126 | |
SEGMENT OPERATING INCOME (i)
| | | Three Months Ended
December 31, | |
| | | 2023 | | | 2022 | |
| | | | | | | |
| Health, Wealth & Career | | $ | 729 | | | $ | 672 | |
| Risk & Broking | | | 354 | | | | 269 | |
| Segment Operating Income | | $ | 1,083 | | | $ | 941 | |
| | | Years Ended
December 31, | |
| | | 2023 | | | 2022 | |
| | | | | | | |
| Health, Wealth & Career | | $ | 1,565 | | | $ | 1,382 | |
| Risk & Broking | | | 813 | | | | 734 | |
| Segment Operating Income | | $ | 2,378 | | | $ | 2,116 | |
(i) Segment operating income excludes certain costs, including amortization of intangibles, restructuring costs, transaction and transformation expenses, certain litigation provisions, and to the extent that the actual expense based upon which allocations are made differs from the forecast/budget amount, a reconciling item will be created between internally-allocated expenses and the actual expenses reported for U.S. GAAP purposes.
SEGMENT OPERATING MARGINS
| | | Three Months Ended
December 31, |
| | | 2023 | | 2022 |
| Health, Wealth & Career | | 40.5% | | 39.0% |
| Risk & Broking | | 32.9% | | 28.3% |
| | | Years Ended
December 31, |
| | | 2023 | | 2022 |
| Health, Wealth & Career | | 28.0% | | 26.1% |
| Risk & Broking | | 21.8% | | 21.2% |
RECONCILIATIONS OF SEGMENT OPERATING INCOME TO INCOME FROM OPERATIONS BEFORE INCOME TAXES
| | | Three Months Ended
December 31, | |
| | | 2023 | | | 2022 | |
| | | | | | | |
| Segment Operating Income | | $ | 1,083 | | | $ | 941 | |
| Amortization | | | (60 | ) | | | (73 | ) |
| Restructuring costs | | | (38 | ) | | | (28 | ) |
| Transaction and transformation (i) | | | (121 | ) | | | (73 | ) |
| Unallocated, net (ii) | | | (85 | ) | | | (59 | ) |
| Income from Operations | | | 779 | | | | 708 | |
| Interest expense | | | (63 | ) | | | (54 | ) |
| Other income, net | | | 23 | | | | 83 | |
| Income from continuing operations before income taxes | | $ | 739 | | | $ | 737 | |
| | | Years Ended
December 31, | |
| | | 2023 | | | 2022 | |
| | | | | | | |
| Segment Operating Income | | $ | 2,378 | | | $ | 2,116 | |
| Impairment (iii) | | | — | | | | (81 | ) |
| Amortization | | | (263 | ) | | | (312 | ) |
| Restructuring costs | | | (68 | ) | | | (99 | ) |
| Transaction and transformation (i) | | | (386 | ) | | | (181 | ) |
| Unallocated, net(ii) | | | (296 | ) | | | (265 | ) |
| Income from Operations | | | 1,365 | | | | 1,178 | |
| Interest expense | | | (235 | ) | | | (208 | ) |
| Other income, net | | | 149 | | | | 288 | |
| Income from operations before income taxes | | $ | 1,279 | | | $ | 1,258 | |
(i) In 2023 and 2022, in addition to legal fees and other transaction costs, includes primarily consulting fees and compensation costs related to the Transformation program.
(ii) Includes certain costs, primarily related to corporate functions which are not directly related to the segments, and certain differences between budgeted expenses determined at the beginning of the year and actual expenses that we report for U.S. GAAP purposes.
(iii) Represents the impairment related to the net assets of our Russian business that are held outside of our Russian entities.
| |
WTW
Reconciliations of Non-GAAP Measures
(In millions of U.S. dollars, except per share data)
(Unaudited) |
| |
| RECONCILIATIONS OF NET INCOME ATTRIBUTABLE TO WTW TO ADJUSTED DILUTED EARNINGS PER SHARE |
| |
| | | Three Months Ended
December 31, | |
| | | 2023 | | | 2022 | |
| | | | | | | |
| Net Income attributable to WTW | | $ | 622 | | | $ | 588 | |
| Adjusted for certain items: | | | | | | |
| Loss from discontinued operations, net of tax | | | — | | | | 13 | |
| Amortization | | | 60 | | | | 73 | |
| Restructuring costs | | | 38 | | | | 28 | |
| Transaction and transformation | | | 121 | | | | 73 | |
| Loss/(gain) on disposal of operations | | | 1 | | | | (18 | ) |
| Tax effect on certain items listed above(i) | | | (67 | ) | | | (72 | ) |
| Tax effect of internal reorganizations | | | — | | | | 4 | |
| Adjusted Net Income | | $ | 775 | | | $ | 689 | |
| | | | | | | |
| Weighted-average ordinary shares, diluted | | | 104 | | | | 109 | |
| | | | | | | |
| Diluted Earnings Per Share | | $ | 5.97 | | | $ | 5.40 | |
| Adjusted for certain items:(ii) | | | | | | |
| Loss from discontinued operations, net of tax | | | — | | | | 0.12 | |
| Amortization | | | 0.58 | | | | 0.67 | |
| Restructuring costs | | | 0.36 | | | | 0.26 | |
| Transaction and transformation | | | 1.16 | | | | 0.67 | |
| Loss/(gain) on disposal of operations | | | 0.01 | | | | (0.17 | ) |
| Tax effect on certain items listed above(i) | | | (0.64 | ) | | | (0.66 | ) |
| Tax effect of internal reorganizations | | | — | | | | 0.04 | |
| Adjusted Diluted Earnings Per Share(ii) | | $ | 7.44 | | | $ | 6.33 | |
(i) The tax effect was calculated using an effective tax rate for each item.
(ii) Per share values and totals may differ due to rounding.
| | | Years Ended
December 31, | |
| | | 2023 | | | 2022 | |
| | | | | | | |
| Net Income attributable to WTW | | $ | 1,055 | | | $ | 1,009 | |
| Adjusted for certain items: | | | | | | |
| Loss from discontinued operations, net of tax | | | — | | | | 40 | |
| Impairment | | | — | | | | 81 | |
| Amortization | | | 263 | | | | 312 | |
| Restructuring costs | | | 68 | | | | 99 | |
| Transaction and transformation | | | 386 | | | | 181 | |
| Gain on disposal of operations | | | (43 | ) | | | (7 | ) |
| Tax effect on certain items listed above(i) | | | (195 | ) | | | (188 | ) |
| Tax effect of the CARES Act | | | — | | | | (24 | ) |
| Tax effects of internal reorganizations | | | 2 | | | | 4 | |
| Adjusted Net Income | | $ | 1,536 | | | $ | 1,507 | |
| | | | | | | |
| Weighted-average ordinary shares, diluted | | | 106 | | | | 112 | |
| | | | | | | |
| Diluted Earnings Per Share | | $ | 9.95 | | | $ | 8.98 | |
| Adjusted for certain items:(ii) | | | | | | |
| Loss from discontinued operations, net of tax | | | — | | | | 0.36 | |
| Impairment | | | — | | | | 0.72 | |
| Amortization | | | 2.48 | | | | 2.78 | |
| Restructuring costs | | | 0.64 | | | | 0.88 | |
| Transaction and transformation | | | 3.64 | | | | 1.61 | |
| Gain on disposal of operations | | | (0.41 | ) | | | (0.06 | ) |
| Tax effect on certain items listed above(i) | | | (1.84 | ) | | | (1.67 | ) |
| Tax effect of the CARES Act | | | — | | | | (0.21 | ) |
| Tax effects of internal reorganizations | | | 0.02 | | | | 0.04 | |
| Adjusted Diluted Earnings Per Share(ii) | | $ | 14.49 | | | $ | 13.41 | |
(i) The tax effect was calculated using an effective tax rate for each item.
(ii) Per share values and totals may differ due to rounding.
RECONCILIATIONS OF NET INCOME TO ADJUSTED EBITDA
| | | Three Months Ended December 31, | |
| | | | 2023 | | | | | 2022 | | | | |
| | | | | | | | | | | |
| Net Income | | $ | 623 | | | 21.4 | % | $ | 593 | | | | 21.8 | % |
| Loss from discontinued operations, net of tax | | | — | | | | | 13 | | | | |
| Provision for income taxes | | | 116 | | | | | 131 | | | | |
| Interest expense | | | 63 | | | | | 54 | | | | |
| Depreciation | | | 58 | | | | | 64 | | | | |
| Amortization | | | 60 | | | | | 73 | | | | |
| Restructuring costs | | | 38 | | | | | 28 | | | | |
| Transaction and transformation | | | 121 | | | | | 73 | | | | |
| Loss/(gain) on disposal of operations | | | 1 | | | | | (18 | ) | | | |
| Adjusted EBITDA and Adjusted EBITDA Margin | | $ | 1,080 | | | 37.1 | % | $ | 1,011 | | | | 37.1 | % |
| | | Years Ended December 31, | |
| | | | 2023 | | | | | 2022 | | | | |
| | | | | | | | | | | |
| Net Income | | $ | 1,064 | | | 11.2 | % | $ | 1,024 | | | | 11.5 | % |
| Loss from discontinued operations, net of tax | | | — | | | | | 40 | | | | |
| Provision for income taxes | | | 215 | | | | | 194 | | | | |
| Interest expense | | | 235 | | | | | 208 | | | | |
| Impairment | | | — | | | | | 81 | | | | |
| Depreciation | | | 242 | | | | | 255 | | | | |
| Amortization | | | 263 | | | | | 312 | | | | |
| Restructuring costs | | | 68 | | | | | 99 | | | | |
| Transaction and transformation | | | 386 | | | | | 181 | | | | |
| Gain on disposal of operations | | | (43 | ) | | | | (7 | ) | | | |
| Adjusted EBITDA and Adjusted EBITDA Margin | | $ | 2,430 | | | 25.6 | % | $ | 2,387 | | | | 26.9 | % |
RECONCILIATIONS OF INCOME FROM OPERATIONS TO ADJUSTED OPERATING INCOME
| | | Three Months Ended December 31, | |
| | | | 2023 | | | | | 2022 | | | | |
| | | | | | | | | | | |
| Income from operations and Operating margin | | $ | 779 | | | 26.7 | % | $ | 708 | | | | 26.0 | % |
| Adjusted for certain items: | | | | | | | | | | |
| Amortization | | | 60 | | | | | 73 | | | | |
| Restructuring costs | | | 38 | | | | | 28 | | | | |
| Transaction and transformation | | | 121 | | | | | 73 | | | | |
| Adjusted operating income and Adjusted operating income margin | | $ | 998 | | | 34.2 | % | $ | 882 | | | | 32.4 | % |
| | | Years Ended December 31, | |
| | | | 2023 | | | | | 2022 | | | | |
| | | | | | | | | | | |
| Income from operations and Operating margin | | $ | 1,365 | | | 14.4 | % | $ | 1,178 | | | | 13.3 | % |
| Adjusted for certain items: | | | | | | | | | | |
| Impairment | | | — | | | | | 81 | | | | |
| Amortization | | | 263 | | | | | 312 | | | | |
| Restructuring costs | | | 68 | | | | | 99 | | | | |
| Transaction and transformation | | | 386 | | | | | 181 | | | | |
| Adjusted operating income and Adjusted operating income margin | | $ | 2,082 | | | 22.0 | % | $ | 1,851 | | | | 20.9 | % |
RECONCILIATIONS OF GAAP INCOME TAXES/TAX RATE TO ADJUSTED INCOME TAXES/TAX RATE
| | | Three Months Ended December 31, | |
| | | | 2023 | | | | 2022 | |
| Income from continuing operations before income taxes | | $ | 739 | | | $ | 737 | |
| | | | | | | |
| Adjusted for certain items: | | | | | | |
| Amortization | | | 60 | | | | 73 | |
| Restructuring costs | | | 38 | | | | 28 | |
| Transaction and transformation | | | 121 | | | | 73 | |
| Loss/(gain) on disposal of operations | | | 1 | | | | (18 | ) |
| Adjusted income before taxes | | $ | 959 | | | $ | 893 | |
| | | | | | | |
| Provision for income taxes | | $ | 116 | | | $ | 131 | |
| Tax effect on certain items listed above(i) | | | 67 | | | | 72 | |
| Tax effect of internal reorganizations | | | — | | | | (4 | ) |
| Adjusted income taxes | | $ | 183 | | | $ | 199 | |
| | | | | | | |
| U.S. GAAP tax rate | | | 15.7 | % | | | 17.7 | % |
| Adjusted income tax rate | | | 19.1 | % | | | 22.2 | % |
| | | Years Ended December 31, | |
| | | | 2023 | | | | 2022 | |
| Income from continuing operations before income taxes | | $ | 1,279 | | | $ | 1,258 | |
| | | | | | | |
| Adjusted for certain items: | | | | | | |
| Impairment | | | — | | | | 81 | |
| Amortization | | | 263 | | | | 312 | |
| Restructuring costs | | | 68 | | | | 99 | |
| Transaction and transformation | | | 386 | | | | 181 | |
| Gain on disposal of operations | | | (43 | ) | | | (7 | ) |
| Adjusted income before taxes | | $ | 1,953 | | | $ | 1,924 | |
| | | | | | | |
| Provision for income taxes | | $ | 215 | | | $ | 194 | |
| Tax effect on certain items listed above(i) | | | 195 | | | | 188 | |
| Tax effect of the CARES Act | | | — | | | | 24 | |
| Tax effect of internal reorganizations | | | (2 | ) | | | (4 | ) |
| Adjusted income taxes | | $ | 408 | | | $ | 402 | |
| | | | | | | |
| U.S. GAAP tax rate | | | 16.8 | % | | | 15.4 | % |
| Adjusted income tax rate | | | 20.9 | % | | | 20.9 | % |
(i) The tax effect was calculated using an effective tax rate for each item.
RECONCILIATION OF CASH FLOWS FROM OPERATING ACTIVITIES TO FREE CASH FLOW
| | | Years Ended December 31, | |
| | | | 2023 | | | | 2022 | |
| Cash flows from operating activities | | $ | 1,345 | | | $ | 812 | |
| Less: Additions to fixed assets and software for internal use | | | (153 | ) | | | (138 | ) |
| Free Cash Flow | | $ | 1,192 | | | $ | 674 | |
| | | | | | | |
| Revenue | | $ | 9,483 | | | $ | 8,866 | |
| Free Cash Flow Margin | | | 12.6 | % | | | 7.6 | % |
| | |
WILLIS TOWERS WATSON PUBLIC LIMITED COMPANY
Condensed Consolidated Statements of Income
(In millions of U.S. dollars, except per share data)
(Unaudited) | |
| | |
| | | Three Months Ended
December 31, | | | Years Ended
December 31, | |
| | | 2023 | | | 2022 | | | 2023 | | | 2022 | |
| Revenue | | $ | 2,914 | | | $ | 2,722 | | | $ | 9,483 | | | $ | 8,866 | |
| | | | | | | | | | | | | |
| Costs of providing services | | | | | | | | | | | | |
| Salaries and benefits | | | 1,325 | | | | 1,263 | | | | 5,344 | | | | 5,065 | |
| Other operating expenses | | | 533 | | | | 513 | | | | 1,815 | | | | 1,776 | |
| Depreciation | | | 58 | | | | 64 | | | | 242 | | | | 255 | |
| Amortization | | | 60 | | | | 73 | | | | 263 | | | | 312 | |
| Restructuring costs | | | 38 | | | | 28 | | | | 68 | | | | 99 | |
| Transaction and transformation | | | 121 | | | | 73 | | | | 386 | | | | 181 | |
| Total costs of providing services | | | 2,135 | | | | 2,014 | | | | 8,118 | | | | 7,688 | |
| | | | | | | | | | | | | |
| Income from operations | | | 779 | | | | 708 | | | | 1,365 | | | | 1,178 | |
| | | | | | | | | | | | | |
| Interest expense | | | (63 | ) | | | (54 | ) | | | (235 | ) | | | (208 | ) |
| Other income, net | | | 23 | | | | 83 | | | | 149 | | | | 288 | |
| | | | | | | | | | | | | |
| INCOME FROM CONTINUING OPERATIONS BEFORE INCOME TAXES | | 739 | | | | 737 | | | | 1,279 | | | | 1,258 | |
| | | | | | | | | | | | | |
| Provision for income taxes | | | (116 | ) | | | (131 | ) | | | (215 | ) | | | (194 | ) |
| | | | | | | | | | | | | |
| INCOME FROM CONTINUING OPERATIONS | | | 623 | | | | 606 | | | | 1,064 | | | | 1,064 | |
| | | | | | | | | | | | | |
| LOSS FROM DISCONTINUED OPERATIONS, NET OF TAX | | | — | | | | (13 | ) | | | — | | | | (40 | ) |
| | | | | | | | | | | | | |
| NET INCOME | | 623 | | | | 593 | | | | 1,064 | | | | 1,024 | |
| | | | | | | | | | | | | |
| Income attributable to non-controlling interests | | | (1 | ) | | | (5 | ) | | | (9 | ) | | | (15 | ) |
| | | | | | | | | | | | | |
| NET INCOME ATTRIBUTABLE TO WTW | | $ | 622 | | | $ | 588 | | | $ | 1,055 | | | $ | 1,009 | |
| | | | | | | | | | | | | |
| EARNINGS PER SHARE | | | | | | | | | | | | |
| Basic earnings per share | | | | | | | | | | | | |
| Income from continuing operations per share | | $ | 6.02 | | | $ | 5.54 | | | $ | 10.01 | | | $ | 9.36 | |
| Loss from discontinued operations per share | | | — | | | | (0.12 | ) | | | — | | | | (0.36 | ) |
| Basic earnings per share | | $ | 6.02 | | | $ | 5.42 | | | $ | 10.01 | | | $ | 9.00 | |
| Diluted earnings per share | | | | | | | | | | | | |
| Income from continuing operations per share | | $ | 5.97 | | | $ | 5.52 | | | $ | 9.95 | | | $ | 9.34 | |
| Loss from discontinued operations per share | | | — | | | | (0.12 | ) | | | — | | | | (0.36 | ) |
| Diluted earnings per share | | $ | 5.97 | | | $ | 5.40 | | | $ | 9.95 | | | $ | 8.98 | |
| | | | | | | | | | | | | |
| Weighted-average ordinary shares, basic | | | 103 | | | | 108 | | | | 105 | | | | 112 | |
| Weighted-average ordinary shares, diluted | | | 104 | | | | 109 | | | | 106 | | | | 112 | |
| | |
WILLIS TOWERS WATSON PUBLIC LIMITED COMPANY
Condensed Consolidated Balance Sheets
(In millions of U.S. dollars, except share data)
(Unaudited) | |
| | |
| | | December 31, | | | December 31, | |
| | | 2023 | | | 2022 | |
| ASSETS | | | | | | |
| Cash and cash equivalents | | $ | 1,424 | | | $ | 1,262 | |
| Fiduciary assets | | | 9,073 | | | | 11,772 | |
| Accounts receivable, net | | | 2,572 | | | | 2,387 | |
| Prepaid and other current assets | | | 364 | | | | 414 | |
| Total current assets | | | 13,433 | | | | 15,835 | |
| Fixed assets, net | | | 720 | | | | 718 | |
| Goodwill | | | 10,195 | | | | 10,173 | |
| Other intangible assets, net | | | 2,016 | | | | 2,273 | |
| Right-of-use assets | | | 565 | | | | 586 | |
| Pension benefits assets | | | 588 | | | | 827 | |
| Other non-current assets | | | 1,573 | | | | 1,357 | |
| Total non-current assets | | | 15,657 | | | | 15,934 | |
| TOTAL ASSETS | | $ | 29,090 | | | $ | 31,769 | |
| LIABILITIES AND EQUITY | | | | | | |
| Fiduciary liabilities | | $ | 9,073 | | | $ | 11,772 | |
| Deferred revenue and accrued expenses | | | 2,104 | | | | 1,915 | |
| Current debt | | | 650 | | | | 250 | |
| Current lease liabilities | | | 125 | | | | 126 | |
| Other current liabilities | | | 678 | | | | 716 | |
| Total current liabilities | | | 12,630 | | | | 14,779 | |
| Long-term debt | | | 4,567 | | | | 4,471 | |
| Liability for pension benefits | | | 563 | | | | 480 | |
| Deferred tax liabilities | | | 542 | | | | 748 | |
| Provision for liabilities | | | 365 | | | | 357 | |
| Long-term lease liabilities | | | 592 | | | | 620 | |
| Other non-current liabilities | | | 238 | | | | 221 | |
| Total non-current liabilities | | | 6,867 | | | | 6,897 | |
| TOTAL LIABILITIES | | | 19,497 | | | | 21,676 | |
| COMMITMENTS AND CONTINGENCIES | | | | | | |
| EQUITY(i) | | | | | | |
| Additional paid-in capital | | | 10,910 | | | | 10,876 | |
| Retained earnings | | | 1,466 | | | | 1,764 | |
| Accumulated other comprehensive loss, net of tax | | | (2,856 | ) | | | (2,621 | ) |
| Treasury shares, at cost, 17,519 shares in 2022 | | | — | | | | (3 | ) |
| Total WTW shareholders' equity | | | 9,520 | | | | 10,016 | |
| Non-controlling interests | | | 73 | | | | 77 | |
| Total Equity | | | 9,593 | | | | 10,093 | |
| TOTAL LIABILITIES AND EQUITY | | $ | 29,090 | | | $ | 31,769 | |
_____________
(i) Equity includes (a) Ordinary shares $0.000304635 nominal value; Authorized 1,510,003,775; Issued 102,538,072 (2023) and 106,756,364 (2022); Outstanding 102,538,072 (2023) and 106,756,364 (2022) and (b) Preference shares, $0.000115 nominal value; Authorized 1,000,000,000 and Issued none in 2023 and 2022.
| | |
WILLIS TOWERS WATSON PUBLIC LIMITED COMPANY
Condensed Consolidated Statements of Cash Flows
(In millions of U.S. dollars)
(Unaudited) | |
| | |
| | | Years Ended December 31, | |
| | | 2023 | | | 2022 | |
| CASH FLOWS FROM OPERATING ACTIVITIES | | | | | | |
| NET INCOME | | $ | 1,064 | | | $ | 1,024 | |
| Adjustments to reconcile net income to total net cash from operating activities: | | | | | | |
| Depreciation | | | 242 | | | | 255 | |
| Amortization | | | 263 | | | | 312 | |
| Impairment | | | — | | | | 81 | |
| Non-cash restructuring charges | | | 38 | | | | 71 | |
| Non-cash lease expense | | | 105 | | | | 120 | |
| Net periodic benefit of defined benefit pension plans | | | (26 | ) | | | (153 | ) |
| Provision for doubtful receivables from clients | | | 6 | | | | 13 | |
| Benefit from deferred income taxes | | | (109 | ) | | | (50 | ) |
| Share-based compensation | | | 125 | | | | 99 | |
| Net (gain)/loss on disposal of operations | | | (43 | ) | | | 59 | |
| Non-cash foreign exchange loss/(gain) | | | 20 | | | | (137 | ) |
| Other, net | | | 31 | | | | 6 | |
| Changes in operating assets and liabilities, net of effects from purchase of subsidiaries: | | | | | | |
| Accounts receivable | | | (206 | ) | | | (188 | ) |
| Other assets | | | (185 | ) | | | (197 | ) |
| Other liabilities | | | 16 | | | | (495 | ) |
| Provisions | | | 4 | | | | (8 | ) |
| Net cash from operating activities | | | 1,345 | | | | 812 | |
| | | | | | | |
| CASH FLOWS USED IN INVESTING ACTIVITIES | | | | | | |
| Additions to fixed assets and software for internal use | | | (153 | ) | | | (138 | ) |
| Capitalized software costs | | | (89 | ) | | | (66 | ) |
| Acquisitions of operations, net of cash acquired | | | (6 | ) | | | (81 | ) |
| Net proceeds/(payments) from sale of operations | | | 89 | | | | (59 | ) |
| Cash and fiduciary funds transferred in sale of operations | | | (922 | ) | | | (29 | ) |
| (Purchase)/sale of investments | | | (4 | ) | | | 200 | |
| Net cash used in investing activities | | | (1,085 | ) | | | (173 | ) |
| | | | | | | |
| CASH FLOWS USED IN FINANCING ACTIVITIES | | | | | | |
| Senior notes issued | | | 748 | | | | 750 | |
| Debt issuance costs | | | (7 | ) | | | (5 | ) |
| Repayments of debt | | | (254 | ) | | | (585 | ) |
| Repurchase of shares | | | (1,000 | ) | | | (3,530 | ) |
| Proceeds from issuance of shares | | | — | | | | 7 | |
| Net (payments)/proceeds from fiduciary funds held for clients | | | (234 | ) | | | 354 | |
| Payments of deferred and contingent consideration related to acquisitions | | | (12 | ) | | | (22 | ) |
| Cash paid for employee taxes on withholding shares | | | (26 | ) | | | (34 | ) |
| Dividends paid | | | (352 | ) | | | (369 | ) |
| Acquisitions of and dividends paid to non-controlling interests | | | (63 | ) | | | (11 | ) |
| Net cash used in financing activities | | | (1,200 | ) | | | (3,445 | ) |
| | | | | | | |
| DECREASE IN CASH, CASH EQUIVALENTS AND RESTRICTED CASH | | | (940 | ) | | | (2,806 | ) |
| Effect of exchange rate changes on cash, cash equivalents and restricted cash | | | 11 | | | | (164 | ) |
| CASH, CASH EQUIVALENTS AND RESTRICTED CASH, BEGINNING OF PERIOD (i) | | | 4,721 | | | | 7,691 | |
| CASH, CASH EQUIVALENTS AND RESTRICTED CASH, END OF PERIOD (i) | | $ | 3,792 | | | $ | 4,721 | |
_____________
(i) The amounts of cash, cash equivalents and restricted cash, their respective classification on the condensed consolidated balance sheets, as well as their respective portions of the increase or decrease in cash, cash equivalents and restricted cash for each of the periods presented have been included in the Supplemental Disclosures of Cash Flow Information section.
SUPPLEMENTAL DISCLOSURES OF CASH FLOW INFORMATION
| | | Years Ended December 31, | |
| | | | 2023 | | | | 2022 | |
| Supplemental disclosures of cash flow information: | | | | | | |
| Cash and cash equivalents | | $ | 1,424 | | | $ | 1,262 | |
| Fiduciary funds (included in fiduciary assets) | | | 2,368 | | | | 3,459 | |
| Total cash, cash equivalents and restricted cash | | $ | 3,792 | | | $ | 4,721 | |
| | | | | | | |
| Increase/(decrease) in cash, cash equivalents and other restricted cash | | $ | 163 | | | $ | (3,177 | ) |
| (Decrease)/increase in fiduciary funds | | | (1,103 | ) | | | 371 | |
| Total (i) | | $ | (940 | ) | | $ | (2,806 | ) |
(i) Does not include the effect of exchange rate changes on cash, cash equivalents and restricted cash.
Exhibit 99.2

WT Earning 2023 Fou February 6, 2 W s Release
Supplemental Materials rth Quarter and Full Year Financial Results 024 wtwco.com © 2024 WTW. All rights reserved.
wtwco.com © 2024 WTW. All rights reserved.
WTW Forward - Looking Statements This document contains ‘forward - looking statements’ within the meaning of Section 27A of
the Securities Act of 1933, and Section 21E of the Securities Exchange Act of 1934, which are intended to be covered by the safe harbors
created by those laws. These forward - looking statements include information about possible or assumed future results of our operations.
All statements, other than statements of historical facts, that address activities, events, or developments that we expect or anticipate
may occur in the future, including such things as our outlook, the potential impact of natural or man - made disasters like health pandemics
and other world health crises; future capital expenditures; ongoing working capital efforts; future share repurchases; financial results
(including our revenue, costs, or margins) and the impact of changes to tax laws on our financial results; existing and evolving business
strategies and acquisitions and dispositions, including our completed sale of Willis Re to Arthur J. Gallagher & Co. (‘Gallagher’)
and transitional arrangements related thereto; demand for our services and competitive strengths; strategic goals; the benefits of new
initiatives; growth of our business and operations; the sustained health of our product, service, transaction, client, and talent assessment
and management pipelines; our ability to successfully manage ongoing leadership, organizational and technology changes, including investments
in improving systems and processes; our ability to implement and realize anticipated benefits of any cost - savings initiatives including
the multi - year operational Transformation program; our recognition of future impairment charges; and plans and references to future
successes, including our future financial and operating results, short - term and long - term financial goals, plans, objectives, expectations
and intentions are forward - looking statements including with respect to free cash flow generation, adjusted net revenue, adjusted operating
margin, and adjusted earnings per share. Also, when we use words such as ‘may’, ‘will’, ‘would’, ‘anticipate’,
‘believe’, ‘estimate’, ‘expect’, ‘intend’, ‘plan’, ‘continues’,
‘seek’, ‘target’, ‘goal’, ‘focus’, ‘probably’, or similar expressions, we
are making forward - looking statements. Such statements are based upon the current beliefs and expectations of the Company’s management
and are subject to significant risks and uncertainties. Actual results may differ from those set forth in the forward - looking statements.
All forward - looking disclosure is speculative by its nature. There are important risks, uncertainties, events and factors that could
cause our actual results or performance to differ materially from those in the forward - looking statements contained in this document,
including the following[A1] : our ability to successfully establish, execute and achieve our global business strategy as it evolves; our
ability to fully realize anticipated benefits of our growth strategy; our ability to achieve our short - term and long - term financial
goals, such as with respect to our cash flow generation, and the timing with respect to such achievement; the risks related to changes
in general economic (including a possible recession), business and political conditions, including changes in the financial markets, inflation,
credit availability, increased interest rates and trade policies; the risks to our short - term and long - term financial goals from any
of the risks or uncertainties set forth herein; the risks relating to the adverse impacts of macroeconomic trends, including inflation,
changes in interest rates and trade policies, as well as political events, trade and other international disputes, war, such as the Russia
- Ukraine and Israel - Hamas wars, terrorism, natural disasters, public health issues and other business interruptions on the global economy
and capital markets, which could have a material adverse effect on our business, financial condition, results of operations, and long
- term goals; the risks associated with our withdrawal from our high margin businesses in Russia and our ability to achieve cost - mitigation
measures; our ability to successfully hedge against fluctuations in foreign currency rates; the risks relating to the adverse impacts
of natural or man - made disasters like health pandemics and other world health crises, on the demand for our products and services, our
cash flows and our business operations; material interruptions to or loss of our information processing capabilities, or failure to effectively
maintain and upgrade our information technology resources and systems and related risks of cybersecurity breaches or incidents; our ability
to comply with complex and evolving regulations related to data privacy, cybersecurity and artificial intelligence; the risks relating
to the transitional arrangements in effect subsequent to our now - completed sale of Willis Re to Gallagher; significant competition that
we face and the potential for loss of market share and/or profitability; the impact of seasonality and differences in timing of renewals
and non - recurring revenue increases from disposals and book - of - business sales; the failure to protect client data or breaches of
information systems or insufficient safeguards against cybersecurity breaches or incidents; the risk of increased liability or new legal
claims arising from our new and existing products and services, and expectations, intentions and outcomes relating to outstanding litigation;
the risk of substantial negative outcomes on existing litigation or investigation matters; changes in the regulatory environment in which
we operate, including, among other risks, the impacts of pending competition law and regulatory investigations; various claims, government
inquiries or investigations or the potential for regulatory action; our ability to make divestitures or acquisitions, including our ability
to integrate or manage such acquired businesses, as well as identify and successfully execute on opportunities for strategic collaboration;
our ability to integrate direct - to - consumer sales and marketing solutions with our existing offerings and solutions; our ability to
successfully manage ongoing organizational changes, including investments in improving systems and processes; disasters or business continuity
problems; the ongoing impact of Brexit on our business and operations; our ability to properly identify and manage conflicts of interest;
reputational damage, including from association with third parties; reliance on third - party service providers and suppliers; risks relating
to changes in our management structures and in senior leadership; the loss of key employees or a large number of employees and rehiring
rates; our ability to maintain our corporate culture; doing business internationally, including the impact of foreign currency exchange
rates; compliance with extensive government regulation; the risk of sanctions imposed by governments, or changes to associated sanction
regulations (such as sanctions imposed on Russia) and related counter - sanctions; our ability to effectively apply technology, data and
analytics changes for internal operations, maintaining industry standards and meeting client preferences; changes and developments in
the insurance industry or the U.S. healthcare system, including those related to Medicare and any legislative actions from the current
U.S. Congress, and any other changes and developments in legal, economic, business or operational conditions impacting our Medicare benefits
businesses such as TRANZACT; the inability to protect our intellectual property rights, or the potential infringement upon the intellectual
property rights of others; fluctuations in our pension assets and liabilities and related changes in pension income, including as a result
of, related to, or derived from movements in the interest rate environment, investment returns, inflation, or changes in other assumptions
that are used to estimate our benefit obligations and its effect on adjusted earnings per share; our capital structure, including indebtedness
amounts, the limitations imposed by the covenants in the documents governing such indebtedness and the maintenance of the financial and
disclosure controls and procedures of each; our ability to obtain financing on favorable terms or at all; adverse changes in our credit
ratings; the impact of recent or potential changes to U.S. or foreign laws, and the enactment of additional, or the revision of existing,
state, federal, and/or foreign laws and regulations, recent judicial decisions and development of case law, other regulations and any
policy changes and legislative actions, including those that impact our effective tax rate; U.S. federal income tax consequences to U.S.
persons owning at least 10% of our shares; changes in accounting principles, estimates or assumptions; our recognition of future impairment
charges; risks relating to or arising from environmental, social and governance (‘ESG’) practices; fluctuation in revenue
against our relatively fixed or higher than expected expenses; the risk that investment levels, including cash spending, to achieve additional
transformation savings increase; the laws of Ireland being different from the laws of the U.S. and potentially affording less protections
to the holders of our securities; and our holding company structure potentially preventing us from being able to receive dividends or
other distributions in needed amounts from our subsidiaries. The foregoing list of factors is not exhaustive and new factors may emerge
from time to time that could also affect actual performance and results. For more information, please see Part I, Item 1A in our Annual
Report on Form 10 - K, and our subsequent filings with the SEC. Copies are available online at www.sec.gov or www.wtwco.com. Although
we believe that the assumptions underlying our forward - looking statements are reasonable, any of these assumptions, and therefore also
the forward - looking statements based on these assumptions, could themselves prove to be inaccurate. Given the significant uncertainties
inherent in the forward - looking statements included in this document, our inclusion of this information is not a representation or guarantee
by us that our objectives and plans will be achieved. Our forward - looking statements speak only as of the date made, and we will not
update these forward - looking statements unless the securities laws require us to do so. With regard to these risks, uncertainties and
assumptions, the forward - looking events discussed in this document may not occur, and we caution you against unduly relying on these
forward - looking statements. 2
WTW Non - GAAP Measures wtwco.com ©
2024 WTW. All rights reserved. See “WTW Forward - Looking Statements“ above for information about forward - looking statements
and cautionary language, including how actual results may differ materially from those in the slide presentation. 3 In order to assist
readers of our consolidated financial statements in understanding the core operating results that WTW’s management uses to evaluate
the business and for financial planning, we present the following non - GAAP measures: (1) Constant Currency Change, (2) Organic Change,
(3) Adjusted Operating Income/Margin, (4) Adjusted EBITDA/Margin, (5) Adjusted Net Income, (6) Adjusted Diluted Earnings Per Share, (7)
Adjusted Income Before Taxes, (8) Adjusted Income Taxes/Tax Rate and (9) Free Cash Flow. The Company believes that these measures are
relevant and provide useful information widely used by analysts, investors and other interested parties in our industry to provide a baseline
for evaluating and comparing our operating performance, and in the case of free cash flow, our liquidity results. Reconciliations of these
measures are included in the accompanying appendix of these earning release supplemental materials. The Company does not reconcile its
forward - looking non - GAAP financial measures to the corresponding U.S. GAAP measures, due to variability and difficulty in making accurate
forecasts and projections and/or certain information not being ascertainable or accessible; and because not all of the information, such
as foreign currency impacts necessary for a quantitative reconciliation of these forward - looking non - GAAP financial measures to the
most directly comparable U.S. GAAP financial measure, is available to the Company without unreasonable efforts. For the same reasons,
the Company is unable to address the probable significance of the unavailable information. The Company provides non - GAAP financial measures
that it believes will be achieved, however it cannot accurately predict all of the components of the adjusted calculations and the U.S.
GAAP measures may be materially different than the non - GAAP measures.
Organic revenue growth 1 of 6% in Q4 - 23
and 8% for full year 2023, and Adjusted Operating Margin 1 expansion of +180 bps in Q4 - 23 and +110 bps for full year 2023 Continued
to make significant progress on strategic priorities Realized $37 million of incremental annualized savings in Q4 - 23, bringing the total
to $337 million since the Transformation Program inception Continued to return capital to shareholders, with share repurchases of $1 billion
and dividends of $352 million for full year 2023 Remain focused on delivering our 2024 financial targets Key Takeaways 1 Signifies Non
- GAAP financial measures. See appendix for Non - GAAP reconciliations. wtwco.com © 2024 WTW. All rights reserved. See “WTW
Forward - Looking Statements“ above for information about forward - looking statements and cautionary language, including how actual
results may differ materially from those in the slide presentation. 4
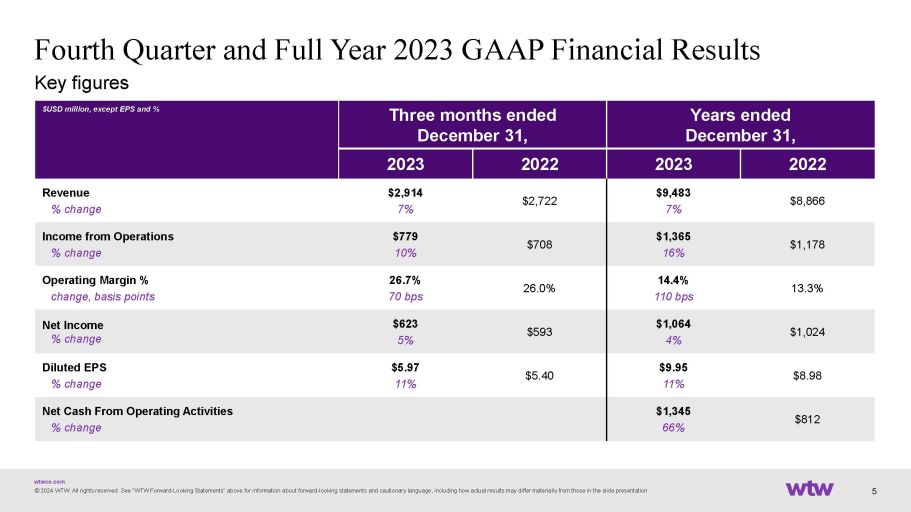
Fourth Quarter and Full Year 2023 GAAP Financial
Results Key figures wtwco.com © 2024 WTW. All rights reserved. See “WTW Forward - Looking Statements“ above for information
about forward - looking statements and cautionary language, including how actual results may differ materially from those in the slide
presentation. 5 Years ended December 31, Three months ended December 31, $USD million, except EPS and % 2022 2023 2022 2023 $8,866 $9,483
7% $2,722 $2,914 7% Revenue % change $1,178 $1,365 16% $708 $779 10% Income from Operations % change 13.3% 14.4% 110 bps 26.0% 26.7% 70
bps Operating Margin % change, basis points $1,024 $1,064 4% $593 $623 5% Net Income % change $8.98 $9.95 11% $5.40 $5.97 11% Diluted
EPS % change $812 $1,345 66% Net Cash From Operating Activities % change

Q4 2023 Key Figures, Including Non - GAAP
Financial Results Total Revenue +6% Q4 2023 Organic 1 +5% Q4 2022 Organic 1 Adjusted Diluted EPS 1 Q4 2023 Results Adjusted Operating
Margin 1 Transformation Program $37M of incremental run rate savings in Q4 2023 $2.9B Q4 2023 wtwco.com © 2024 WTW. All rights reserved.
See “WTW Forward - Looking Statements“ above for information about forward - looking statements and cautionary language, including
how actual results may differ materially from those in the slide presentation. 6 $7.44 Q4 2023 $6.33 Q4 2022 +18% Q4 2023 34.2% Q4 2023
+180 bps Q4 2023 +32.4% Q4 2022 1 Signifies Non - GAAP financial measures. See appendix for Non - GAAP reconciliations
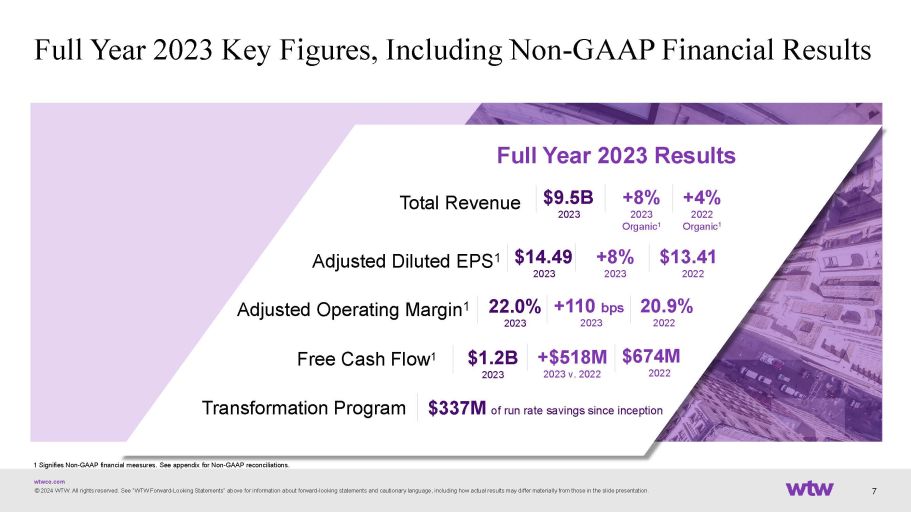
Full Year 2023 Key Figures, Including Non
- GAAP Financial Results Total Revenue +8% 2023 Organic 1 +4% 2022 Organic 1 Adjusted Diluted EPS 1 Full Year 2023 Results Adjusted Operating
Margin 1 Transformation Program $337M of run rate savings since inception Free Cash Flow 1 $9.5B 2023 $14.49 2023 $1.2B 2023 +8% $13.41
2023 2022 20.9% +110 bps 22.0% 2022 2023 2023 +$518M 2023 v. 2022 wtwco.com © 2024 WTW. All rights reserved. See “WTW Forward
- Looking Statements“ above for information about forward - looking statements and cautionary language, including how actual results
may differ materially from those in the slide presentation. 7 $674M 2022 1 Signifies Non - GAAP financial measures. See appendix for Non
- GAAP reconciliations.

Financial Review wtwco.com © 2024 WTW.
All rights reserved. See “WTW Forward - Looking Statements“ above for information about forward - looking statements and cautionary
language, including how actual results may differ materially from those in the slide presentation. 8

Segment Highlights • For the quarter,
HWC had organic revenue growth 1 of 4%. – Health had organic revenue growth with the continued expansion of our Global Benefits
Management client portfolio and increased brokerage income. Excluding a modest tailwind from book - of - business settlement revenue,
Health had organic revenue growth of 5%. – Wealth generated organic revenue growth from higher levels of Retirement work in North
America and Europe, along with new client acquisitions, pension brokerage and higher fees in Investments. – Career had organic revenue
growth from our compensation surveys and executive compensation, reward - based advisory and employee experience services. – BD&O
generated organic revenue growth driven with higher volumes and placements of Medicare Advantage and life policies in Individual Marketplace
and increased compliance and other project activity in Outsourcing. • Operating income was $729M in the quarter, an increase of
8% from the prior year. Operating margin increased 150 bps from the prior year primarily from Transformation savings. Quarterly Segment
Performance: Health, Wealth & Career Revenue ($M) $1,798 $1,722 Q4 - 23 Q4 - 22 Adjusted Operating Margin 1 40.5% 39.0% Q4 - 23 Q4
- 22 Q4 - 22 Q4 - 23 Organic Revenue Growth 1 0% 6% Health 5% 5% Wealth 9% 6% Career 6% 3% Benefits Delivery & Outsourcing (BD&O)
5% 4% Health, Wealth & Career 1 Signifies Non - GAAP financial measure. See appendix for Non - GAAP reconciliations. wtwco.com ©
2024 WTW. All rights reserved. See “WTW Forward - Looking Statements“ above for information about forward - looking statements
and cautionary language, including how actual results may differ materially from those in the slide presentation. 9

Segment Highlights • For the quarter,
R&B had organic revenue growth 1 of 12%. Book - of - business settlement revenue did not meaningfully impact organic revenue growth
for the quarter. – CRB generated solid organic revenue growth driven by strong new business, improved client retention and rate
increases. Book - of - business settlement revenue did not meaningfully impact organic revenue growth for the quarter. – ICT had
organic revenue growth from software sales and increased project revenue. • Operating income of $ 354 M in the quarter increased
by 32 % . • Operating margin improved by 460 bps due to higher operating leverage, driven by strong organic revenue growth and increased
productivity from recent hires, and Transformation savings . Quarterly Segment Performance: Risk & Broking Revenue ($M) $1,076 $952
Q4 - 23 Q4 - 22 Adjusted Operating Margin 1 32.9% 28.3% Q4 - 23 Q4 - 22 Q4 - 22 Q4 - 23 Organic Revenue Growth 1 3% 12% Corporate Risk
& Broking (CRB) 17% 8% Insurance Consulting & Technology (ICT) 5% 12% Risk & Broking 1 Signifies Non - GAAP financial measure.
See appendix for Non - GAAP reconciliations. wtwco.com © 2024 WTW. All rights reserved. See “WTW Forward - Looking Statements“
above for information about forward - looking statements and cautionary language, including how actual results may differ materially from
those in the slide presentation. 10

Transformation Program: Savings wtwco.com
© 2024 WTW. All rights reserved. See “WTW Forward - Looking Statements“ above for information about forward - looking
statements and cautionary language, including how actual results may differ materially from those in the slide presentation. 11 Projected
Cumulative From Inception Full Year 2023 ($ millions) $72 $27 Real Estate Rationalization $42 $42 Technology Modernization $223 $119 Process
Optimization ~$425 $337 $188 Total Savings Projected to generate $425 million of annualized savings through 2024 Delivering on our financial
commitments • Delivering $425 million of run - rate savings to contribute ~425 bps of margin improvement , while investing for growth,
up from $380 million previously • Realized $37 million of incremental annualized savings during the fourth quarter and $337 million
of annualized savings since program inception • Cumulative run - rate savings of $337M are primarily attributable to Process Optimization
as we focus on building an infrastructure from which to drive further efficiencies
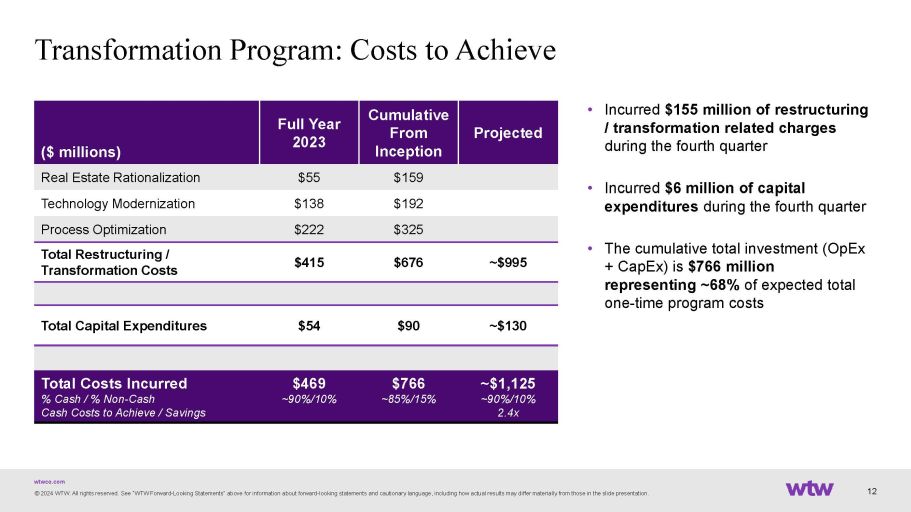
Transformation Program: Costs to Achieve Projected Cumulative
From Inception Full Year 2023 ($ millions) $159 $55 Real Estate Rationalization $192 $138 Technology Modernization $325 $222 Process
Optimization ~$995 $676 $415 Total Restructuring / Transformation Costs ~$130 $90 $54 Total Capital Expenditures ~$1,125 ~90%/10% 2.4x
$766 ~85%/15% $469 ~90%/10% Total Costs Incurred % Cash / % Non - Cash Cash Costs to Achieve / Savings • Incurred $155 million
of restructuring / transformation related charges during the fourth quarter • Incurred $6 million of capital expenditures during
the fourth quarter • The cumulative total investment (OpEx + CapEx) is $766 million representing ~68% of expected total one - time
program costs 12 wtwco.com © 2024 WTW. All rights reserved. See “WTW Forward - Looking Statements“ above for information
about forward - looking statements and cautionary language, including how actual results may differ materially from those in the slide
presentation.
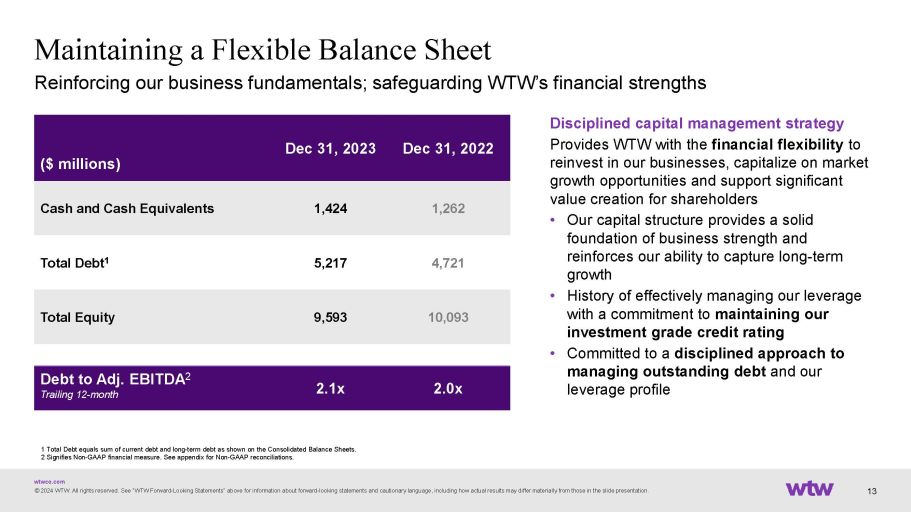
Maintaining a Flexible Balance Sheet wtwco.com
© 2024 WTW. All rights reserved. See “WTW Forward - Looking Statements“ above for information about forward - looking
statements and cautionary language, including how actual results may differ materially from those in the slide presentation. 13 1 Total
Debt equals sum of current debt and long - term debt as shown on the Consolidated Balance Sheets. 2 Signifies Non - GAAP financial measure.
See appendix for Non - GAAP reconciliations. Dec 31, 2022 Dec 31, 2023 ($ millions) 1,262 1,424 Cash and Cash Equivalents 4,721 5,217
Total Debt 1 10,093 9,593 Total Equity 2.0x 2.1x Debt to Adj. EBITDA 2 Trailing 12 - month Reinforcing our business fundamentals; safeguarding
WTW’s financial strengths Disciplined capital management strategy Provides WTW with the financial flexibility to reinvest in our
businesses, capitalize on market growth opportunities and support significant value creation for shareholders • Our capital structure
provides a solid foundation of business strength and reinforces our ability to capture long - term growth • History of effectively
managing our leverage with a commitment to maintaining our investment grade credit rating • Committed to a disciplined approach
to managing outstanding debt and our leverage profile
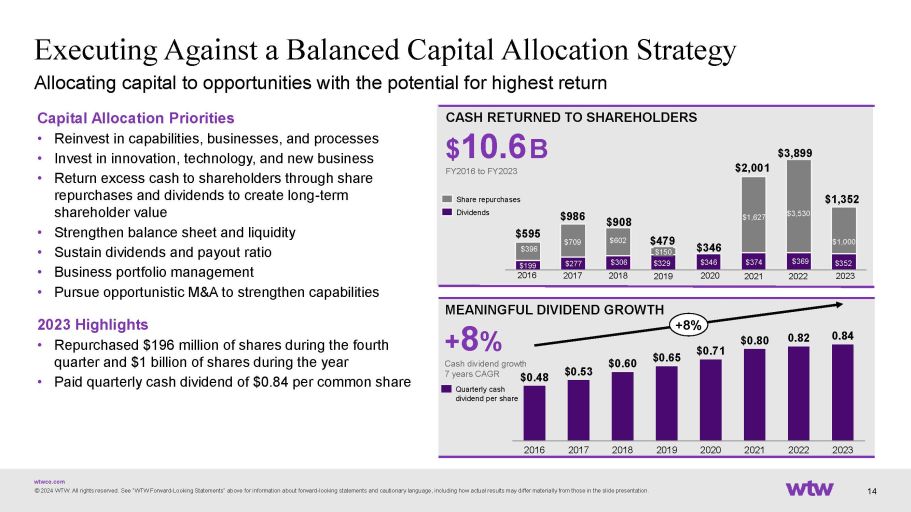
Executing Against a Balanced Capital Allocation
Strategy Allocating capital to opportunities with the potential for highest return CASH RETURNED TO SHAREHOLDERS $ 10.6 B FY2016 to FY2023
MEANINGFUL DIVIDEND GROWTH + 8 % Cash dividend growth $1,352 $1,000 $352 2017 2016 $346 $396 $277 2018 $199 $150 $709 $602 $306 2020 $329
2019 $1,627 $374 2021 $369 2022 $3,899 $595 $986 $908 $479 $346 $2,001 $3,530 Share repurchases Dividends 0.82 0.84 2020 2016 $0.65 2022
2021 2017 2018 $0.48 2019 2023 $0.71 $0.53 $0.60 $0.80 +8% 7 years CAGR Quarterly cash dividend per share wtwco.com © 2024 WTW. All
rights reserved. See “WTW Forward - Looking Statements“ above for information about forward - looking statements and cautionary
language, including how actual results may differ materially from those in the slide presentation. 14 Capital Allocation Priorities •
Reinvest in capabilities, businesses, and processes • Invest in innovation, technology, and new business • Return excess cash
to shareholders through share repurchases and dividends to create long - term shareholder value • Strengthen balance sheet and liquidity
• Sustain dividends and payout ratio • Business portfolio management • Pursue opportunistic M&A to strengthen capabilities
2023 Highlights • Repurchased $196 million of shares during the fourth quarter and $1 billion of shares during the year •
Paid quarterly cash dividend of $0.84 per common share 2023

Business Overview wtwco.com © 2024 WTW.
All rights reserved. See “WTW Forward - Looking Statements“ above for information about forward - looking statements and cautionary
language, including how actual results may differ materially from those in the slide presentation. 15
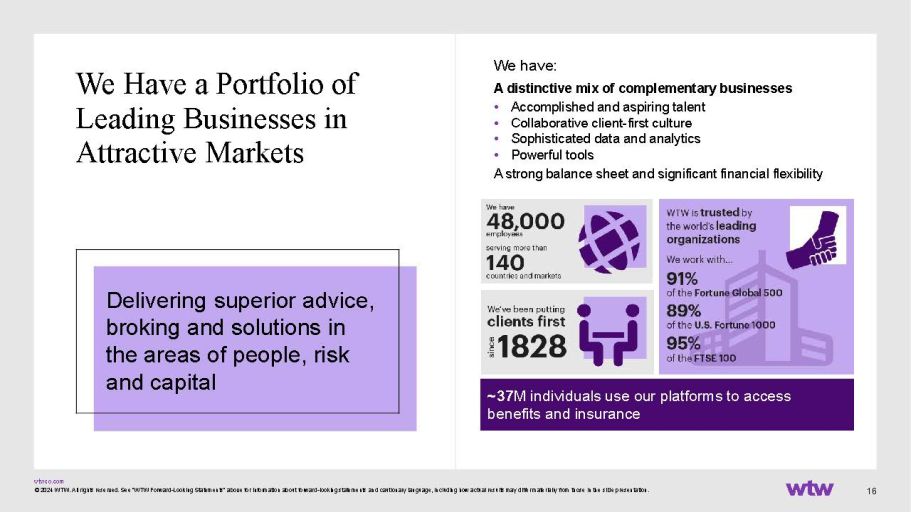
Delivering superior advice, broking and solutions
in the areas of people, risk and capital We Have a Portfolio of Leading Businesses in Attractive Markets We have: A distinctive mix of
complementary businesses • Accomplished and aspiring talent • Collaborative client - first culture • Sophisticated data
and analytics • Powerful tools A strong balance sheet and significant financial flexibility ~37 M individuals use our platforms
to access benefits and insurance wtwco.com © 2024 WTW. All rights reserved. See “WTW Forward - Looking Statements“ above
for information about forward - looking statements and cautionary language, including how actual results may differ materially from those
in the slide presentation. 16
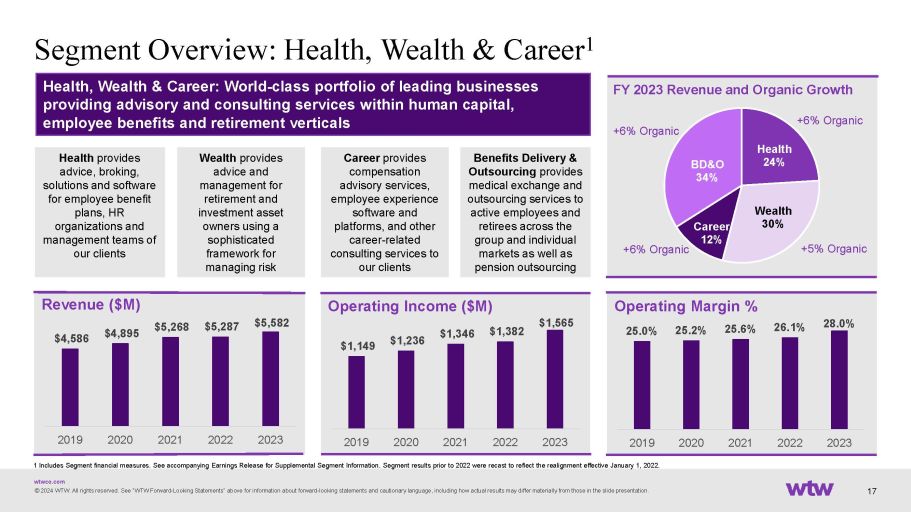
Segment Overview: Health, Wealth & Career
1 Revenue ($M) Operating Margin % Health, Wealth & Career: World - class portfolio of leading businesses providing advisory and consulting
services within human capital, employee benefits and retirement verticals Benefits Delivery & Outsourcing provides medical exchange
and outsourcing services to active employees and retirees across the group and individual markets as well as pension outsourcing Health
provides advice, broking, solutions and software for employee benefit plans, HR organizations and management teams of our clients Wealth
provides advice and management for retirement and investment asset owners using a sophisticated framework for managing risk Career provides
compensation advisory services, employee experience software and platforms, and other career - related consulting services to our clients
FY 2023 Revenue and Organic Growth Health 24% Wealth 30% Career 12% BD&O 34% +6% Organic +6% Organic $4,586 $4,895 $5,268 $5,287 $5,582
$1,149 $1,236 $1,346 Operating Income ($M) $1,382 $1,565 25.0% 25.2% 2019 2020 2021 2022 2023 2019 2020 2021 2022 2023 2019 2020 2021
2022 2023 1 Includes Segment financial measures. See accompanying Earnings Release for Supplemental Segment Information. Segment results
prior to 2022 were recast to reflect the realignment effective January 1, 2022. wtwco.com © 2024 WTW. All rights reserved. See “WTW
Forward - Looking Statements“ above for information about forward - looking statements and cautionary language, including how actual
results may differ materially from those in the slide presentation. 17 25.6% 26.1% 28.0% +6% Organic +5% Organic
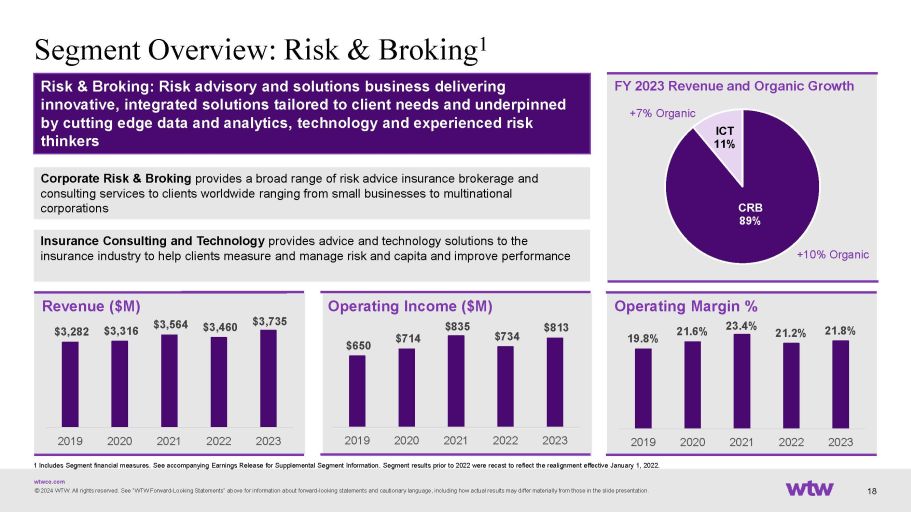
Segment Overview: Risk & Broking 1 Risk
& Broking: Risk advisory and solutions business delivering innovative, integrated solutions tailored to client needs and underpinned
by cutting edge data and analytics, technology and experienced risk thinkers Insurance Consulting and Technology provides advice and technology
solutions to the insurance industry to help clients measure and manage risk and capita and improve performance Corporate Risk & Broking
provides a broad range of risk advice insurance brokerage and consulting services to clients worldwide ranging from small businesses to
multinational corporations Revenue ($M) $3,282 $3,316 FY 2023 Revenue and Organic Growth +7% Organic ICT 11% CRB 89% +10% Organic 2019
2020 2021 2022 2023 2019 2020 2021 2022 2023 2019 2020 2021 2022 2023 1 Includes Segment financial measures. See accompanying Earnings
Release for Supplemental Segment Information. Segment results prior to 2022 were recast to reflect the realignment effective January 1,
2022. wtwco.com © 2024 WTW. All rights reserved. See “WTW Forward - Looking Statements“ above for information about forward
- looking statements and cautionary language, including how actual results may differ materially from those in the slide presentation.
18 $3,564 $3,460 $3,735 $650 $714 Operating Income ($M) $835 $734 $813 19.8% 21.6% Operating Margin % 23.4% 21.2% 21.8%
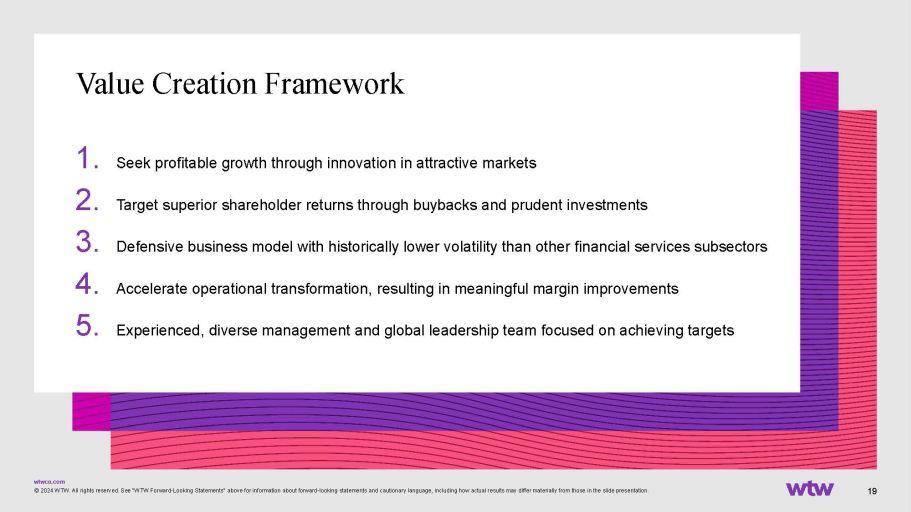
Value Creation Framework wtwco.com ©
2024 WTW. All rights reserved. See “WTW Forward - Looking Statements“ above for information about forward - looking statements
and cautionary language, including how actual results may differ materially from those in the slide presentation. 19 1. Seek profitable
growth through innovation in attractive markets 2. Target superior shareholder returns through buybacks and prudent investments 3. Defensive
business model with historically lower volatility than other financial services subsectors 4. Accelerate operational transformation, resulting
in meaningful margin improvements 5. Experienced, diverse management and global leadership team focused on achieving targets

Strategy & Outlook wtwco.com © 2024
WTW. All rights reserved. See “WTW Forward - Looking Statements“ above for information about forward - looking statements
and cautionary language, including how actual results may differ materially from those in the slide presentation. 20
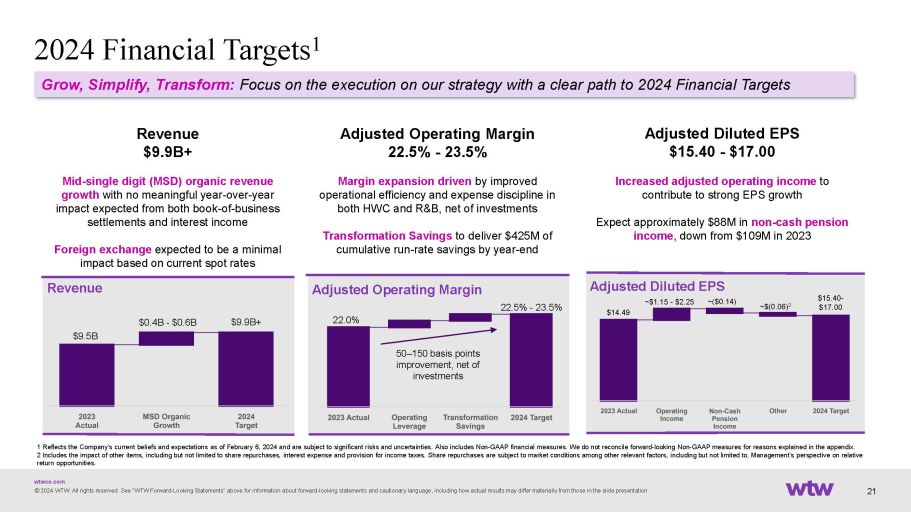
2024 Financial Targets 1 1 Reflects the Company’s
current beliefs and expectations as of February 6, 2024 and are subject to significant risks and uncertainties. Also includes Non - GAAP
financial measures. We do not reconcile forward - looking Non - GAAP measures for reasons explained in the appendix. 2 Includes the impact
of other items, including but not limited to share repurchases, interest expense and provision for income taxes. Share repurchases are
subject to market conditions among other relevant factors, including but not limited to, Management’s perspective on relative return
opportunities. $15.40 - $17.00 ~$(0.06) 2 Adjusted Diluted EPS ~$1.15 - $2.25 ~($0.14) $14.49 Adjusted Operating Margin 22.5% - 23.5%
22.0% 50 – 150 basis points improvement, net of investments $9.5B $0.4B - $0.6B $9.9B+ Foreign exchange expected to be a minimal
impact based on current spot rates Revenue Grow, Simplify, Transform: Focus on the execution on our strategy with a clear path to 2024
Financial Targets Revenue $9.9B+ Mid - single digit (MSD) organic revenue growth with no meaningful year - over - year impact expected
from both book - of - business settlements and interest income Adjusted Operating Margin 22.5% - 23.5% Margin expansion driven by improved
operational efficiency and expense discipline in both HWC and R&B, net of investments Transformation Savings to deliver $425M of cumulative
run - rate savings by year - end Adjusted Diluted EPS $15.40 - $17.00 Increased adjusted operating income to contribute to strong EPS
growth Expect approximately $88M in non - cash pension income , down from $109M in 2023 wtwco.com © 2024 WTW. All rights reserved.
See “WTW Forward - Looking Statements“ above for information about forward - looking statements and cautionary language, including
how actual results may differ materially from those in the slide presentation. 21

Free Cash Flow Margin Expectations •
Adjusted operating margin expansion • Improvement in TRANZACT Free Cash Flow profile driven by maturation of the business and product
mix • Non - recurrence of prior year headwinds • Headwind from incremental cash investment in Transformation Program 2022
7.6% 16%+ 12.6% Free Cash Flow Margin 2023 Long Term • Expect incremental improvement in 2024 Adjusted operating margin expansion
Additional improvement in TRANZACT Free Cash Flow profile ; expected to be cash flow positive in the near term • Headwind from cash
investment in 2024 in HWC & R&B for product development to support future growth Cash investment in Transformation will subside
after 2024 Remain focused on other levers to improve Free Cash Flow, including improved working capital 2024 and Beyond: wtwco.com ©
2024 WTW. All rights reserved. See “WTW Forward - Looking Statements“ above for information about forward - looking statements
and cautionary language, including how actual results may differ materially from those in the slide presentation. 22
Appendix: Reconciliation of Non - GAAP Measures
wtwco.com © 2024 WTW. All rights reserved. See “WTW Forward - Looking Statements“ above for information about forward
- looking statements and cautionary language, including how actual results may differ materially from those in the slide presentation.
23
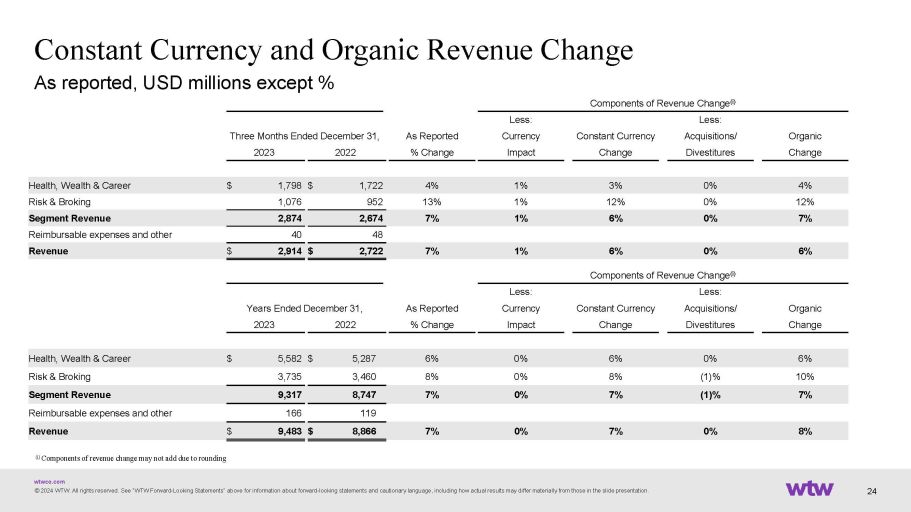
Constant Currency and Organic Revenue Change
As reported, USD millions except % Components of Revenue Change (i) Less: Less: Organic Acquisitions/ Constant Currency Currency As Reported
Three Months Ended December 31, Change Divestitures Change Impact % Change 2022 2023 4% 0% 3% 1% 4% 1,722 $ 1,798 $ Health, Wealth &
Career 12% 0% 12% 1% 13% 952 1,076 Risk & Broking 7% 0% 6% 1% 7% 2,674 2,874 Segment Revenue 48 40 Reimbursable expenses and other
6% 0% 6% 1% 7% 2,722 $ 2,914 $ Revenue (i) Components of revenue change may not add due to rounding Components of Revenue Change (i) Less:
Less: Organic Acquisitions/ Constant Currency Currency As Reported Years Ended December 31, Change Divestitures Change Impact % Change
2022 2023 6% 0% 6% 0% 6% 5,287 $ 5,582 $ Health, Wealth & Career 10% (1)% 8% 0% 8% 3,460 3,735 Risk & Broking 7% (1)% 7% 0% 7%
8,747 9,317 Segment Revenue 119 166 Reimbursable expenses and other 8% 0% 7% 0% 7% 8,866 $ 9,483 $ Revenue wtwco.com © 2024 WTW.
All rights reserved. See “WTW Forward - Looking Statements“ above for information about forward - looking statements and cautionary
language, including how actual results may differ materially from those in the slide presentation. 24

Adjusted Op Income and Margin, Adj. EBITDA
and Margin QTD As reported, USD millions except % Three Months Ended December 31, 2022 2023 % 26.0 708 $ % 26.7 779 $ Income from operations
and Operating margin Adjusted for certain items: 73 60 Amortization 28 38 Restructuring costs 73 121 Transaction and transformation %
32.4 882 $ % 34.2 998 $ Adjusted operating income and Adjusted operating income margin Three Months Ended December 31, 2022 2023 % 21.8
593 $ % 21.4 623 $ Net Income 13 — Loss from discontinued operations, net of tax 131 116 Provision for income taxes 54 63 Interest
expense 64 58 Depreciation 73 60 Amortization 28 38 Restructuring costs 73 121 Transaction and transformation (18) 1 Loss/(gain) on disposal
of operations % 37.1 1,011 $ % 37.1 1,080 $ Adjusted EBITDA and Adjusted EBITDA Margin wtwco.com © 2024 WTW. All rights reserved.
See “WTW Forward - Looking Statements“ above for information about forward - looking statements and cautionary language, including
how actual results may differ materially from those in the slide presentation. 25
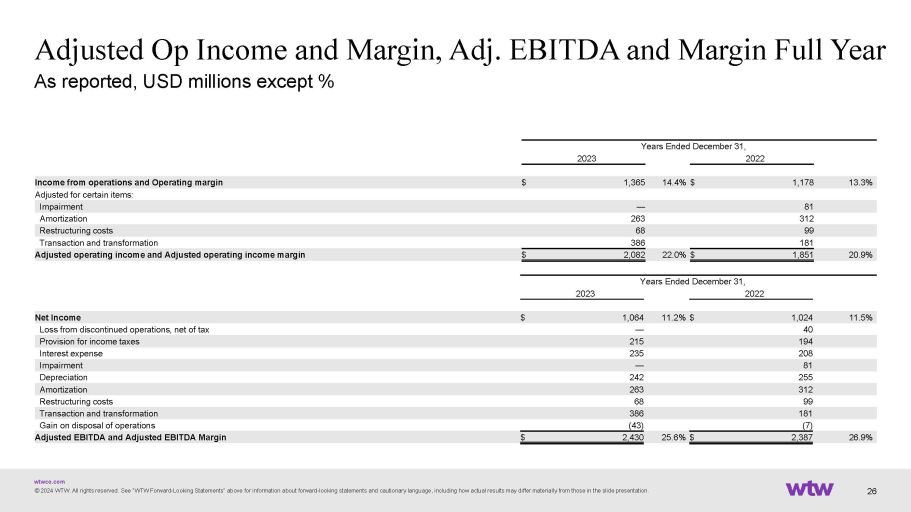
Adjusted Op Income and Margin, Adj. EBITDA
and Margin Full Year As reported, USD millions except % Years Ended December 31, 2022 2023 % 13.3 1,178 $ % 14.4 1,365 $ Income from operations
and Operating margin Adjusted for certain items: 81 — Impairment 312 263 Amortization 99 68 Restructuring costs 181 386 Transaction
and transformation % 20.9 1,851 $ % 22.0 2,082 $ Adjusted operating income and Adjusted operating income margin Years Ended December 31,
2022 2023 % 11.5 1,024 $ % 11.2 1,064 $ Net Income 40 — Loss from discontinued operations, net of tax 194 215 Provision for income
taxes 208 235 Interest expense 81 — Impairment 255 242 Depreciation 312 263 Amortization 99 68 Restructuring costs 181 386 Transaction
and transformation (7) (43) Gain on disposal of operations % 26.9 2,387 $ % 25.6 2,430 $ Adjusted EBITDA and Adjusted EBITDA Margin wtwco.com
© 2024 WTW. All rights reserved. See “WTW Forward - Looking Statements“ above for information about forward - looking
statements and cautionary language, including how actual results may differ materially from those in the slide presentation. 26

Adjusted Net Income and Adjusted Diluted
EPS, QTD As reported, USD millions except % Three Months Ended December 31, 2022 2023 588 $ 622 $ Net Income attributable to WTW Adjusted
for certain items: 13 — Loss from discontinued operations, net of tax 73 60 Amortization 28 38 Restructuring costs 73 121 Transaction
and transformation (18) 1 Loss/(gain) on disposal of operations (72) (67) Tax effect on certain items listed above (i) 4 — Tax effect
of internal reorganizations 689 $ 775 $ Adjusted Net Income 109 104 Weighted - average ordinary shares, diluted 5.40 $ 5.97 $ Diluted
Earnings Per Share Adjusted for certain items: (ii) 0.12 — Loss from discontinued operations, net of tax 0.67 0.58 Amortization
0.26 0.36 Restructuring costs 0.67 1.16 Transaction and transformation (0.17) 0.01 Loss/(gain) on disposal of operations (0.66) (0.64)
Tax effect on certain items listed above (i) 0.04 — Tax effect of internal reorganizations 6.33 $ 7.44 $ Adjusted Diluted Earnings
Per Share (ii) (i) The tax effect was calculated using an effective tax rate for each item. (ii) Per share values and totals may differ
due to rounding. wtwco.com © 2024 WTW. All rights reserved. See “WTW Forward - Looking Statements“ above for information
about forward - looking statements and cautionary language, including how actual results may differ materially from those in the slide
presentation. 27
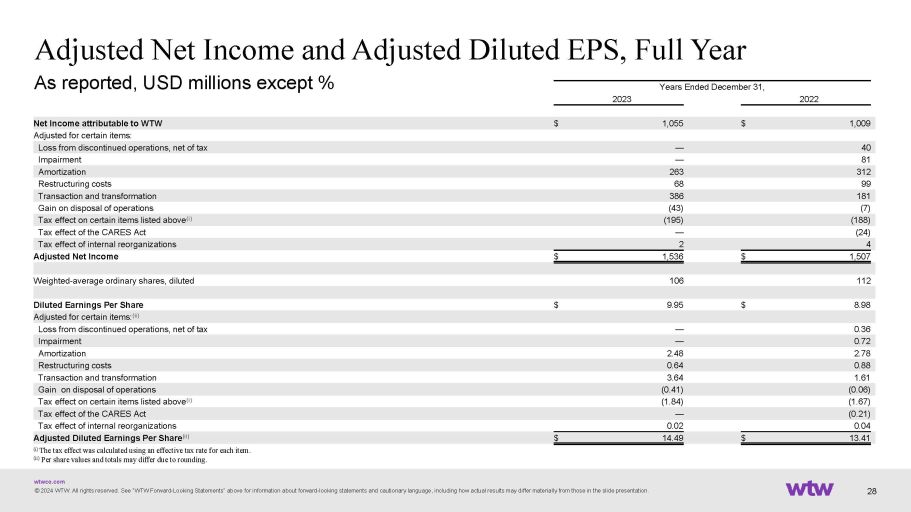
Adjusted Net Income and Adjusted Diluted
EPS, Full Year As reported, USD millions except % Years Ended December 31, 2022 2023 1,009 $ 1,055 $ Net Income attributable to WTW Adjusted
for certain items: 40 — Loss from discontinued operations, net of tax 81 — Impairment 312 263 Amortization 99 68 Restructuring
costs 181 386 Transaction and transformation (7) (43) Gain on disposal of operations (188) (195) Tax effect on certain items listed above
(i) (24) — Tax effect of the CARES Act 4 2 Tax effect of internal reorganizations 1,507 $ 1,536 $ Adjusted Net Income 112 106 Weighted
- average ordinary shares, diluted 8.98 $ 9.95 $ Diluted Earnings Per Share Adjusted for certain items: (ii) 0.36 — Loss from discontinued
operations, net of tax 0.72 — Impairment 2.78 2.48 Amortization 0.88 0.64 Restructuring costs 1.61 3.64 Transaction and transformation
(0.06) (0.41) Gain on disposal of operations (1.67) (1.84) Tax effect on certain items listed above (i) (0.21) — Tax effect of the
CARES Act 0.04 0.02 Tax effect of internal reorganizations 13.41 $ 14.49 $ Adjusted Diluted Earnings Per Share (ii) wtwco.com © 2024
WTW. All rights reserved. See “WTW Forward - Looking Statements“ above for information about forward - looking statements
and cautionary language, including how actual results may differ materially from those in the slide presentation. 28 (i) The tax effect
was calculated using an effective tax rate for each item. (ii) Per share values and totals may differ due to rounding.
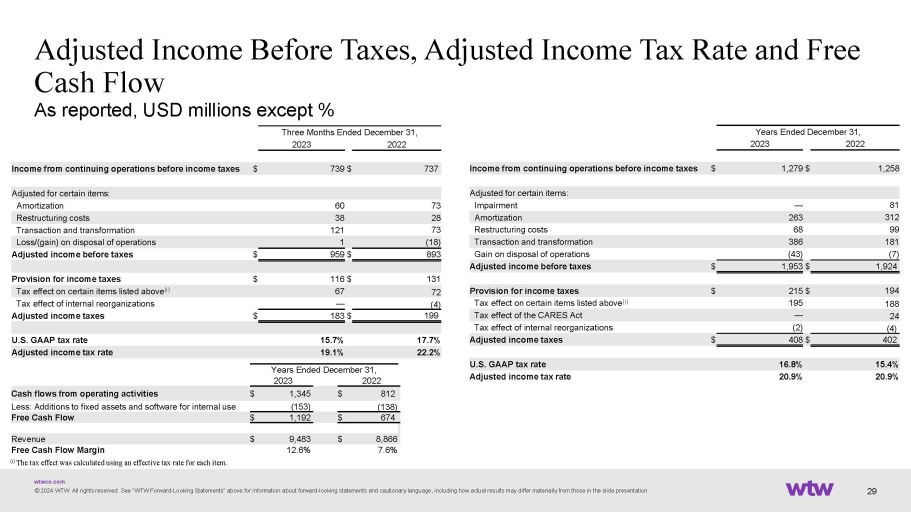
Adjusted Income Before Taxes, Adjusted Income
Tax Rate and Free Cash Flow As reported, USD millions except % Three Months Ended December 31, 2022 2023 737 $ 739 $ Income from continuing
operations before income taxes Adjusted for certain items: 73 60 Amortization 28 38 Restructuring costs 73 121 Transaction and transformation
(18) 1 Loss/(gain) on disposal of operations 893 $ 959 $ Adjusted income before taxes 131 $ 116 $ Provision for income taxes 72 67 Tax
effect on certain items listed above (i) (4) — Tax effect of internal reorganizations 199 $ 183 $ Adjusted income taxes 17.7% 15.7%
U.S. GAAP tax rate 22.2% 19.1% Adjusted income tax rate Years Ended December 31, 2022 2023 812 $ 1,345 $ Cash flows from operating activities
(138) (153) Less: Additions to fixed assets and software for internal use 674 $ 1,192 $ Free Cash Flow 8,866 $ 9,483 $ Revenue 7.6% 12.6%
Free Cash Flow Margin (i) The tax effect was calculated using an effective tax rate for each item. Years Ended December 31, 2022 2023
1,258 $ 1,279 $ Income from continuing operations before income taxes Adjusted for certain items: — Impairment 312 263 Amortization
68 Restructuring costs 181 386 Transaction and transformation (43) Gain on disposal of operations 1,924 $ 1,953 $ Adjusted income before
taxes 194 $ 215 $ Provision for income taxes 188 195 Tax effect on certain items listed above (i) — Tax effect of the CARES Act
(4) (2) Tax effect of internal reorganizations 402 $ 408 $ Adjusted income taxes 15.4% 16.8% U.S. GAAP tax rate 20.9% 20.9% Adjusted income
tax rate wtwco.com © 2024 WTW. All rights reserved. See “WTW Forward - Looking Statements“ above for information about
forward - looking statements and cautionary language, including how actual results may differ materially from those in the slide presentation.
29
About WTW At WTW (NASDAQ: WTW), we provide
data - driven, insight - led solutions in the areas of people, risk and capital. Leveraging the global view and local expertise of our
colleagues serving 140 countries and markets, we help organizations sharpen their strategy, enhance organizational resilience, motivate
their workforce and maximize performance. Working shoulder to shoulder with our clients, we uncover opportunities for sustainable success
— and provide perspective that moves you. Learn more at www.wtwco.com . wtwco.com © 2024 WTW. All rights reserved. See “WTW
Forward - Looking Statements“ above for information about forward - looking statements and cautionary language, including how actual
results may differ materially from those in the slide presentation. 30
v3.24.0.1
| X |
- DefinitionBoolean flag that is true when the XBRL content amends previously-filed or accepted submission.
| Name: |
dei_AmendmentFlag |
| Namespace Prefix: |
dei_ |
| Data Type: |
xbrli:booleanItemType |
| Balance Type: |
na |
| Period Type: |
duration |
|
| X |
- DefinitionFor the EDGAR submission types of Form 8-K: the date of the report, the date of the earliest event reported; for the EDGAR submission types of Form N-1A: the filing date; for all other submission types: the end of the reporting or transition period. The format of the date is YYYY-MM-DD.
| Name: |
dei_DocumentPeriodEndDate |
| Namespace Prefix: |
dei_ |
| Data Type: |
xbrli:dateItemType |
| Balance Type: |
na |
| Period Type: |
duration |
|
| X |
- DefinitionThe type of document being provided (such as 10-K, 10-Q, 485BPOS, etc). The document type is limited to the same value as the supporting SEC submission type, or the word 'Other'.
| Name: |
dei_DocumentType |
| Namespace Prefix: |
dei_ |
| Data Type: |
dei:submissionTypeItemType |
| Balance Type: |
na |
| Period Type: |
duration |
|
| X |
- DefinitionAddress Line 1 such as Attn, Building Name, Street Name
| Name: |
dei_EntityAddressAddressLine1 |
| Namespace Prefix: |
dei_ |
| Data Type: |
xbrli:normalizedStringItemType |
| Balance Type: |
na |
| Period Type: |
duration |
|
| X |
- Definition
+ References
+ Details
| Name: |
dei_EntityAddressCityOrTown |
| Namespace Prefix: |
dei_ |
| Data Type: |
xbrli:normalizedStringItemType |
| Balance Type: |
na |
| Period Type: |
duration |
|
| X |
- DefinitionISO 3166-1 alpha-2 country code.
| Name: |
dei_EntityAddressCountry |
| Namespace Prefix: |
dei_ |
| Data Type: |
dei:countryCodeItemType |
| Balance Type: |
na |
| Period Type: |
duration |
|
| X |
- DefinitionCode for the postal or zip code
| Name: |
dei_EntityAddressPostalZipCode |
| Namespace Prefix: |
dei_ |
| Data Type: |
xbrli:normalizedStringItemType |
| Balance Type: |
na |
| Period Type: |
duration |
|
| X |
- DefinitionA unique 10-digit SEC-issued value to identify entities that have filed disclosures with the SEC. It is commonly abbreviated as CIK. Reference 1: http://www.xbrl.org/2003/role/presentationRef
-Publisher SEC
-Name Exchange Act
-Number 240
-Section 12
-Subsection b-2
| Name: |
dei_EntityCentralIndexKey |
| Namespace Prefix: |
dei_ |
| Data Type: |
dei:centralIndexKeyItemType |
| Balance Type: |
na |
| Period Type: |
duration |
|
| X |
- DefinitionIndicate if registrant meets the emerging growth company criteria. Reference 1: http://www.xbrl.org/2003/role/presentationRef
-Publisher SEC
-Name Exchange Act
-Number 240
-Section 12
-Subsection b-2
| Name: |
dei_EntityEmergingGrowthCompany |
| Namespace Prefix: |
dei_ |
| Data Type: |
xbrli:booleanItemType |
| Balance Type: |
na |
| Period Type: |
duration |
|
| X |
- DefinitionCommission file number. The field allows up to 17 characters. The prefix may contain 1-3 digits, the sequence number may contain 1-8 digits, the optional suffix may contain 1-4 characters, and the fields are separated with a hyphen.
| Name: |
dei_EntityFileNumber |
| Namespace Prefix: |
dei_ |
| Data Type: |
dei:fileNumberItemType |
| Balance Type: |
na |
| Period Type: |
duration |
|
| X |
- DefinitionTwo-character EDGAR code representing the state or country of incorporation.
| Name: |
dei_EntityIncorporationStateCountryCode |
| Namespace Prefix: |
dei_ |
| Data Type: |
dei:edgarStateCountryItemType |
| Balance Type: |
na |
| Period Type: |
duration |
|
| X |
- DefinitionThe exact name of the entity filing the report as specified in its charter, which is required by forms filed with the SEC. Reference 1: http://www.xbrl.org/2003/role/presentationRef
-Publisher SEC
-Name Exchange Act
-Number 240
-Section 12
-Subsection b-2
| Name: |
dei_EntityRegistrantName |
| Namespace Prefix: |
dei_ |
| Data Type: |
xbrli:normalizedStringItemType |
| Balance Type: |
na |
| Period Type: |
duration |
|
| X |
- DefinitionThe Tax Identification Number (TIN), also known as an Employer Identification Number (EIN), is a unique 9-digit value assigned by the IRS. Reference 1: http://www.xbrl.org/2003/role/presentationRef
-Publisher SEC
-Name Exchange Act
-Number 240
-Section 12
-Subsection b-2
| Name: |
dei_EntityTaxIdentificationNumber |
| Namespace Prefix: |
dei_ |
| Data Type: |
dei:employerIdItemType |
| Balance Type: |
na |
| Period Type: |
duration |
|
| X |
- DefinitionLocal phone number for entity.
| Name: |
dei_LocalPhoneNumber |
| Namespace Prefix: |
dei_ |
| Data Type: |
xbrli:normalizedStringItemType |
| Balance Type: |
na |
| Period Type: |
duration |
|
| X |
- DefinitionBoolean flag that is true when the Form 8-K filing is intended to satisfy the filing obligation of the registrant as pre-commencement communications pursuant to Rule 13e-4(c) under the Exchange Act. Reference 1: http://www.xbrl.org/2003/role/presentationRef
-Publisher SEC
-Name Exchange Act
-Number 240
-Section 13e
-Subsection 4c
| Name: |
dei_PreCommencementIssuerTenderOffer |
| Namespace Prefix: |
dei_ |
| Data Type: |
xbrli:booleanItemType |
| Balance Type: |
na |
| Period Type: |
duration |
|
| X |
- DefinitionBoolean flag that is true when the Form 8-K filing is intended to satisfy the filing obligation of the registrant as pre-commencement communications pursuant to Rule 14d-2(b) under the Exchange Act. Reference 1: http://www.xbrl.org/2003/role/presentationRef
-Publisher SEC
-Name Exchange Act
-Number 240
-Section 14d
-Subsection 2b
| Name: |
dei_PreCommencementTenderOffer |
| Namespace Prefix: |
dei_ |
| Data Type: |
xbrli:booleanItemType |
| Balance Type: |
na |
| Period Type: |
duration |
|
| X |
- DefinitionTitle of a 12(b) registered security. Reference 1: http://www.xbrl.org/2003/role/presentationRef
-Publisher SEC
-Name Exchange Act
-Number 240
-Section 12
-Subsection b
| Name: |
dei_Security12bTitle |
| Namespace Prefix: |
dei_ |
| Data Type: |
dei:securityTitleItemType |
| Balance Type: |
na |
| Period Type: |
duration |
|
| X |
- DefinitionName of the Exchange on which a security is registered. Reference 1: http://www.xbrl.org/2003/role/presentationRef
-Publisher SEC
-Name Exchange Act
-Number 240
-Section 12
-Subsection d1-1
| Name: |
dei_SecurityExchangeName |
| Namespace Prefix: |
dei_ |
| Data Type: |
dei:edgarExchangeCodeItemType |
| Balance Type: |
na |
| Period Type: |
duration |
|
| X |
- DefinitionBoolean flag that is true when the Form 8-K filing is intended to satisfy the filing obligation of the registrant as soliciting material pursuant to Rule 14a-12 under the Exchange Act. Reference 1: http://www.xbrl.org/2003/role/presentationRef
-Publisher SEC
-Name Exchange Act
-Section 14a
-Number 240
-Subsection 12
| Name: |
dei_SolicitingMaterial |
| Namespace Prefix: |
dei_ |
| Data Type: |
xbrli:booleanItemType |
| Balance Type: |
na |
| Period Type: |
duration |
|
| X |
- DefinitionTrading symbol of an instrument as listed on an exchange.
| Name: |
dei_TradingSymbol |
| Namespace Prefix: |
dei_ |
| Data Type: |
dei:tradingSymbolItemType |
| Balance Type: |
na |
| Period Type: |
duration |
|
| X |
- DefinitionBoolean flag that is true when the Form 8-K filing is intended to satisfy the filing obligation of the registrant as written communications pursuant to Rule 425 under the Securities Act. Reference 1: http://www.xbrl.org/2003/role/presentationRef
-Publisher SEC
-Name Securities Act
-Number 230
-Section 425
| Name: |
dei_WrittenCommunications |
| Namespace Prefix: |
dei_ |
| Data Type: |
xbrli:booleanItemType |
| Balance Type: |
na |
| Period Type: |
duration |
|
Willis Towers Watson Pub... (NASDAQ:WTW)
Historical Stock Chart
From Apr 2024 to May 2024

Willis Towers Watson Pub... (NASDAQ:WTW)
Historical Stock Chart
From May 2023 to May 2024
