0000716605
true
Penns Woods Bancorp, Inc. (the "Company") is filing this Current Report on Form 8-K/A solely to update slide 9 of the slide presentation, filed on September 7, 2023 with the SEC (the "Original Slide Presentation"), in order to add a footnote to indicate that the non-interest bearing deposit growth is presented on an annualized basis.
0000716605
2023-09-07
2023-09-07
iso4217:USD
xbrli:shares
iso4217:USD
xbrli:shares
UNITED STATES
SECURITIES AND EXCHANGE COMMISSION
Washington, D.C. 20549
FORM 8-K/A
(Amendment No. 1)
CURRENT REPORT
Pursuant to Section 13 or 15(d)
of
The Securities Exchange Act of 1934
Date of Report (Date of earliest event reported): September 11, 2023 (September 7, 2023)
PENNS WOODS BANCORP, INC.
(Exact name of registrant as specified in
its charter)
| Pennsylvania |
|
000-17077 |
|
23-2226454 |
(State or
other jurisdiction
of incorporation) |
|
(Commission
File Number) |
|
(IRS Employer
Ident. No.) |
| |
|
|
|
|
| 300
Market Street, P.O.
Box 967, Williamsport,
Pennsylvania |
|
17703-0967 |
| (Address of principal executive offices) |
|
(Zip Code) |
| |
(570)
322-1111
Registrant’s
telephone number, including area code |
| |
| N/A |
| (Former name or former address, if changed since last report.) |
Check the appropriate box below if the Form 8-K filing is intended
to simultaneously satisfy the filing obligation of the registrant under any of the following provisions:
o Written communications
pursuant to Rule 425 under the Securities Act (17 CFR 230.425)
o Soliciting material
pursuant to Rule 14a-12 under the Exchange Act (17 CFR 240.14a-12)
o Pre-commencement
communications pursuant to Rule 14d-2(b) under the Exchange Act (17 CFR 240.14d-2(b))
o Pre-commencement
communications pursuant to Rule 13e-4(c) under the Exchange Act (17 CFR 240.13e-4 (c))
Securities registered pursuant to Section 12(b) of the Act:
| Title of each class |
Trading
Symbol(s) |
Name
of each exchange on which registered |
| Common
Stock, $5.55 par value |
PWOD |
The
Nasdaq Global Select Market |
Indicate by check mark whether the registrant is an emerging
growth company as defined in Rule 405 of the Securities Act of 1933 (17 CFR §230.405 of this chapter) or Rule 12b-2 of the
Securities Exchange Act of 1934 (17 CFR §240.12b-2 of this chapter).
Emerging growth company ¨
If an emerging growth company, indicate by check mark if the
registrant has elected not to use the extended transition period for complying with any new or revised financial accounting standards
provided pursuant to Section 13(a) of the Exchange Act. ¨
EXPLANATORY
NOTE
Penns
Woods Bancorp, Inc. (the “Company”) is filing this Current Report on Form 8-K/A solely to update slide 9 of
the slide presentation, filed on September 7, 2023 with the SEC (the “Original Slide Presentation”), in order to add
a footnote to indicate that the non-interest bearing deposit growth is presented on an annualized basis.
The Original
Slide Presentation was furnished in the Company’s Current Report on Form 8-K filed with the SEC on September 7, 2023 (the
“Form 8-K”). Other than the changes to the Original Slide Presentation described above, no other changes have been made
to the Form 8-K. This Amendment No. 1 to the Form 8-K speaks as of the original filing date of the Form 8-K,
does not reflect events that may have occurred subsequent to the original filing date, and does not otherwise modify or update in any
way disclosures made in the original Form 8-K.
| Item 7.01 | Regulation FD Disclosure. |
On
September 7, 2023, Penns Woods Bancorp, Inc. (the “Company”) made available on its website an updated slide presentation
regarding the Company (the “Slide Presentation”). On September 11,
2023, the Company posted a corrected version of the Slide Presentation on its website. A copy of the Slide Presentation, as corrected,
is attached hereto as Exhibit 99.1, and is incorporated herein by reference.
The information contained in this Report, including
Exhibit 99.1 attached hereto, is considered to be “furnished” and shall not be deemed to be “filed” for purposes
of Section 18 of the Securities Exchange Act of 1934, as amended, or otherwise subject to liability under that section. The information
contained in this Report, including Exhibit 99.1 attached hereto, shall not be incorporated by reference into any filing or other
document pursuant to the Securities Act of 1933, as amended, or the Exchange Act, except as expressly set forth by specific reference
in such filing.
| Item 9.01 | Financial Statements and Exhibits. |
| 104 | Cover Page Interactive Data File (the cover page XBRL tags are embedded within the Inline XBRL document) |
SIGNATURES
Pursuant to the requirements of the Securities
Exchange Act of 1934, the registrant has duly caused this report to be signed on its behalf by the undersigned hereunto duly authorized.
| |
PENNS WOODS BANCORP, INC. |
| |
|
|
| Dated: September 11, 2023 |
|
|
| |
|
|
| |
By: |
/s/ Brian L. Knepp |
| |
|
Brian L. Knepp |
| |
|
President and Chief Financial Officer |
| |
|
|
Exhibit 99.1

1 Creating Success by Delivering Solutions Penns Woods Bancorp, Inc. September 2023T:tm2325328-3tm2325328-3_8kseq1
2 Forward - Looking Information Certain statements contained in this presentation are forward - looking in nature . These include all statements about PWB’s plans, objectives, expectations and other statements that are not historical facts, and usually use words such as "expect," "anticipate," "believe" and similar expressions . Such statements represent management's current beliefs, based upon information available at the time the statements are made, with regard to the matters addressed . All forward - looking statements are subject to risks and uncertainties that could cause PWB’s actual results or financial condition to differ materially from those expressed in or implied by such statements . Factors of particular importance to PWB include, but are not limited to : ( 1 ) changes in general, national or regional economic conditions ; ( 2 ) changes in interest rates ; ( 3 ) changes in loan default and charge - off rates ; ( 4 ) changes in deposit levels ; ( 5 ) changes in levels of income and expense in non - interest income and expense related activities ; ( 6 ) residential mortgage and secondary market activity ; ( 7 ) changes in accounting and regulatory guidance applicable to banks ; ( 8 ) price levels and conditions in the public securities markets generally ; ( 9 ) competition and its effect on pricing, spending, third - party relationships and revenues ; ( 10 ) changes in regulation resulting from or relating to financial reform legislation ; and ( 11 ) the risk factors identified in PWB’s Annual Report on Form 10 - K for the year ended December 31 , 2022 and in other filings made by PWB under the Securities Exchange Act of 1934 . PWB does not undertake any obligation to update or revise any forward - looking statements, whether as a result of new information, future events or otherwise . Penns Woods Bancorp, Inc.
3 Non - GAAP Financial Measures This presentation contains financial information determined by methods other than in accordance with generally accepted accounting principles in the United States (“GAAP”) . These non - GAAP measures include tangible book value per share and return on average tangible common equity . Management uses these non - GAAP financial measures because this information is commonly utilized by regulators and investors to evaluate financial condition, and is therefore useful to investors . These disclosures should not be viewed as a substitute for operating results determined in accordance with GAAP, nor are they necessarily comparable to non - GAAP performance measures that may be presented by other companies . A reconciliation of the non - GAAP measures, tangible book value per share and return on average tangible common equity, used in this presentation to the related GAAP measure is included in the appendix to this presentation . Penns Woods Bancorp, Inc.

4 $1.2 $1.2 $1.3 $1.3 $1.5 $1.7 $1.7 $1.8 $1.9 $2.0 $2.1 2013 2014 2015 2016 2017 2018 2019 2020 2021 2022 2023Q2 Company Profile Penns Woods Bancorp, Inc. NASDAQ Ticker: PWOD Market Cap: $188.7 million (8/7/2023) Headquarters: Williamsport, Lycoming County, PA Branch Offices: 24 Total Assets: $2.1 billion Total Loans: $1.8 billion Total Deposits: $1.6 billion Total Equity: $174.4 million Total Assets $ in billions HQ MSA # of Branches Total Deposits ($M) Williamsport, PA 8 $593 Scranton--Wilkes-Barre, PA 8 482 State College, PA 4 253 Lock Haven, PA 2 163 Bloomsburg-Berwick, PA 1 55 Lewisburg, PA 1 40 Altoona, PA 1 5 Total 25 $1,591 Source: S&P Global Market Intelligence, FDIC. Note: FDIC deposit data as of 6/30/2022.
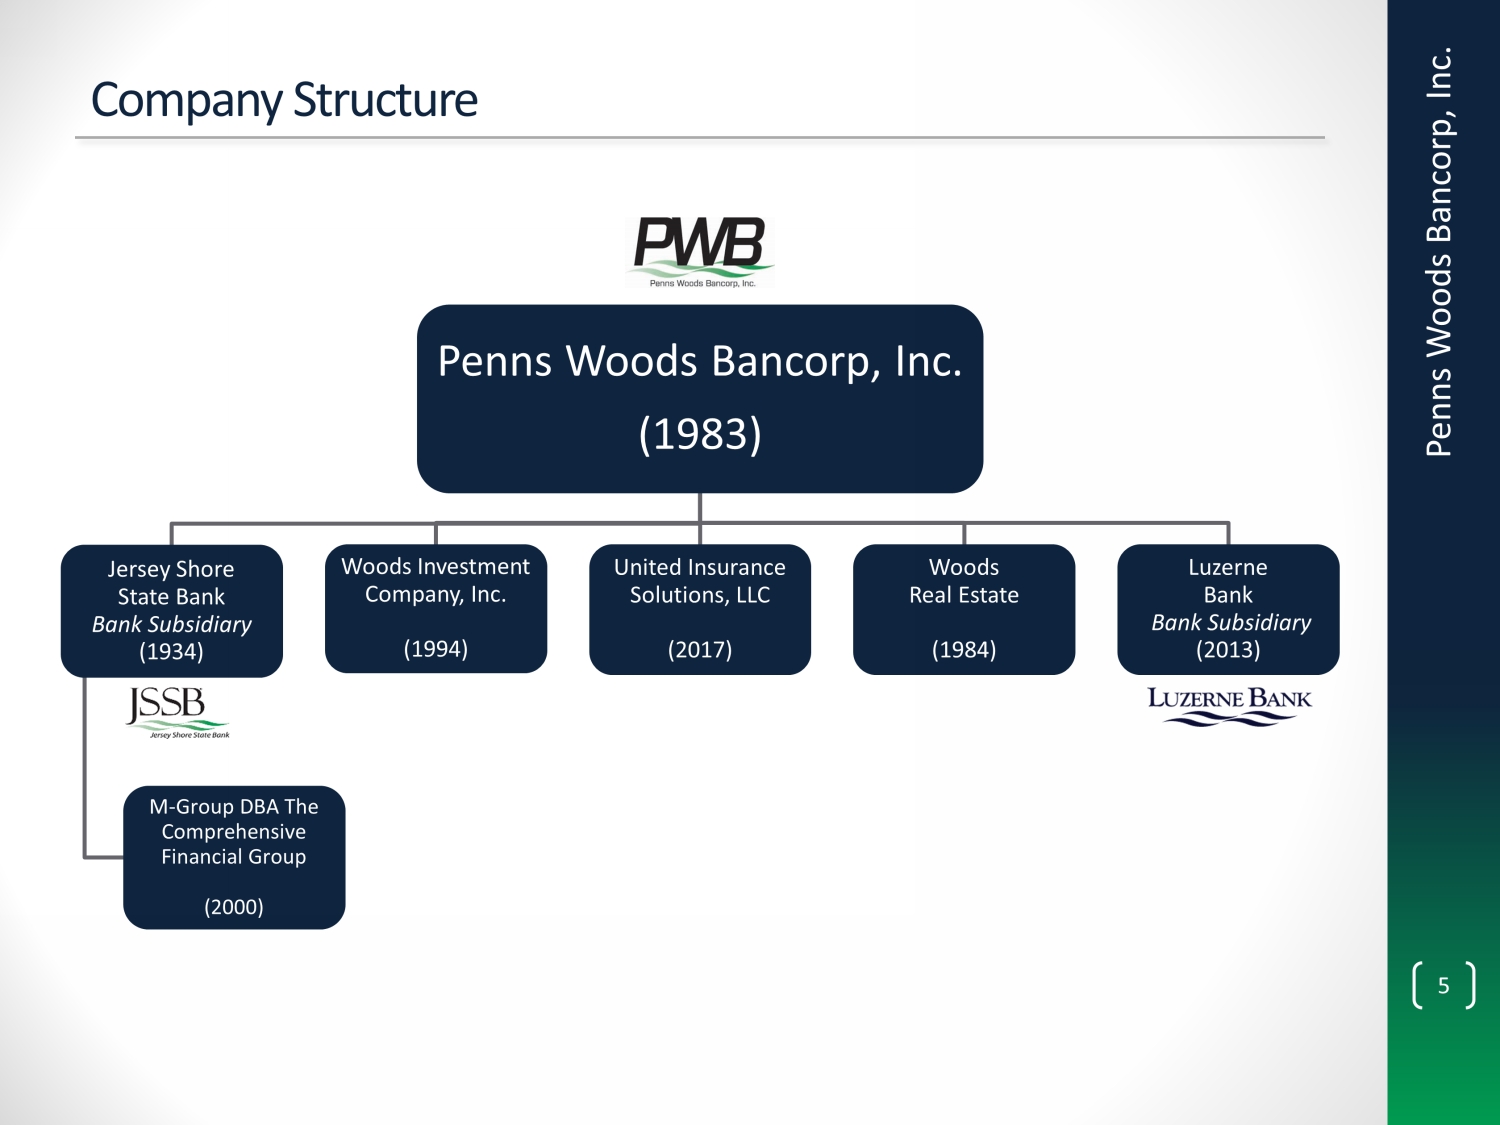
5 Company Structure Penns Woods Bancorp, Inc. (1983) Jersey Shore State Bank Bank Subsidiary (1934) M - Group DBA The Comprehensive Financial Group (2000) Woods Investment Company, Inc. (1994) United Insurance Solutions, LLC (2017) Woods Real Estate (1984) Luzerne Bank Bank Subsidiary (2013) Penns Woods Bancorp, Inc.

6 Market Area Penns Woods Bancorp, Inc. Jersey Shore State Bank: 17 branches Luzerne Bank: 8 branches Primary Areas of Operation • Luzerne, PA (Primary Service Area) • Lycoming, PA – Williamsport, PA • Centre, PA – State College, PA • Clinton, PA • Montour, PA – Danville, PA • Union, PA – Lewisburg, PA • Blair, PA Source: S&P Global Market Intelligence.
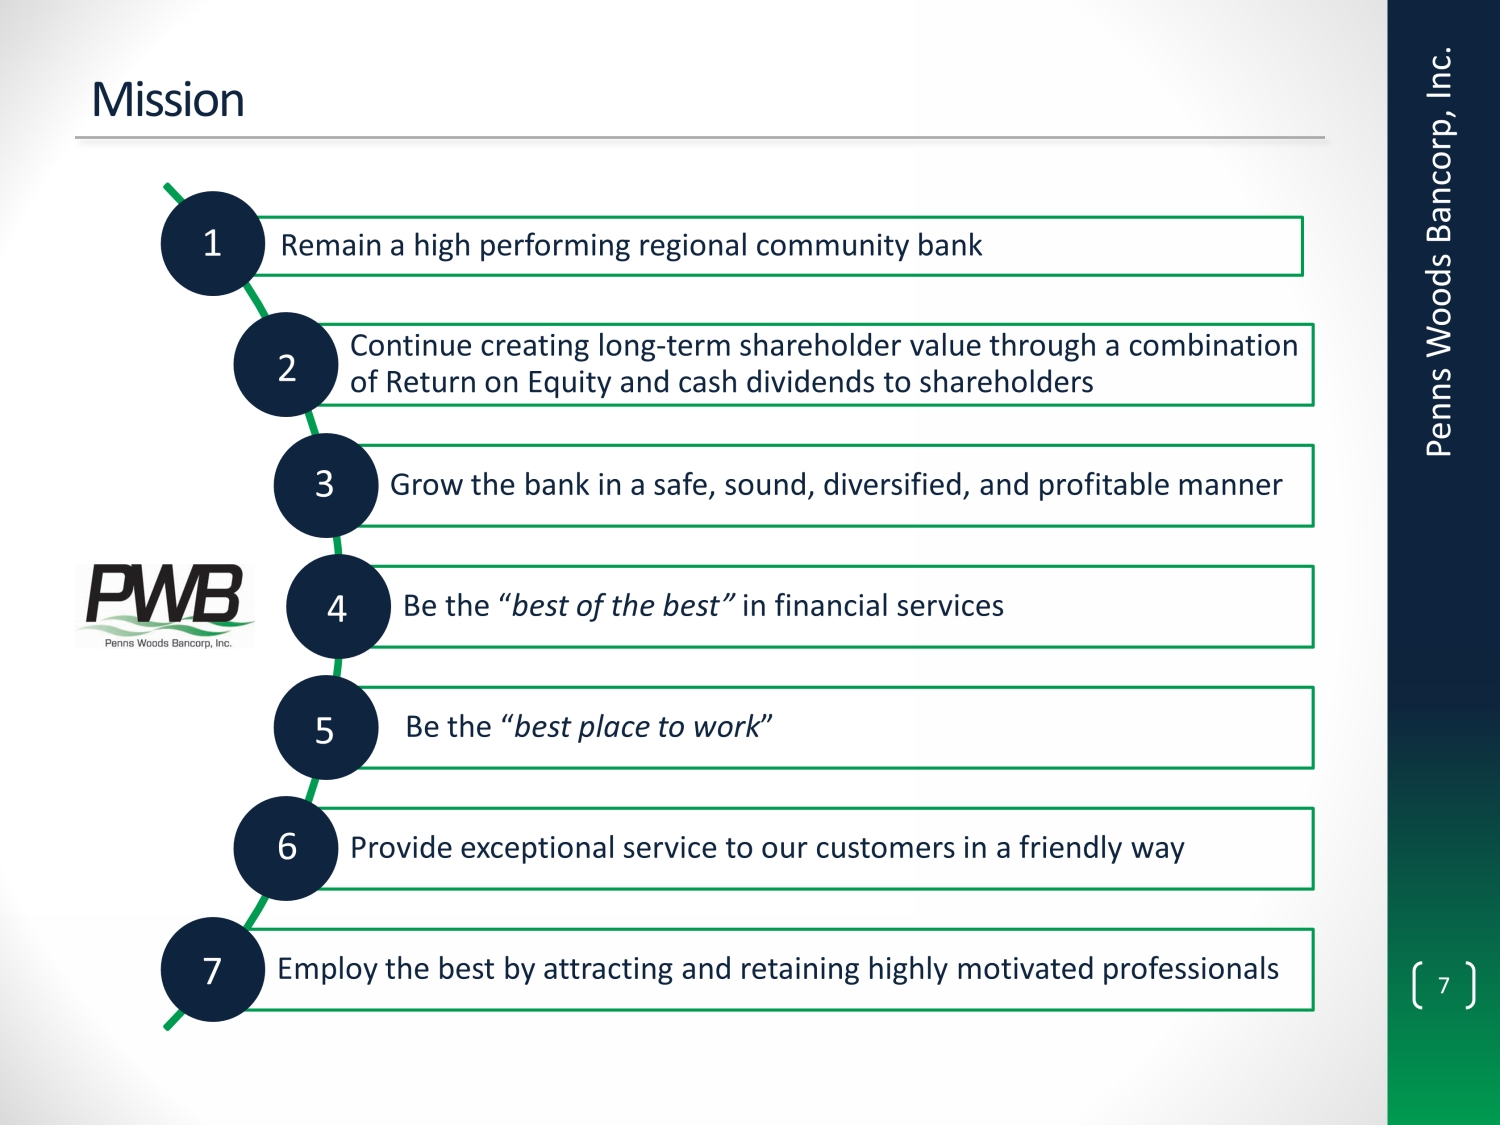
7 Mission Remain a high performing regional community bank Continue creating long - term shareholder value through a combination of Return on Equity and cash dividends to shareholders Grow the bank in a safe, sound, diversified, and profitable manner Be the “ best of the best” in financial services Be the “ best place to work ” Provide exceptional service to our customers in a friendly way Employ the best by attracting and retaining highly motivated professionals Penns Woods Bancorp, Inc. 1 2 3 4 5 6 7
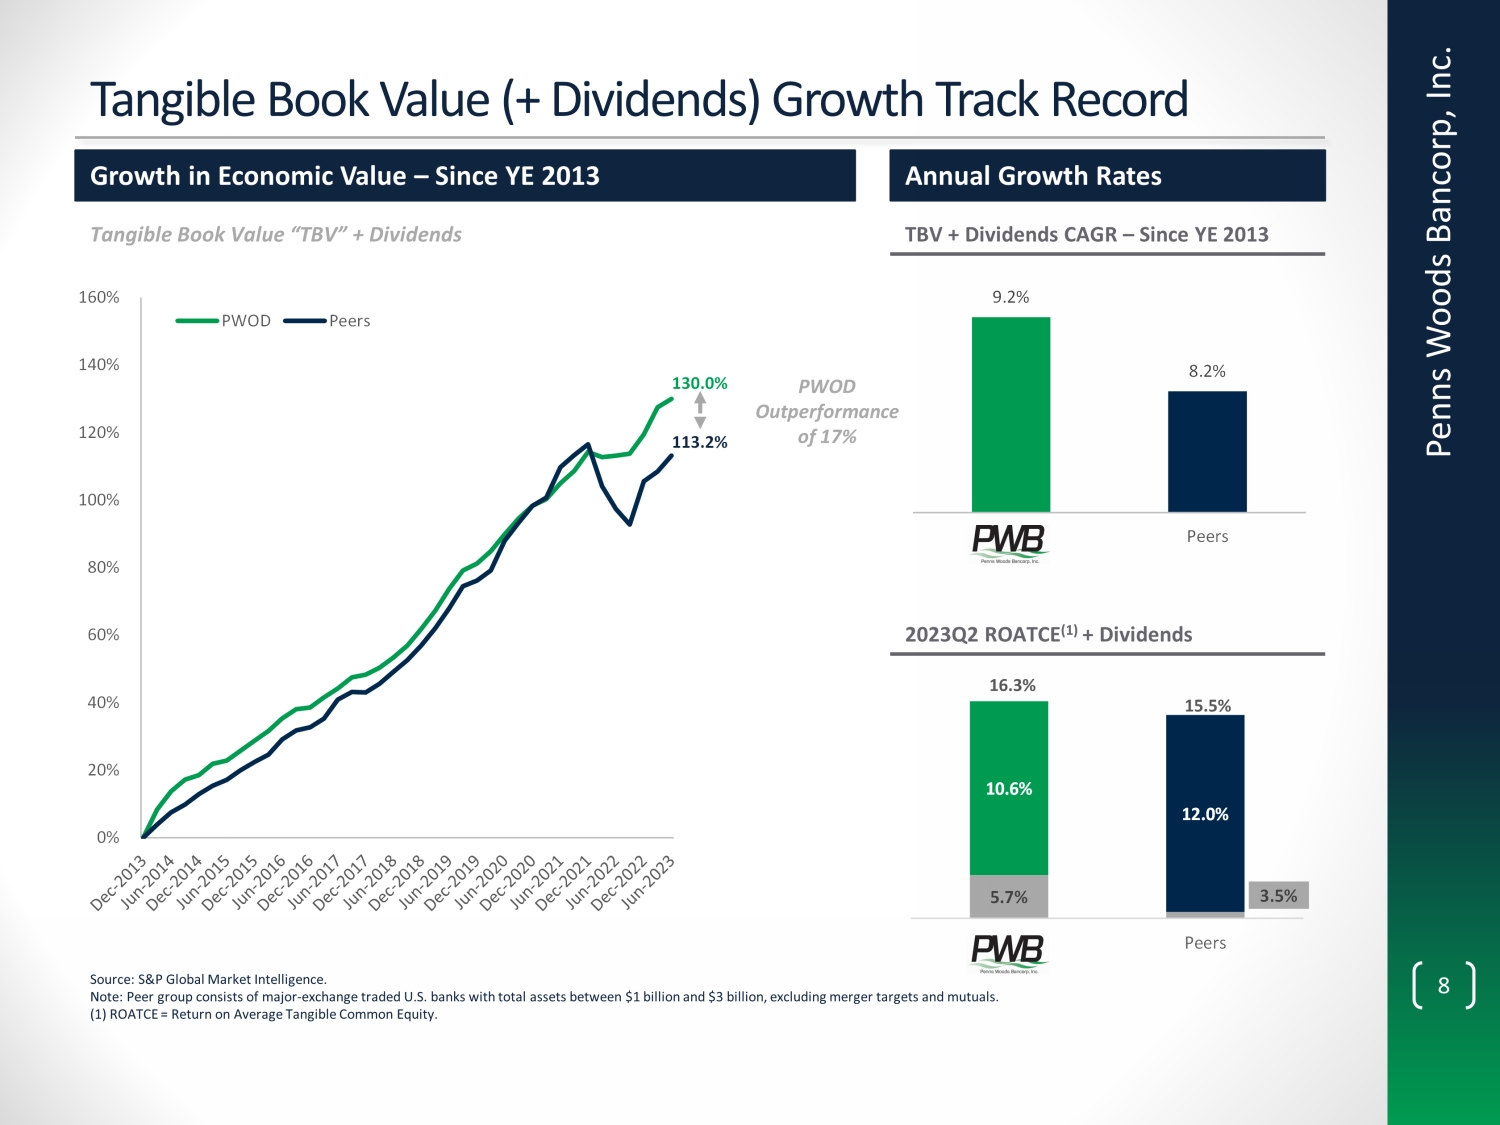
8 130.0% 113.2% 0% 20% 40% 60% 80% 100% 120% 140% 160% PWOD Peers Tangible Book Value (+ Dividends) Growth Track Record Penns Woods Bancorp, Inc. Growth in Economic Value – Since YE 2013 Tangible Book Value “TBV” + Dividends Annual Growth Rates TBV + Dividends CAGR – Since YE 2013 2023Q2 ROATCE (1) + Dividends Source: S&P Global Market Intelligence. Note: Peer group consists of major - exchange traded U.S. banks with total assets between $1 billion and $3 billion, excluding mer ger targets and mutuals. (1) ROATCE = Return on Average Tangible Common Equity. PWOD Outperformance of 1 7 % 9.2% 8.2% PWOD Peers 5.7% 3.5% 10.6% 12.0% PWOD Peers 16 .3% 15.5%
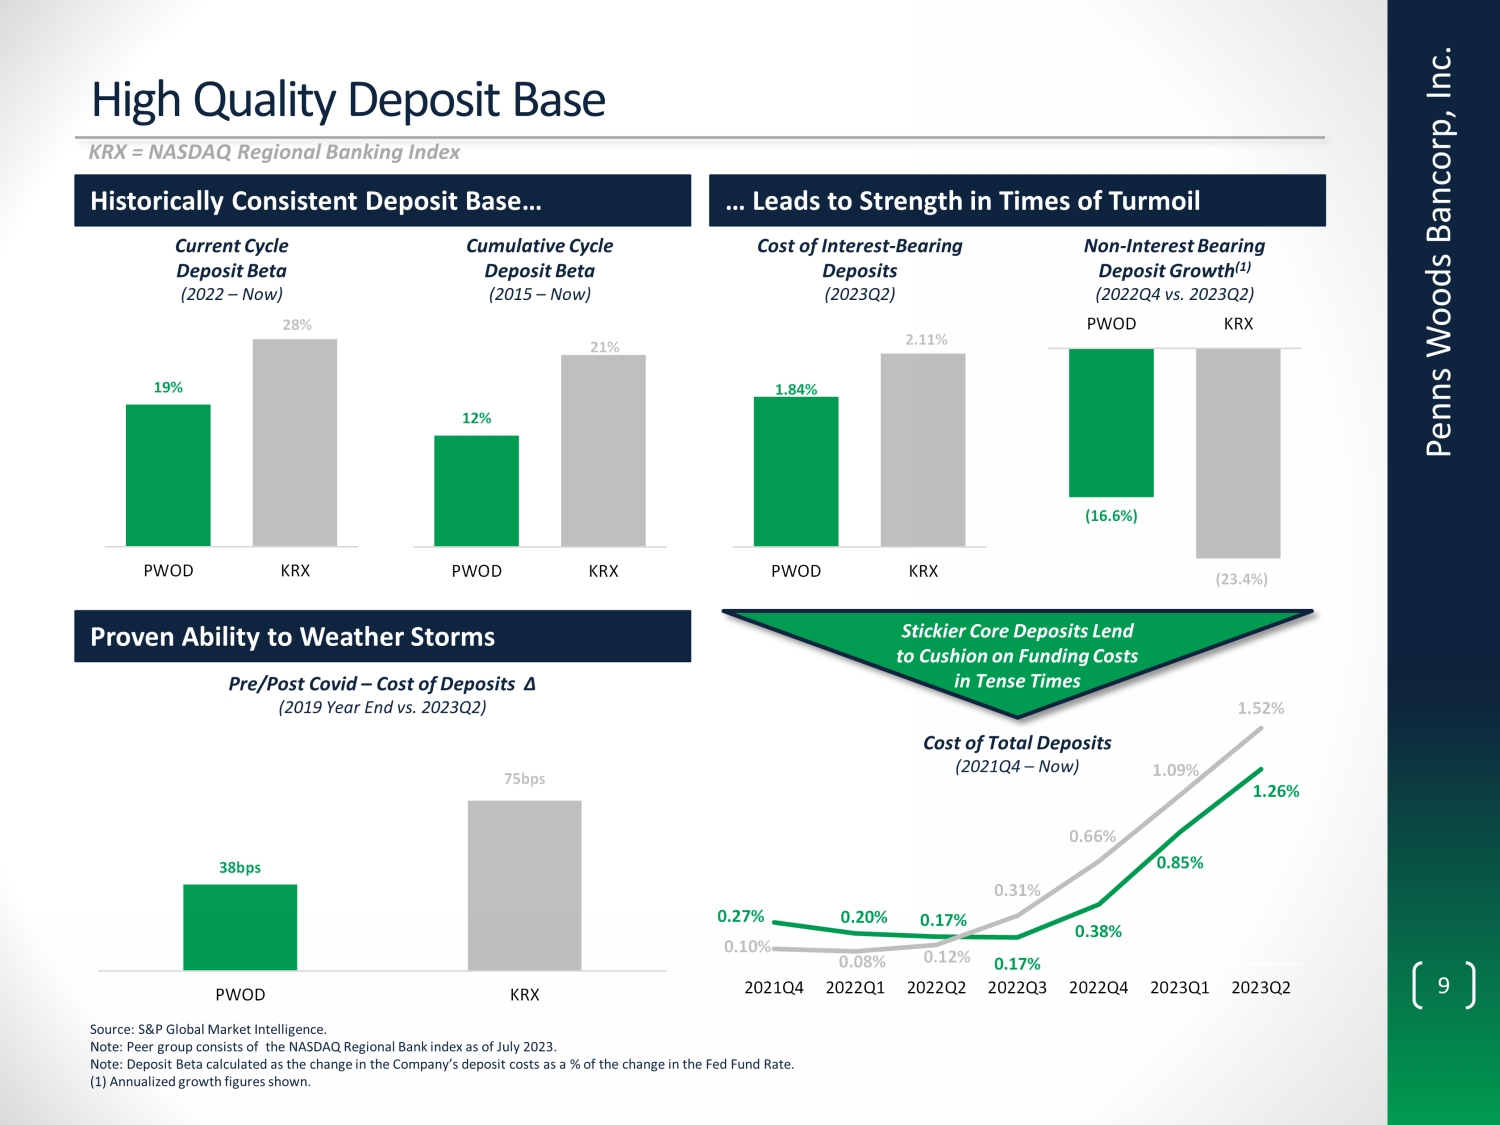
9 38bps 75bps PWOD KRX High Quality Deposit Base Penns Woods Bancorp, Inc. Historically Consistent Deposit Base… … Leads to Strength in Times of Turmoil Source: S&P Global Market Intelligence. Note: Peer group consists of the NASDAQ Regional Bank index as of July 2023. Note: Deposit Beta calculated as the change in the Company’s deposit costs as a % of the change in the Fed Fund Rate. (1) Annualized growth figures shown. 19% 28% PWOD KRX 12% 21% PWOD KRX Current Cycle Deposit Beta (2022 – Now) 0.27% 0.20% 0.17% 0.17% 0.38% 0.85% 1.26% 0.10% 0.08% 0.12% 0.31% 0.66% 1.09% 1.52% 2021Q4 2022Q1 2022Q2 2022Q3 2022Q4 2023Q1 2023Q2 KRX = NASDAQ Regional Banking Index Stickier Core Deposits Lend to Cushion on Funding Costs in Tense Times Cumulative Cycle Deposit Beta (2015 – Now) Cost of Total Deposits (2021Q4 – Now) 1.84% 2.11% PWOD KRX (16.6%) (23.4%) PWOD KRX Cost of Interest - Bearing Deposits (2023Q2) Non - Interest Bearing Deposit Growth (1) (2022Q4 vs. 2023Q2) Proven Ability to Weather Storms Pre/Post Covid – Cost of Deposits Δ (2019 Year End vs. 2023Q2)

10 0.85% 0.90% 0.86% 2021 2022 2023 YTD Financial Summary 2020 – 2023 Penns Woods Bancorp, Inc. Return on Equity (%) Return on Average Assets (%) 9.9% 10.7% 10.4% 2021 2022 2023 YTD Earnings Per Share $2.27 $2.47 $2.50 2021 2022 2023 YTD Source: S&P Global Market Intelligence, Company documents. Note: YTD = Year - to - date annualized as of 6/30/2023. Return on Average Tangible Common Equity (%) 10.9% 12.5% 11.6% 2021 2022 2023 YTD
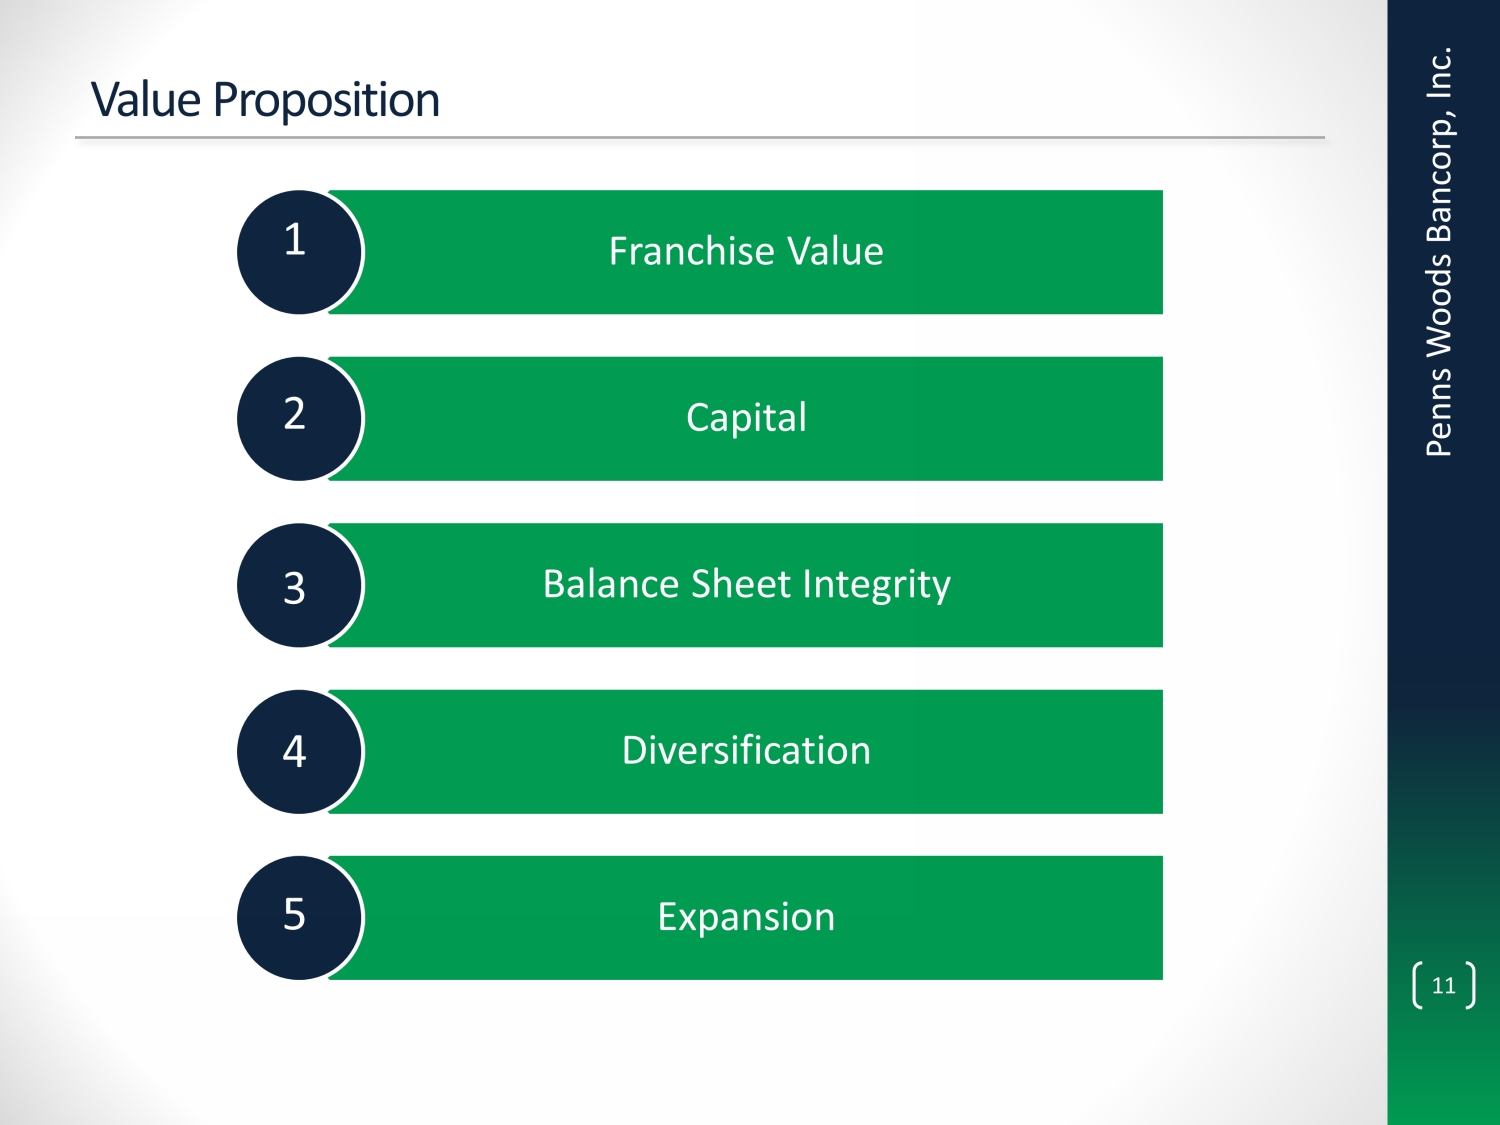
11 Value Proposition Franchise Value Capital Balance Sheet Integrity Diversification Expansion Penns Woods Bancorp, Inc. 1 2 3 4 5

12 Value Proposition Franchise Value 1 Source: S&P Global Market Intelligence, FDIC. Note: FDIC deposit data as of 6/30/2022. (1) Excludes banks over $50 billion; MSA: Metropolitan Statistical Area. PWOD Commands Excellent Market Share in the Four Major MSAs It Operates In (1) Williamsport Scranton -- Wilkes - Barre State College Lock Haven Company # of Branches Total Deposits ($M) 1 Penns Woods Bancorp Inc. 8 $593 2 Woodlands Fnl Services Co 7 496 3 CCFNB Bancorp Inc. 8 496 Company # of Branches Total Deposits ($M) 1 Fidelity D & D Bancorp Inc. 15 $1,715 2 Peoples Financial Services 13 1,467 3 FNCB Bancorp Inc. 15 1,340 7 Penns Woods Bancorp Inc. 8 482 Company # of Branches Total Deposits ($M) 1 F.N.B. Corp. 9 $881 2 Kish Bancorp Inc. 5 347 3 Northwest Bancshares, Inc. 4 317 4 Penns Woods Bancorp Inc. 3 253 Company # of Branches Total Deposits ($M) 1 Penns Woods Bancorp Inc. 2 $163 2 First Commonwealth Financial 3 141 3 F.N.B. Corp. 2 121 Penns Woods Bancorp, Inc.

13 Loan and Deposit Portfolio Composition Penns Woods Bancorp, Inc. Loan Composition Deposit Composition Commercial, Financial, and Ag. 12% Resi 42% CRE 29% Construction 3% Auto 13% Other 1% Non - Interest Bearing 31% Savings 15% NOW 15% Money Market 19% Time Deposits 15% Brokered CDS 5% Yield on Total Loans: 4.60% CRE / TRBC: 273% Cost of Interest Bearing Deposits: 1.84% Cost of Total Deposits: 1.26% Cost of Funds: 1.79% 2023Q2 2023Q2 Source: Company documents.

14 $321 $335 $449 $494 $519 $476 $166 $177 $210 $236 $248 $229 $208 $219 $288 $366 $373 $238 $239 $216 $284 $319 $271 $297 $287 $378 $264 $205 $146 $226 $87 $0 $200 $400 $600 $800 $1,000 $1,200 $1,400 $1,600 $1,800 2018 2019 2020 2021 2022 2023Q2 Noninterest Bearing Savings NOW Money Market Time Deposits Brokered CDS Loan and Deposit Portfolio Composition, Continued Penns Woods Bancorp, Inc. Total Loans Total Deposits $189 $156 $165 $163 $190 $208 $622 $623 $590 $596 $708 $744 $372 $363 $373 $447 $501 $518 $44 $38 $39 $37 $43 $53 $25 $23 $20 $9 $10 $10 $133 $151 $156 $139 $186 $235 $0 $200 $400 $600 $800 $1,000 $1,200 $1,400 $1,600 $1,800 2018 2019 2020 2021 2022 2023 Q2 Commercial R/E Residential R/E Commercial R/E Construction Installment Automobile $1,354 $1,343 $ in millions $ in millions $1,324 $1,621 Source: Company documents. $1,392 $1,639 $1,494 $1,556 $1,384 $1,768 $1,220 $1,554

15 9.4% 5.9% $1.42 $1.28 $106 $172 9.0% 8.3% Capital Tier 1 Capital ($M) Value Proposition Long - term track record of building capital while providing strong shareholder returns Cash Dividend as a % of Tangible Capital (1) Source: S&P Global Market Intelligence, Company documents. Note: 2023 YTD annualized, shown through 6/30/2023. (1) Cash Dividend as a % of Tangible Capital defined as Cash dividends per share / average tangible book value per share. (2) 20 23 YTD is annualized. Cumulative Cash Dividends Since ’13: $14.07 p/share 93% return on 2013 TBV Penns Woods Bancorp, Inc. (2) (2) Tier 1 Leverage Ratio Cash Dividends per Share 2

16 Value Proposition 0.5% 1.1% 2.2% PWOD Pennsylvania Banks All Banks Cumulative Net Charge - offs / Avg. Loans Balance Sheet Integrity 2018 – 2023 YTD 2013 – 2023 YTD Source: S&P Global Market Intelligence, Company documents. Note: 2023 YTD annualized, shown through 6/30/2023. (1) All banks currently operating, acquired, and defunct companies. (2) Annualized NCO data. Penns Woods Bancorp, Inc. (1) 0.9% 2.3% 4.4% PWOD Pennsylvania Banks All Banks (1) 3 0.05% 0.02% 0.03% (0.01%) 0.01% 0.04% 0.03% (0.11%) 2020 2021 2022 Q2 '22 Q3 '22 Q4 '22 Q1 '23 Q2 '23 Net Charge - offs (Recoveries) / Avg. Loans $9,122 $5,389 $3,615 $3,551 $3,156 0.50% 0.28% 0.18% 0.17% 0.15% 2020 2021 2022 Q1 '23 Q2 '23 Nonaccrual Loans ($000) For the Years Ended For the Quarters Ended (2) $9,122 $5,389 $3,615 $3,551 $3,156 0.50% 0.28% 0.18% 0.17% 0.15% 2020 2021 2022 Q1 '23 Q2 '23 Nonaccrual Loans Nonaccrual Loans / Assets

17 $0.3 $0.3 $0.4 $0.4 $0.4 $0.4 $0.5 $0.5 $0.6 $0.5 $0.6 48% 30% 8% 2% 3% 9% Consumer Net Interest Income Commerical Net Interest Income Other Net Interest Income Mortgage Banking Service Charges on Deposits Insurance & Other Fee Income Value Proposition Diversification 4 Total Revenue (1) 2023Q2 Source: S&P Global Market Intelligence. (1) Net Interest Income items estimated based on overall cost of funds for PWOD of 1.79%. Expansion 5 $0.9 $0.9 $1.0 $1.0 $1.1 $1.3 $1.2 $1.3 $1.4 $1.5 $1.5 Total Assets ($bn) Fee Income / Total Revenue: 13% PWOD has demonstrated successful execution of M&A and the ability to grow its bank subsidiaries organically while maintaining a low risk profile and high returns to shareholders Fee Income + Consumer Income / Total Revenue: 61% Penns Woods Bancorp, Inc.

18 Penns Woods Bancorp, Inc. Strategies for a Successful Future Leverage Holding Company Structure Emphasis on “E” Delivery Channels Re - Engineering Company Remain Different From Our Peers Strive for Excellence

19 42.5 45.2 50.1 58.0 62.0 2019 2020 2021 2022 2023Q2 18.3 24.1 25.1 24.2 25.2 2019 2020 2021 2022 2023Q2 1.3 2.0 2.4 5.7 6.7 2019 2020 2021 2022 2023Q2 Delivery Channel Changes Penns Woods Bancorp, Inc. Estatement Accounts Internet Banking Accounts Mobile Banking Accounts Accounts in thousands Source: Company documents.

20 Penns Woods Bancorp, Inc. Future Holding Company Structure Penns Woods Bancorp, Inc. Holding Company Western Region (Brand to be Determined) Blair, Cambria, Clearfield and Huntingdon Counties Jersey Shore State Bank Lycoming, Clinton, Centre, Montour, Union, Columbia, Snyder and Northumberland Counties Luzerne Bank Luzerne, Lackawanna and Wyoming Counties Northern Region (Brand to be Determined) Bradford, Tioga and Susquehanna Counties Southern Region (Brand to be Determined) Lehigh, Lebanon, Dauphin and Perry Counties

21 Strong Financial Management Penns Woods Bancorp, Inc. Culture & People Quality Loan Growth Core Deposit Growth Capital Earnings Tax Management Investment Portfolio
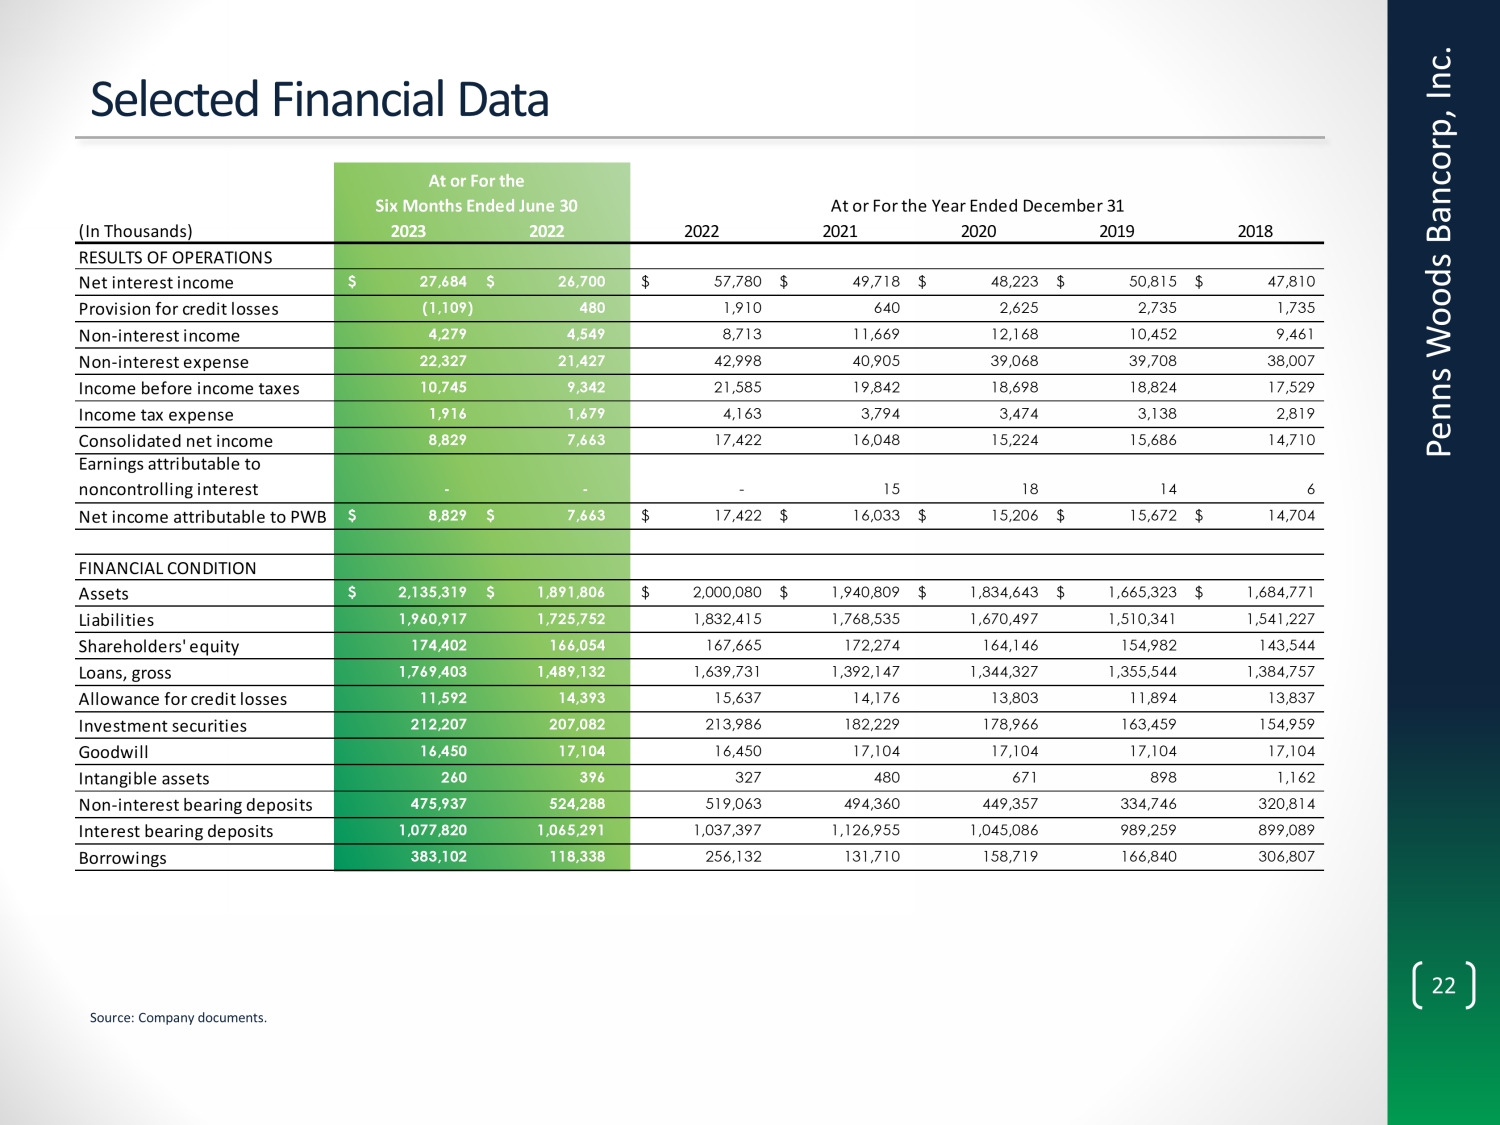
22 Selected Financial Data Penns Woods Bancorp, Inc. Source: Company documents. (In Thousands) 2023 2022 2022 2021 2020 2019 2018 RESULTS OF OPERATIONS Net interest income 27,684$ 26,700$ 57,780$ 49,718$ 48,223$ 50,815$ 47,810$ Provision for credit losses (1,109) 480 1,910 640 2,625 2,735 1,735 Non-interest income 4,279 4,549 8,713 11,669 12,168 10,452 9,461 Non-interest expense 22,327 21,427 42,998 40,905 39,068 39,708 38,007 Income before income taxes 10,745 9,342 21,585 19,842 18,698 18,824 17,529 Income tax expense 1,916 1,679 4,163 3,794 3,474 3,138 2,819 Consolidated net income 8,829 7,663 17,422 16,048 15,224 15,686 14,710 Earnings attributable to noncontrolling interest - - - 15 18 14 6 Net income attributable to PWB 8,829$ 7,663$ 17,422$ 16,033$ 15,206$ 15,672$ 14,704$ FINANCIAL CONDITION Assets 2,135,319$ 1,891,806$ 2,000,080$ 1,940,809$ 1,834,643$ 1,665,323$ 1,684,771$ Liabilities 1,960,917 1,725,752 1,832,415 1,768,535 1,670,497 1,510,341 1,541,227 Shareholders' equity 174,402 166,054 167,665 172,274 164,146 154,982 143,544 Loans, gross 1,769,403 1,489,132 1,639,731 1,392,147 1,344,327 1,355,544 1,384,757 Allowance for credit losses 11,592 14,393 15,637 14,176 13,803 11,894 13,837 Investment securities 212,207 207,082 213,986 182,229 178,966 163,459 154,959 Goodwill 16,450 17,104 16,450 17,104 17,104 17,104 17,104 Intangible assets 260 396 327 480 671 898 1,162 Non-interest bearing deposits 475,937 524,288 519,063 494,360 449,357 334,746 320,814 Interest bearing deposits 1,077,820 1,065,291 1,037,397 1,126,955 1,045,086 989,259 899,089 Borrowings 383,102 118,338 256,132 131,710 158,719 166,840 306,807 At or For the Six Months Ended June 30 At or For the Year Ended December 31

23 Per Share Metrics Penns Woods Bancorp, Inc. $2.09 $2.20 $2.16 $2.27 $2.47 $2.50 2018 2019 2020 2021 2022 2023 YTD Earnings Per Share Tangible Book Value per Share $17.80 $19.45 $20.75 $21.88 $21.38 $22.32 2018 2019 2020 2021 2022 2023Q2 Source: Company documents. Note: 2023 YTD annualized, shown through 6/30/2023.
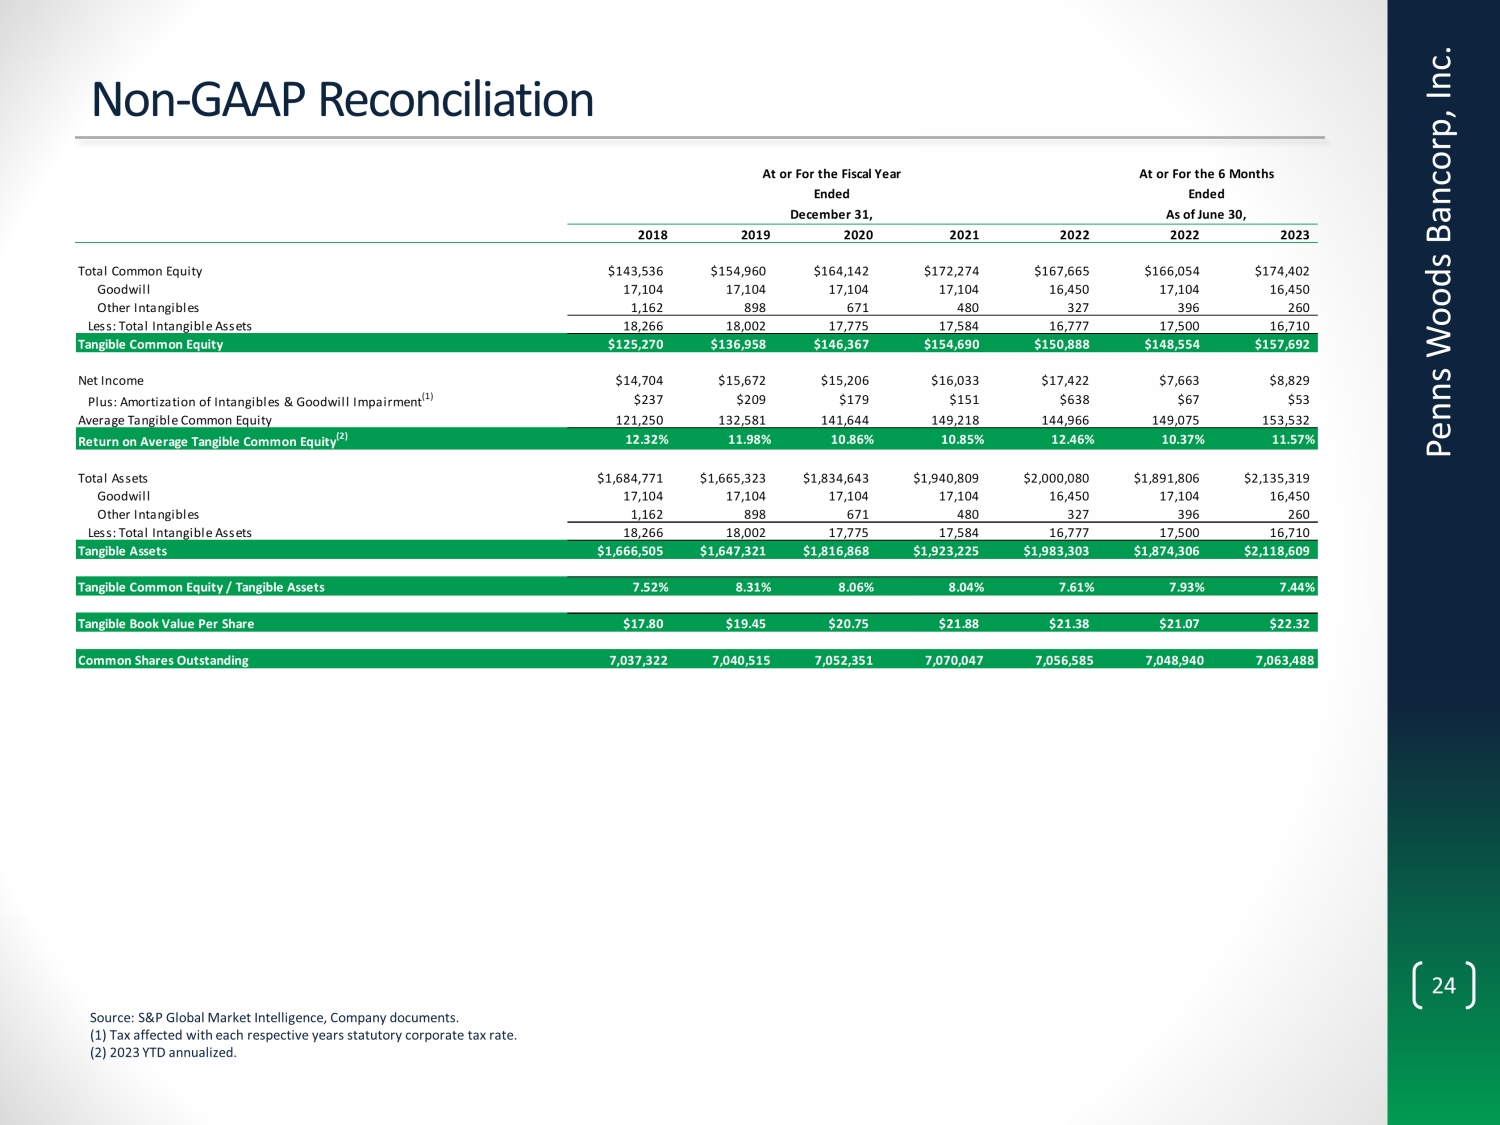
24 Non - GAAP Reconciliation Penns Woods Bancorp, Inc. Source: S&P Global Market Intelligence, Company documents. (1) Tax affected with each respective years statutory corporate tax rate. (2) 2023 YTD annualized. 2018 2019 2020 2021 2022 2022 2023 Total Common Equity $143,536 $154,960 $164,142 $172,274 $167,665 $166,054 $174,402 Goodwill 17,104 17,104 17,104 17,104 16,450 17,104 16,450 Other Intangibles 1,162 898 671 480 327 396 260 Less: Total Intangible Assets 18,266 18,002 17,775 17,584 16,777 17,500 16,710 Tangible Common Equity $125,270 $136,958 $146,367 $154,690 $150,888 $148,554 $157,692 Net Income $14,704 $15,672 $15,206 $16,033 $17,422 $7,663 $8,829 Plus: Amortization of Intangibles & Goodwill Impairment (1) $237 $209 $179 $151 $638 $67 $53 Average Tangible Common Equity 121,250 132,581 141,644 149,218 144,966 149,075 153,532 Return on Average Tangible Common Equity (2) 12.32% 11.98% 10.86% 10.85% 12.46% 10.37% 11.57% Total Assets $1,684,771 $1,665,323 $1,834,643 $1,940,809 $2,000,080 $1,891,806 $2,135,319 Goodwill 17,104 17,104 17,104 17,104 16,450 17,104 16,450 Other Intangibles 1,162 898 671 480 327 396 260 Less: Total Intangible Assets 18,266 18,002 17,775 17,584 16,777 17,500 16,710 Tangible Assets $1,666,505 $1,647,321 $1,816,868 $1,923,225 $1,983,303 $1,874,306 $2,118,609 Tangible Common Equity / Tangible Assets 7.52% 8.31% 8.06% 8.04% 7.61% 7.93% 7.44% Tangible Book Value Per Share $17.80 $19.45 $20.75 $21.88 $21.38 $21.07 $22.32 Common Shares Outstanding 7,037,322 7,040,515 7,052,351 7,070,047 7,056,585 7,048,940 7,063,488 At or For the Fiscal Year At or For the 6 Months Ended Ended December 31, As of June 30,
v3.23.2
Cover
|
Sep. 07, 2023 |
| Cover [Abstract] |
|
| Document Type |
8-K/A
|
| Amendment Flag |
true
|
| Amendment Description |
Penns Woods Bancorp, Inc. (the "Company") is filing this Current Report on Form 8-K/A solely to update slide 9 of the slide presentation, filed on September 7, 2023 with the SEC (the "Original Slide Presentation"), in order to add a footnote to indicate that the non-interest bearing deposit growth is presented on an annualized basis.
|
| Document Period End Date |
Sep. 07, 2023
|
| Entity File Number |
000-17077
|
| Entity Registrant Name |
PENNS WOODS BANCORP, INC.
|
| Entity Central Index Key |
0000716605
|
| Entity Tax Identification Number |
23-2226454
|
| Entity Incorporation, State or Country Code |
PA
|
| Entity Address, Address Line One |
300
Market Street
|
| Entity Address, Address Line Two |
P.O.
Box 967
|
| Entity Address, City or Town |
Williamsport
|
| Entity Address, State or Province |
PA
|
| Entity Address, Postal Zip Code |
17703-0967
|
| City Area Code |
570
|
| Local Phone Number |
322-1111
|
| Written Communications |
false
|
| Soliciting Material |
false
|
| Pre-commencement Tender Offer |
false
|
| Pre-commencement Issuer Tender Offer |
false
|
| Title of 12(b) Security |
Common
Stock, $5.55 par value
|
| Trading Symbol |
PWOD
|
| Security Exchange Name |
NASDAQ
|
| Entity Emerging Growth Company |
false
|
| X |
- DefinitionDescription of changes contained within amended document.
| Name: |
dei_AmendmentDescription |
| Namespace Prefix: |
dei_ |
| Data Type: |
xbrli:stringItemType |
| Balance Type: |
na |
| Period Type: |
duration |
|
| X |
- DefinitionBoolean flag that is true when the XBRL content amends previously-filed or accepted submission.
| Name: |
dei_AmendmentFlag |
| Namespace Prefix: |
dei_ |
| Data Type: |
xbrli:booleanItemType |
| Balance Type: |
na |
| Period Type: |
duration |
|
| X |
- DefinitionFor the EDGAR submission types of Form 8-K: the date of the report, the date of the earliest event reported; for the EDGAR submission types of Form N-1A: the filing date; for all other submission types: the end of the reporting or transition period. The format of the date is YYYY-MM-DD.
| Name: |
dei_DocumentPeriodEndDate |
| Namespace Prefix: |
dei_ |
| Data Type: |
xbrli:dateItemType |
| Balance Type: |
na |
| Period Type: |
duration |
|
| X |
- DefinitionThe type of document being provided (such as 10-K, 10-Q, 485BPOS, etc). The document type is limited to the same value as the supporting SEC submission type, or the word 'Other'.
| Name: |
dei_DocumentType |
| Namespace Prefix: |
dei_ |
| Data Type: |
dei:submissionTypeItemType |
| Balance Type: |
na |
| Period Type: |
duration |
|
| X |
- DefinitionAddress Line 1 such as Attn, Building Name, Street Name
| Name: |
dei_EntityAddressAddressLine1 |
| Namespace Prefix: |
dei_ |
| Data Type: |
xbrli:normalizedStringItemType |
| Balance Type: |
na |
| Period Type: |
duration |
|
| X |
- DefinitionAddress Line 2 such as Street or Suite number
| Name: |
dei_EntityAddressAddressLine2 |
| Namespace Prefix: |
dei_ |
| Data Type: |
xbrli:normalizedStringItemType |
| Balance Type: |
na |
| Period Type: |
duration |
|
| X |
- Definition
+ References
+ Details
| Name: |
dei_EntityAddressCityOrTown |
| Namespace Prefix: |
dei_ |
| Data Type: |
xbrli:normalizedStringItemType |
| Balance Type: |
na |
| Period Type: |
duration |
|
| X |
- DefinitionCode for the postal or zip code
| Name: |
dei_EntityAddressPostalZipCode |
| Namespace Prefix: |
dei_ |
| Data Type: |
xbrli:normalizedStringItemType |
| Balance Type: |
na |
| Period Type: |
duration |
|
| X |
- DefinitionName of the state or province.
| Name: |
dei_EntityAddressStateOrProvince |
| Namespace Prefix: |
dei_ |
| Data Type: |
dei:stateOrProvinceItemType |
| Balance Type: |
na |
| Period Type: |
duration |
|
| X |
- DefinitionA unique 10-digit SEC-issued value to identify entities that have filed disclosures with the SEC. It is commonly abbreviated as CIK. Reference 1: http://www.xbrl.org/2003/role/presentationRef
-Publisher SEC
-Name Exchange Act
-Number 240
-Section 12
-Subsection b-2
| Name: |
dei_EntityCentralIndexKey |
| Namespace Prefix: |
dei_ |
| Data Type: |
dei:centralIndexKeyItemType |
| Balance Type: |
na |
| Period Type: |
duration |
|
| X |
- DefinitionIndicate if registrant meets the emerging growth company criteria. Reference 1: http://www.xbrl.org/2003/role/presentationRef
-Publisher SEC
-Name Exchange Act
-Number 240
-Section 12
-Subsection b-2
| Name: |
dei_EntityEmergingGrowthCompany |
| Namespace Prefix: |
dei_ |
| Data Type: |
xbrli:booleanItemType |
| Balance Type: |
na |
| Period Type: |
duration |
|
| X |
- DefinitionCommission file number. The field allows up to 17 characters. The prefix may contain 1-3 digits, the sequence number may contain 1-8 digits, the optional suffix may contain 1-4 characters, and the fields are separated with a hyphen.
| Name: |
dei_EntityFileNumber |
| Namespace Prefix: |
dei_ |
| Data Type: |
dei:fileNumberItemType |
| Balance Type: |
na |
| Period Type: |
duration |
|
| X |
- DefinitionTwo-character EDGAR code representing the state or country of incorporation.
| Name: |
dei_EntityIncorporationStateCountryCode |
| Namespace Prefix: |
dei_ |
| Data Type: |
dei:edgarStateCountryItemType |
| Balance Type: |
na |
| Period Type: |
duration |
|
| X |
- DefinitionThe exact name of the entity filing the report as specified in its charter, which is required by forms filed with the SEC. Reference 1: http://www.xbrl.org/2003/role/presentationRef
-Publisher SEC
-Name Exchange Act
-Number 240
-Section 12
-Subsection b-2
| Name: |
dei_EntityRegistrantName |
| Namespace Prefix: |
dei_ |
| Data Type: |
xbrli:normalizedStringItemType |
| Balance Type: |
na |
| Period Type: |
duration |
|
| X |
- DefinitionThe Tax Identification Number (TIN), also known as an Employer Identification Number (EIN), is a unique 9-digit value assigned by the IRS. Reference 1: http://www.xbrl.org/2003/role/presentationRef
-Publisher SEC
-Name Exchange Act
-Number 240
-Section 12
-Subsection b-2
| Name: |
dei_EntityTaxIdentificationNumber |
| Namespace Prefix: |
dei_ |
| Data Type: |
dei:employerIdItemType |
| Balance Type: |
na |
| Period Type: |
duration |
|
| X |
- DefinitionLocal phone number for entity.
| Name: |
dei_LocalPhoneNumber |
| Namespace Prefix: |
dei_ |
| Data Type: |
xbrli:normalizedStringItemType |
| Balance Type: |
na |
| Period Type: |
duration |
|
| X |
- DefinitionBoolean flag that is true when the Form 8-K filing is intended to satisfy the filing obligation of the registrant as pre-commencement communications pursuant to Rule 13e-4(c) under the Exchange Act. Reference 1: http://www.xbrl.org/2003/role/presentationRef
-Publisher SEC
-Name Exchange Act
-Number 240
-Section 13e
-Subsection 4c
| Name: |
dei_PreCommencementIssuerTenderOffer |
| Namespace Prefix: |
dei_ |
| Data Type: |
xbrli:booleanItemType |
| Balance Type: |
na |
| Period Type: |
duration |
|
| X |
- DefinitionBoolean flag that is true when the Form 8-K filing is intended to satisfy the filing obligation of the registrant as pre-commencement communications pursuant to Rule 14d-2(b) under the Exchange Act. Reference 1: http://www.xbrl.org/2003/role/presentationRef
-Publisher SEC
-Name Exchange Act
-Number 240
-Section 14d
-Subsection 2b
| Name: |
dei_PreCommencementTenderOffer |
| Namespace Prefix: |
dei_ |
| Data Type: |
xbrli:booleanItemType |
| Balance Type: |
na |
| Period Type: |
duration |
|
| X |
- DefinitionTitle of a 12(b) registered security. Reference 1: http://www.xbrl.org/2003/role/presentationRef
-Publisher SEC
-Name Exchange Act
-Number 240
-Section 12
-Subsection b
| Name: |
dei_Security12bTitle |
| Namespace Prefix: |
dei_ |
| Data Type: |
dei:securityTitleItemType |
| Balance Type: |
na |
| Period Type: |
duration |
|
| X |
- DefinitionName of the Exchange on which a security is registered. Reference 1: http://www.xbrl.org/2003/role/presentationRef
-Publisher SEC
-Name Exchange Act
-Number 240
-Section 12
-Subsection d1-1
| Name: |
dei_SecurityExchangeName |
| Namespace Prefix: |
dei_ |
| Data Type: |
dei:edgarExchangeCodeItemType |
| Balance Type: |
na |
| Period Type: |
duration |
|
| X |
- DefinitionBoolean flag that is true when the Form 8-K filing is intended to satisfy the filing obligation of the registrant as soliciting material pursuant to Rule 14a-12 under the Exchange Act. Reference 1: http://www.xbrl.org/2003/role/presentationRef
-Publisher SEC
-Name Exchange Act
-Section 14a
-Number 240
-Subsection 12
| Name: |
dei_SolicitingMaterial |
| Namespace Prefix: |
dei_ |
| Data Type: |
xbrli:booleanItemType |
| Balance Type: |
na |
| Period Type: |
duration |
|
| X |
- DefinitionTrading symbol of an instrument as listed on an exchange.
| Name: |
dei_TradingSymbol |
| Namespace Prefix: |
dei_ |
| Data Type: |
dei:tradingSymbolItemType |
| Balance Type: |
na |
| Period Type: |
duration |
|
| X |
- DefinitionBoolean flag that is true when the Form 8-K filing is intended to satisfy the filing obligation of the registrant as written communications pursuant to Rule 425 under the Securities Act. Reference 1: http://www.xbrl.org/2003/role/presentationRef
-Publisher SEC
-Name Securities Act
-Number 230
-Section 425
| Name: |
dei_WrittenCommunications |
| Namespace Prefix: |
dei_ |
| Data Type: |
xbrli:booleanItemType |
| Balance Type: |
na |
| Period Type: |
duration |
|
Penns Woods Bancorp (NASDAQ:PWOD)
Historical Stock Chart
From Jun 2024 to Jul 2024

Penns Woods Bancorp (NASDAQ:PWOD)
Historical Stock Chart
From Jul 2023 to Jul 2024
