| 21
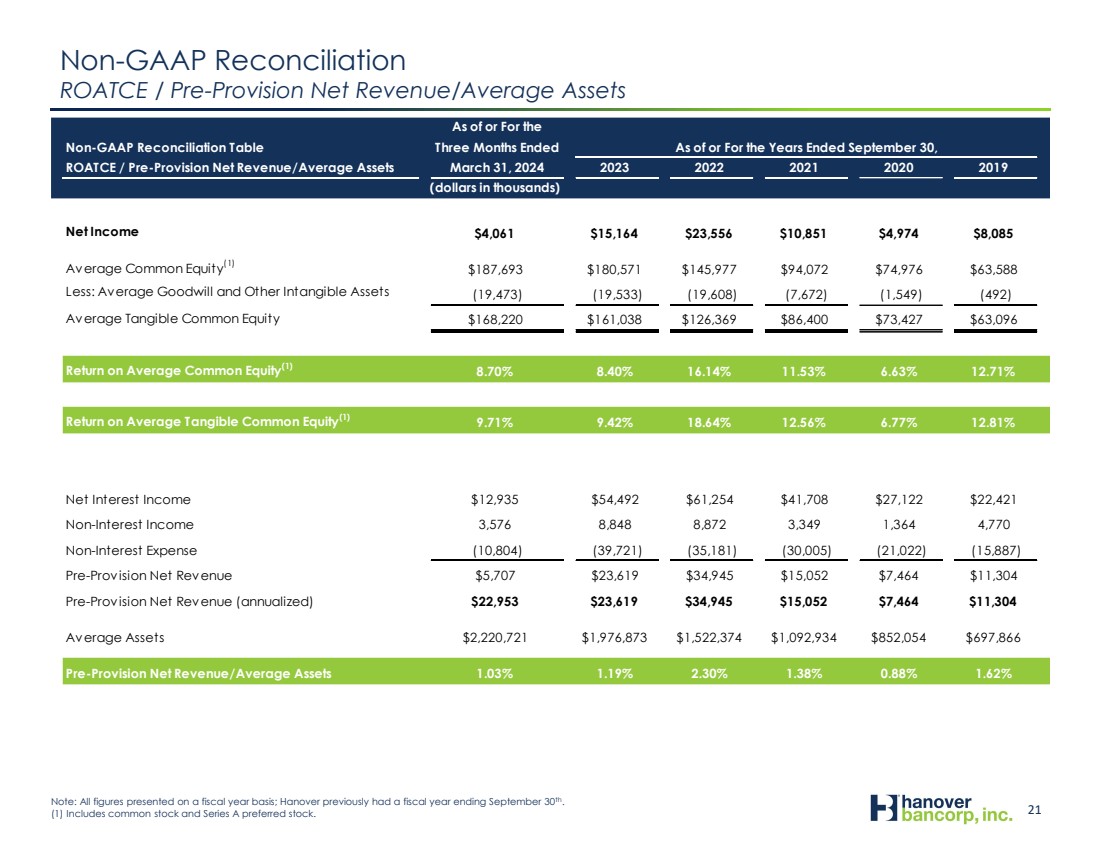
Non-GAAP Reconciliation
ROATCE / Pre-Provision Net Revenue/Average Assets
As of or For the
Non-GAAP Reconciliation Table Three Months Ended As of or For the Years Ended September 30,
ROATCE / Pre-Provision Net Revenue/Average Assets March 31, 2024 2023 2022 2021 2020 2019
(dollars in thousands)
Net Income $4,061 $15,164 $23,556 $10,851 $4,974 $8,085
Average Common Equity(1) $187,693 $180,571 $145,977 $94,072 $74,976 $63,588
Less: Average Goodwill and Other Intangible Assets (19,473) (19,533) (19,608) (7,672) (1,549) (492)
Average Tangible Common Equity $168,220 $161,038 $126,369 $86,400 $73,427 $63,096
Return on Average Common Equity(1) 8.70% 8.40% 16.14% 11.53% 6.63% 12.71%
Return on Average Tangible Common Equity(1) 9.71% 9.42% 18.64% 12.56% 6.77% 12.81%
Net Interest Income $12,935 $54,492 $61,254 $41,708 $27,122 $22,421
Non-Interest Income 3,576 8,848 8,872 3,349 1,364 4,770
Non-Interest Expense (10,804) (39,721) (35,181) (30,005) (21,022) (15,887)
Pre-Provision Net Revenue $5,707 $23,619 $34,945 $15,052 $7,464 $11,304
Pre-Provision Net Revenue (annualized) $22,953 $23,619 $34,945 $15,052 $7,464 $11,304
Average Assets $2,220,721 $1,976,873 $1,522,374 $1,092,934 $852,054 $697,866
Pre-Provision Net Revenue/Average Assets 1.03% 1.19% 2.30% 1.38% 0.88% 1.62%
Note: All figures presented on a fiscal year basis; Hanover previously had a fiscal year ending September 30th
..
(1) Includes common stock and Series A preferred stock. |