Potential $1.76 Trillion in Working Capital
Opportunity Revealed
The Hackett Group, Inc., (NASDAQ: HCKT) reports that for the
first time in a decade, the largest publicly traded companies in
the U.S. have experienced simultaneous degradation across all major
working capital metrics, according to their new research. This
triple threat points to a critical turning point, revealing a
staggering $1.76 trillion in untapped working capital opportunity,
stressing the urgency for companies to optimize and free up cash
amidst ongoing economic uncertainties.
After a year of growth despite inflationary and recessionary
risks, the largest U.S. companies experienced a dramatic shift in
2023. For the first time in a decade, an analysis of data from
1,000 of the largest U.S. public companies showed that all three
key working capital metrics – days sales outstanding (DSO), days
inventory outstanding (DIO) and days payables outstanding (DPO) –
deteriorated simultaneously. DSO increased by 3% to 40.1 days and
DIO saw a slight rise of 0.01 days, while DPO declined by 0.1 days,
highlighting a significant shift in the financial and operational
performance of the largest publicly traded companies in the
country.
This presents a concerning trend for businesses because
macroeconomic uncertainties and inflationary pressures are expected
to persist, imposing additional external constraints on working
capital. This effect is compounded by persistently higher interest
rates, significantly increasing the carrying cost of money trapped
in working capital compared to previous years. As a result,
redoubling efforts on working capital optimization is more urgent
than ever before to navigate the increasingly volatile market
conditions effectively.
Equally alarming is the softening of aggregate revenue figures.
Over the past decade, excluding the pandemic year, revenue has
averaged a 10% year-over-year increase. However, this year has seen
a stark contrast, with revenue growth remaining essentially flat at
just a 0.3% increase. This trend illustrates the complex dynamic
between efforts to manage inflation and the risk of economic
stagnation due to high interest rates.
The widening gap between best-in-class and median companies
continued to expand, driven primarily by the significant
improvements of top performers rather than the degradation of
median ones. Historically, the ratio of top-to-median performance
has averaged around 2.95-to-1, but this year it has increased by 8%
to reach a record 3.2-to-1.
“This widening gap underscores the imperative for businesses to
diligently manage their financial resources to remain competitive.
As the disparity grows, so does the opportunity for competitive
advantage,” said Istvan Bodo, director of Strategy and Operations
at The Hackett Group.
One of the most notable changes is the substantial degradation
in DSO, which increased by 3% this year to reach 40.1 days, marking
the first time since the pandemic began that DSO has shown
degradation. It’s essential to note, however, that the gains from
the previous two years more than offset this year’s degradation,
resulting in DSO performance comparable to the pre-pandemic average
of around 40 days. Additionally, industries with a heavy
business-to-business focus lead the pack in DSO degradation,
potentially signaling a leverage shift to buyers within these
sectors, emphasizing the evolving dynamics of supplier-customer
relationships in response to changing market conditions.
DIO saw a slight rise of 0.01 days, marking its first
degradation since the pandemic. Despite this marginal increase, DIO
remains significantly improved from the pandemic peak of nearly 58
days. Industries with the most significant downturn in inventory
performance were those heavily dependent on energy in their cost of
goods sold, reflecting potential advance buying to hedge against
geopolitical uncertainties.
DPO declined by 0.1 days this year, continuing a trend of
deterioration seen since the pandemic, with an overall 7% decline,
particularly for industries relying on high-tech equipment – like
computer chips – where the leverage is still with the suppliers
given the supply constraints in that sector.
Additionally, The Hackett Group’s research identified $1.76
trillion in untapped working capital opportunity, emphasizing the
need for finance executives to proactively partner with internal
business partners to optimize working capital across the balance
sheet. In the face of persistent macroeconomic uncertainties and
inflationary pressures, the need for effective working capital
management is more critical than ever. With the transformation
generative artificial intelligence (Gen AI) will have on business
operations, organizations must target and prioritize Gen AI
capabilities to optimize the revenue and disbursement cycles, and
better anticipate customer demand and inventory needs.
“Gen AI will provide new enablement opportunities that will
enhance working capital management across the board,” said Shawn
Townsend, director of Strategy and Operations at The Hackett Group.
“Leading businesses will use Gen AI to improve cash flow
forecasting accuracy, predict optimal inventories that meet
ever-changing customer demand, develop more robust just-in-time
sourcing demand planning and more.”
The increased carrying cost of money trapped in working capital,
driven by high interest rates, underscores the necessity for
companies to intensify their efforts to optimize working capital
and effectively navigate volatile market conditions.
The Hackett Group’s 2024 Working Capital Survey is currently
featured on CFO.com. A summary of the research findings, including
detailed industry analysis and working capital improvement
recommendations, is available on a complimentary basis, with
registration.
About The Hackett Group
The Hackett Group, Inc. (NASDAQ: HCKT) is an IP-based, Gen AI
strategic consulting and executive advisory firm that enables
Digital World Class® performance. Using AI XPLR™ – our AI
assessment platform – our experienced professionals guide
organizations to harness the power of Gen AI to digitally transform
their operations and achieve quantifiable, breakthrough results,
allowing us to be key architects of their Gen AI journey.
Our expertise is grounded in unparalleled best practices
insights from benchmarking the world’s leading businesses –
including 97% of the Dow Jones Industrials, 89% of the Fortune 100,
70% of the DAX 40 and 55% of the FTSE 100 – and are delivered
leveraging our Digital Transformation Platform, Hackett Connect™
and Quantum Leap®.
For more information on The Hackett Group, visit:
https://www.thehackettgroup.com/ or email:
media@thehackettgroup.com.
Trademarks
The Hackett Group, quadrant logo, Quantum Leap and Digital World
Class are the registered marks of The Hackett Group.
Cautionary Statement Regarding “Forward-Looking”
Statements
This release contains “forward-looking” statements within the
meaning of Section 27A of the Securities Act of 1933 as amended and
Section 21E of the Securities Exchange Act of 1934, as amended.
Statements including without limitation, words such as “expects,”
“anticipates,” “intends,” “plans,” “believes,” seeks,” “estimates,”
or other similar phrases or variations of such words or similar
expressions indicating, present or future anticipated or expected
occurrences or outcomes are intended to identify such
forward-looking statements. Forward-looking statements are not
statements of historical fact and involve known and unknown risks,
uncertainties and other factors that may cause the Company’s actual
results, performance or achievements to be materially different
from the results, performance or achievements expressed or implied
by the forward-looking statements. Factors that may impact such
forward-looking statements include without limitation, the ability
of The Hackett Group to effectively market its digital
transformation, artificial intelligence, and other consulting
services, competition from other consulting and technology
companies that may have or develop in the future, similar
offerings, the commercial viability of The Hackett Group and its
services as well as other risk detailed in The Hackett Group’s
reports filed with the United States Securities and Exchange
Commission. The Hackett Group does not undertake any duty to update
this release or any forward-looking statements contained
herein.
View source
version on businesswire.com: https://www.businesswire.com/news/home/20240829955745/en/
media@thehackettgroup.com
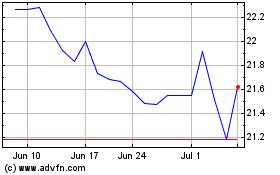
Hackett (NASDAQ:HCKT)
Historical Stock Chart
From Dec 2024 to Jan 2025

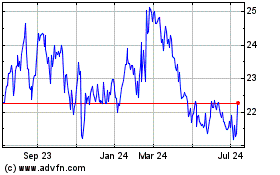
Hackett (NASDAQ:HCKT)
Historical Stock Chart
From Jan 2024 to Jan 2025
