Forget UNG: Try These Natural Gas ETFs Instead - Commodity ETFs
December 14 2011 - 4:17AM
Zacks
Although concerns over the long-term impact of fracking are ever
present in the natural gas marketplace, many are beginning to see
the potential for the fuel to help wean America off of its foreign
oil addiction. The U.S. remains in the top two for production of
the fuel and has reserves that are only exceeded by five other
countries. This suggests that while oil may be in increasingly
short supply, natural gas has a near limitless potential to become
the fuel of choice for investors and consumers alike.
Thanks to these trends, some have decided to take a closer look
at putting assets to work in this interesting space with many
settling in on the United States Natural Gas ETF (UNG). The fund
looks to track the changes in the price of natural gas delivered at
the Henry Hub, Louisiana as measured by the changes in futures
prices traded on the NYMEX. The product will follow contracts that
are the near month to expire unless the nearest month is within two
weeks to expire. UNG is by far the most popular natural gas ETF on
the market today as the fund has more than $1.2 billion in assets
and average daily volume of just over 15.1 million shares. Yet,
while UNG may be extremely popular, any investor who has stayed in
the fund over the long term is likely to have been disappointed
with its performance (see Is USCI The Best Commodity ETF?).
In year-to-date terms, UNG is down 40.4% and over the past three
years the fund has lost 84.5% of its total value. While the natural
gas market has been weak, prices of natural gas per thousand cubic
feet have only lost about 18% in comparison on the year. The main
reason for this disconnect is the market phenomenon known as
contango, which can lead many investors to heavier losses than what
an investment in spot prices would suggest.
Contango & ETFs
In this situation, prices for futures contracts are trading at a
level of, for example, $4/mmBtu. for natural gas while the spot
price is around $3.5/mmBtu. As the contract gets closer to
expiration, the futures contract price converges towards the spot
price, pushing the contract towards $3.5/mmBtu. At this point, an
investor will roll out of a position and buy another contract,
expiring in a later month in order to avoid delivery of the product
in question. When investors do this in a contangoed market, the
price of the futures contract will again be higher than the spot
price, creating a loop of potential losses that can be built-in to
the market when a particular futures contract is experiencing
contango, unless of course the gains in the commodity are enough to
override this structural issue (read ETFs vs. ETNs: What’s The
Difference?).
While this situation is pretty much impossible to avoid when a
market is in contango, there a few ways that investors can try to
mitigate the issue. Chief among them is buying contracts with
varying maturities and only cycling over a small portion of the
basket at any one time. This avoids the issue of front-running and
it helps to lessen the blow of a month that is experiencing heavy
contango as well. For investors seeking to take a closer look at
funds that try to implement a methodology that keeps these ideas in
mind, either of these UNG alternatives could make for an
interesting choice:
United States 12 Month natural Gas Fund
(UNL)
Unlike UNG which only holds front-month contracts, this ETF
spreads its exposure across the maturity curve. In fact, the fund
consists of 12 natural gas futures contracts consisting of the near
month security as well as the next eleven months. This can help cut
down on contango because only 1/12th of the portfolio is
rolled at any one time and a month of heavy contango will only
impact a small portion of the holdings. Thanks to this focus, UNL
has lost 34.7% so far in 2011 and 53.6% over the past three years.
While these are obviously both pretty bad metrics, they are quite
impressive when compared to UNG, showing how powerful the impact of
contango can be on a portfolio of commodity securities (see Three
Best Gold ETFs).
Teucrium Natural Gas Fund (NAGS)
For investors seeking a new way to play the natural gas market,
NAGS could be an interesting choice. The product invests in futures
contracts in the nearest to spot month for the following four
periods; March, April, October, and November. All four months are
weighted equally giving the fund balanced exposure across these key
delivery dates. These four were chosen in particular because they
give the fund a focus on the key times in the natural gas season at
both the end of and beginning of the heating and cooling
seasons.
This method has had a spotty trading performance since its
launch earlier in the year as the product has underperformed since
inception, but it has outperformed its counterparts over the past
three months. Nonetheless, it is important to remember that all
three products track the same futures; the only difference is the
date until expiration for the contracts in the portfolio and the
weights given to these securities. Given how drastically different
products have performed tracking the same futures in different
ways, investors should realize how important the issue of contango
can be in a futures-based investment. Arguably, an investor’s
thoughts on the subject of the futures curve can be just as
important, if not more so, than a view on the underlying commodity,
making products like NAGS and UNL intriguing choices when the
futures curve is experiencing heavy contango in the natural gas
space (see Top Three Precious Metal Mining ETFs).
Want the latest recommendations from Zacks Investment Research?
Today, you can download 7 Best Stocks for the Next 30
Days. Click to get this free report >>
Zacks Investment Research
Want the latest recommendations from Zacks Investment Research?
Today, you can download 7 Best Stocks for the Next 30 Days. Click
to get this free report
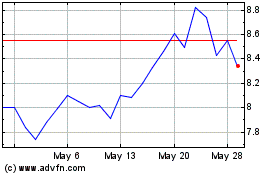
United States 12 Month N... (AMEX:UNL)
Historical Stock Chart
From Jun 2024 to Jul 2024

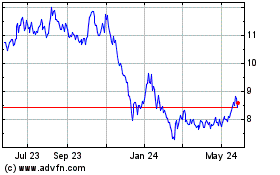
United States 12 Month N... (AMEX:UNL)
Historical Stock Chart
From Jul 2023 to Jul 2024
