As market volatility picks up, the following three healthcare stocks — each with recent analysts’ upgrades/downgrades — might help your portfolio weather the storm. Let’s see what GlaxoSmithKline (NYSE: GSK), Merck (NYSE: MRK), and Novartis (NYSE: NVS) have to offer.
GlaxoSmithKline
GlaxoSmithKline has a market cap of $108.5 billion. Its shares fell 1.97% to close at $44.25 on Feb. 25. GlaxoSmithKline had been trading in the range of $41.68-$47.69 in the past 52 weeks. GlaxoSmithKline has a low beta of 0.64.
On January 29, 2013, Barclays upgraded GlaxoSmithKline from Equalweight to Overweight. Analysts have a mean target price of $47.09 and a median target price of $46.00 for GlaxoSmithKline. Analysts are estimating the growth rate of 6.05% for the next 5 year (per annum).
There are a few positive factors for GlaxoSmithKline:
- Higher operating margin of 27.6% and net margin of 18.6% (vs. the industry average of 22.3% and 16.4%)
- Higher ROE of 72.5 (vs. the average of 17.2)
- Lower P/E of 15.1 (vs. the industry average of 18.0)
- GSK generates an operating cash flow of $7.03B with a levered free cash flow of $5.55B
- GSK offers an annual dividend yield of 5.20%
Technically, the MACD (12, 26, 9) is showing a bearish trend and the MACD difference diverged. The momentum indicator, RSI (14), is declining and indicating a bearish lean at 45.62. GlaxoSmithKline is currently trading above its 50-day MA of $43.98 and 200-day MA of $43.88, as seen from the chart below.
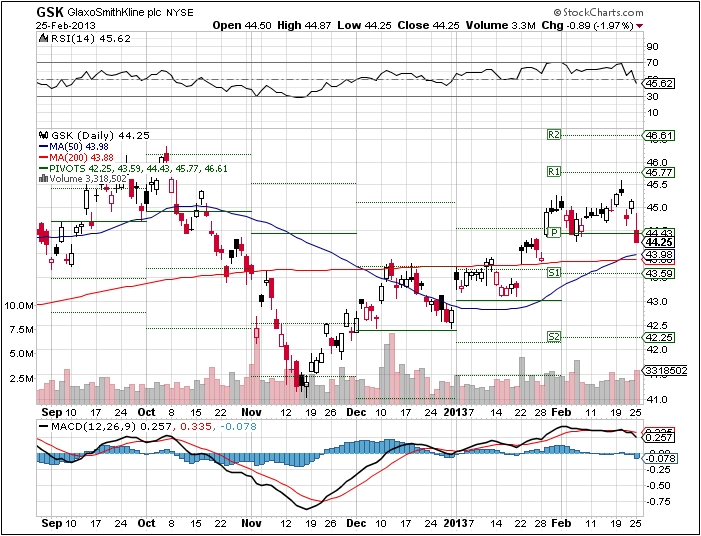
Source: StockCharts.com
Merck & Co Inc.
Merck & Co Inc. has a market cap of $129.26B. Merck was down 1.05% and closed at $42.52 on February 25, 2013. Merck had been trading in the range of $36.91-$48.00 in the past 52 weeks. Merck has a very low beta of 0.32.
On February 4, 2013, Morgan Stanley downgraded Merck from Equalweight to Underweight. On the same day, Leerink Swann also downgraded Merck from Outperform to Market Perform and cited,
” (1) reduced prospects with the delay/uncertainty around odanacatib, (2) increasing 2013+ competition vs. Januvia & Isentress as well as the outcome of Germany’s (G-BA/AMNOG) planned assessment of DPP-IV inhibitors, (3) ongoing investor concerns around the Zetia/Vytorin franchise that likely will cap share appreciation until IMPROVE-IT completes either in March 2013 or 2H14, and (4) a relatively high-risk Phase II/III pipeline including anacetrapib (CETP inhibitor) and BACE (Alzheimer’s) that are several years from the market.”
Despite the recent downgrades, analysts have an overall Neutral rating with an average price target of $45.20 for Merck (higher than Merck’s current price), according to StreetInsder.com. Another result from Yahoo! Finance showed the mean target of $48.43 and median target of $47.00 for Merck. For fiscal 2013, analysts are expecting an EPS of $3.65 with revenue of $46.12B, which is 2.4% lower than 2012. Analysts are projecting an EPS of $3.80 with revenue of $46.65B for 2014.
There are a few positive factors for Merck:
- Higher revenue growth (3 year average) of 26.3 (vs. the industry average of 6.9)
- Lower debt/equity of 0.3 (vs. the average of 0.4)
- Lower P/B and P/S of 2.3 and 2.8 (vs. the industry averages of 3.1 and 2.9)
- Lower Forward P/E of 11.5 (vs. the S&P 500’s average of 14.0)
- MRK generates an operating cash flow of $11.4B
- MRK currently offers an annual dividend yield of 4.00%
Technically, the MACD (12, 26, 9) indicator is showing a bullish trend. RSI (14) is indicating a slightly bullish lean at 53.28. Merck is currently trading above its 50-day MA of $42.37 and 200-day MA of $42.20. The next resistance is $44.37, the R1 pivot point, followed by $45.48, the R2 pivot point, as seen from the chart below.
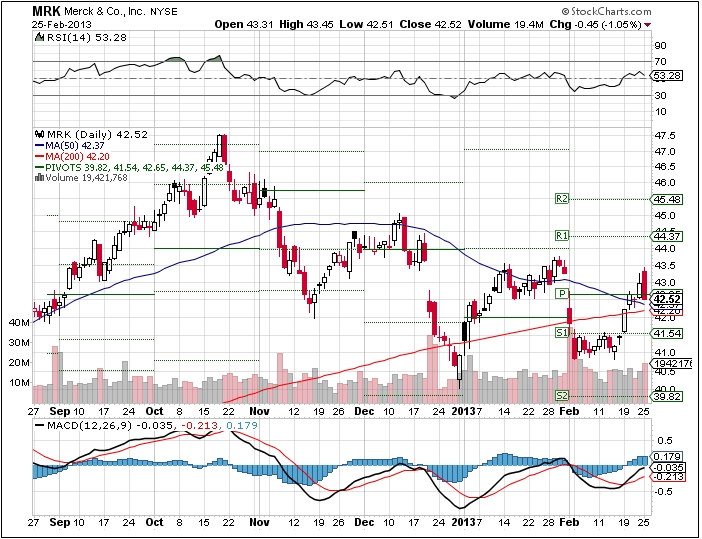
Source: StockCharts.com
Novartis AG
Novartis AG has a market cap of $167.26B. Novartis was down 0.14% and closed at $69.10 on February 25, 2013. Novartis had been trading in the range of $51.20-$70.24 in the past 52 weeks. Novartis has a low beta of 0.55.
On January 23, 2013, Citi upgraded Novartis from Neutral to Buy. Analysts have a mean price target of $70.00 and a median price target of 71.00. Analysts are expecting an EPS of $1.27 with revenue of $13.90B for the current quarter ending in March, 2013. For 2013, analysts are estimating an EPS of $5.14 with revenue of $57.32B, which is 1.10% higher than 2012.
There are a few positive factors for Novartis:
- Higher revenue growth (3 year average) of 8.5 (vs. the industry average of 6.9)
- Higher net margin of 16.5% (vs. the industry average of 16.4%)
- Lower debt/equity of 0.2 (vs. the average of 0.4)
- Lower P/E and P/B of 17.8 and 2.4 (vs. the industry average of 18.0 and 3.1)
- Lower Forward P/E of 11.9 (vs. the S&P 500’s average of 14.0)
- NVS generates an operating cash flow of $14.19B with a levered free cash flow of $10.10B
- NVS currently offers an annual dividend yield of 3.66%
Technically, the MACD (12, 26, 9) indicator is showing a bearish trend and the MACD difference is diverging. RSI (14) is indicating a bullish lean at 62.47. Novartis is currently trading above its 50-day MA of $66.10 and 200-day MA of $60.14. The next resistance is $69.66, the R1 pivot point, followed by $71.51, the R2 pivot point, as seen from the chart below.

Source: StockCharts.com
How to Invest
While all three stocks are great long-term holdings with strong cash flow and solid fundamentals, investors may want to wait for positive technical signs to establish the long-term position for GlaxoSmithKline. For Merck, our last reviewed credit put spread position of April 20, 2013 $36/$40 put is currently yielding 12.07% return on margin. For investors looking forward to establishing a new option position, a credit put spread of July 20, 2013 $37/$40 put can be reviewed. Lastly, for Novartis, a credit put spread of April 20, 2013 $60/$62.5 can be reviewed to gain upside credit premium or to acquire Novartis stock at a price below $62.5.
Note: All prices are quoted from the closing of February 25, 2013 and all calculations are before fees and expenses. Investors and traders are recommended to do their own due diligence and research before making any trading/investing decisions.