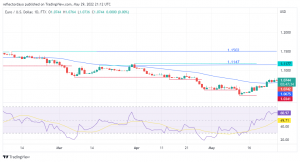
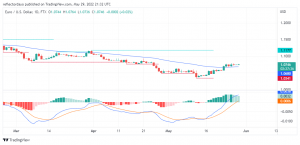
Looking at the daily chart of the 9-day moving average, we see the price action performing above the moving average curve. However, EURO/USD continues to struggle at $1.0700. At this point, there is a strong battle between buyers and sellers for market control. The up trending in the market may be due to inflation in the U.S.

Resistance levels = 1.1502. 1.1147,1.1177
Support levels = 1.0769, 1.0482, 1.0339
According to the Relative Price index (RSI), the market is performing well above 50% level. The RSI reading is precisely at 61.18%. This indicates an up-trend performance.

The histogram of the MACD is also performing well above point 0. The faster moving average curve and the slower moving average curve are considerably far from each other. By this, the implication is that the uptrend should continue for a while.
However, it seems like the price is pegged at $1.0700. More buyers are needed to push the price up. According to the Personal Consumer Expenditure (PCE), the index shows a drop from 5.2% to 4.9%, confirming their expectation or forecast for the year. This is affecting the US dollar.
By the indications from the chart, the value of the pair may continue to rise. It may reach up to the resistance level of $1.1177.
Teach yourself Technical Analysis: Technical Analysis


