Molins PLC Final Results -6-
February 26 2014 - 2:01AM
UK Regulatory
Geographical information
                                          Revenue
                                 (by location of customer)
                         ----------------------------------------
                           2013       2013        2012       2012
                           GBPm          %        GBPm          %

 UK                         9.8          9         6.9          7
  USA                      27.9         27        24.1         26
   Europe (excl. UK)       23.5         22        21.1         23
  Americas (excl. USA)      9.5          9         9.4         10
   Africa                   7.3          7         6.4          7
  Asia                     27.2         26        25.1         27
                         ------      -----      ------      -----
                          105.2        100        93.0        100
                         ======      =====      ======      =====
3. Charges classified as non-underlying items were incurred in
respect of reorganisation of GBP0.1m (2012: GBP1.0m),
administration costs of the Group's defined benefit pension schemes
of GBP0.8m (2012: GBP0.8m), which were paid for out of the assets
of those schemes, and the financial expense on pension scheme
balances of GBP0.7m (2012: GBP0.1m). In addition, in the year to 31
December 2012 a credit of GBP1.5m was recorded relating to the
cessation of future benefit accruals from December 2012 in the
Group's UK defined benefit pension scheme. Cash payments of GBP0.7m
were made in 2013 (2012: GBP0.5m) in respect of reorganisation in
earlier periods, of which GBP0.2m (2012: GBP0.3m) was paid to the
UK defined benefit pension scheme.
4. The Group accounts for pensions under IAS 19 Employee
benefits. The 2013 accounting valuation of the UK defined benefit
pension scheme was carried out as at 31 December 2013 based on the
funding valuation carried out as at 30 June 2012, updated to
reflect conditions existing at the 2013 year end and to reflect the
specific requirements of IAS 19. The smaller USA defined benefit
pension schemes were valued as at 31 December 2013 using actuarial
data as of 1 January 2013, updated for conditions existing as at
the year end. Profit before tax includes charges in respect of the
defined benefit pension schemes' administration costs of GBP0.8m
(2012: GBP0.8m) and financing expense on pension scheme balances of
GBP0.7m (2012: GBP0.1m). Also included within profit before tax in
the 12 months to 31 December 2012 were credits totalling GBP1.5m in
respect of actions taken within the Group's defined benefit pension
scheme in the UK. Payments to the Group's UK defined benefit
pension scheme in the period included GBP1.5m in respect of the
agreed deficit recovery plan.
5. Basic earnings per ordinary share is based upon the profit
for the period of GBP3.5m (2012: GBP3.8m) and on a weighted average
of 19,399,424 shares in issue during the year (2012: 19,067,302).
The weighted average number of shares excludes shares held by the
employee trust in respect of the Company's long-term incentive
arrangements.
Underlying earnings per ordinary share amounted to 23.9p for the
year (2012: 21.8p) and is based on underlying profit for the period
of GBP4.6m (2012: GBP4.1m), which is calculated on profit before
non-underlying items.
6. Employee benefits include the net pension liability of the UK
defined benefit pension scheme of GBP2.5m (2012: GBP13.9m) and the
net pension liability of the USA defined benefit pension schemes of
GBP3.1m (2012: GBP5.3m), all figures before tax.
   7.      Reconciliation of net cash flow to movement in net funds

                                                     2013         2012
                                                     GBPm         GBPm
 Net increase in cash and cash equivalents            2.3          1.3
  Cash inflow from movement in borrowings           (4.2)        (0.7)
                                                  -------      -------
 Change in net funds resulting from                 (1.9)          0.6
  cash flows
                                                    (0.3)        (0.3)
  Translation movements
                                                  -------      -------
 Movement in net funds in the period                (2.2)          0.3

  Opening net funds                                   7.4          7.1
                                                  -------      -------
 Closing net funds                                    5.2          7.4
                                                  =======      =======

   8.      Analysis of net funds

                                                  2013         2012
                                                  GBPm         GBPm
 Cash and cash equivalents - current              15.0         13.3
  assets
  Interest-bearing loans and borrowings          (9.8)        (5.9)
   - non-current liabilities
                                               -------      -------
 Closing net funds                                 5.2          7.4
                                               =======      =======
9. The Annual Report and Accounts will be sent to all
shareholders in March 2014 and copies will be available on the
Group's website at www.molins.com, or from the Company's registered
office at Rockingham Drive, Linford Wood East, Milton Keynes MK14
6LY.
This information is provided by RNS
The company news service from the London Stock Exchange
END
FR SEMFAIFLSEEE
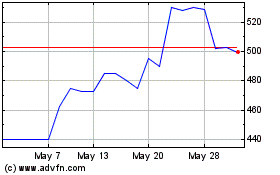
Mpac (LSE:MPAC)
Historical Stock Chart
From Jul 2024 to Aug 2024

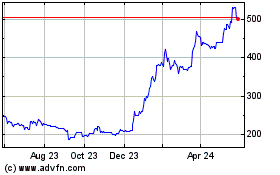
Mpac (LSE:MPAC)
Historical Stock Chart
From Aug 2023 to Aug 2024
