CONSOLIDATED STATEMENT OF COMPREHENSIVE INCOME


                                                                           2012 
                                                        2013         (restated) 
                                                        GBPm               GBPm 
 Profit for the period                                   3.5                3.8 
                                                    --------      ------------- 
 Other comprehensive income/(expense) 
 Items that will not be reclassified 
  to profit or loss                                     13.5             (17.6) 
  Actuarial gains/(losses) 
                                                       (3.6)                4.4 
  Tax on items that will not be reclassified 
  to profit or loss 
                                                    --------      ------------- 
                                                         9.9             (13.2) 
                                                    --------      ------------- 
 Items that may be reclassified subsequently 
  to profit or loss 
  Currency translation movements arising               (1.5)              (0.7) 
  on foreign currency net investments 
                                                       (0.8)                0.3 
  Effective portion of changes in fair 
  value of cash flow hedges                              0.1                  - 
 
  Tax on items that will not be reclassified 
  to profit or loss 
                                                    --------      ------------- 
                                                       (2.2)              (0.4) 
                                                    --------      ------------- 
 Other comprehensive income/(expense) 
  for the period                                         7.7             (13.6) 
                                                    --------      ------------- 
 Total comprehensive income/(expense) 
  for the period                                        11.2              (9.8) 
                                                    ========      ============= 
 

CONSOLIDATED STATEMENT OF CHANGES IN EQUITY

 
                                                                           Capital 
                                    Share       Share    Translation    redemption     Hedging     Retained      Total 
                                  capital     premium        reserve       reserve     reserve     earnings     equity 
                                     GBPm        GBPm           GBPm          GBPm        GBPm         GBPm       GBPm 
 
   Balance at 1 January 
   2012                               5.0        26.0            4.2           3.9       (0.1)          2.0       41.0 
                               ----------  ----------  -------------  ------------  ----------  -----------  --------- 
 
   Profit for the period, 
   as restated 
   Other comprehensive                  -           -              -             -           -          3.8        3.8 
   income/(expense) for 
   the period, as restated              -           -          (0.7)             -         0.3       (13.2)     (13.6) 
                               ----------  ----------  -------------  ------------  ----------  -----------  --------- 
 Total comprehensive 
  income/(expense) for 
  the period                            -           -          (0.7)             -         0.3        (9.4)      (9.8) 
                               ----------  ----------  -------------  ------------  ----------  -----------  --------- 
 Dividends to shareholders              -           -              -             -           -        (1.0)      (1.0) 
  Equity-settled share-based 
  transactions                          -           -              -             -           -          0.2        0.2 
  Tax on items taken 
  directly to equity                    -           -              -             -           -          0.1        0.1 
                               ----------  ----------  -------------  ------------  ----------  -----------  --------- 
 Total transactions 
  with owners, recorded 
  directly in equity                    -           -              -             -           -        (0.7)      (0.7) 
                               ----------  ----------  -------------  ------------  ----------  -----------  --------- 
 Balance at 31 December 
  2012                                5.0        26.0            3.5           3.9         0.2        (8.1)       30.5 
                               ==========  ==========  =============  ============  ==========  ===========  ========= 
 
 
   Balance at 1 January 
   2013                               5.0        26.0            3.5           3.9         0.2        (8.1)       30.5 
                               ----------  ----------  -------------  ------------  ----------  -----------  --------- 
 
   Profit for the period 
   Other comprehensive                  -           -              -             -           -          3.5        3.5 
   income/ (expense) 
   for the period                       -           -          (1.5)             -       (0.7)          9.9        7.7 
                               ----------  ----------  -------------  ------------  ----------  -----------  --------- 
 Total comprehensive 
  income/ (expense) 
  for the period                        -           -          (1.5)             -       (0.7)         13.4       11.2 
                               ----------  ----------  -------------  ------------  ----------  -----------  --------- 
 Dividends to shareholders              -           -              -             -           -        (1.1)      (1.1) 
  Equity-settled share-based 
   transactions 
  Purchase of own shares                -           -              -             -           -          0.2        0.2 
  Tax on items recorded                 -           -              -             -           -        (0.2)      (0.2) 
   directly in equity 
 
                                        -           -              -             -           -        (0.1)      (0.1) 
                               ----------  ----------  -------------  ------------  ----------  -----------  --------- 
 Total transactions 
  with owners, recorded 
  directly in equity                    -           -              -             -           -        (1.2)      (1.2) 
                               ----------  ----------  -------------  ------------  ----------  -----------  --------- 
 Balance at 31 December 
  2013                                5.0        26.0            2.0           3.9       (0.5)          4.1       40.5 
                               ==========  ==========  =============  ============  ==========  ===========  ========= 
 

CONSOLIDATED STATEMENT OF FINANCIAL POSITION


                                                          2013           2012 
                                              Notes       GBPm           GBPm 
 Non-current assets 
  Intangible assets                                       15.2           14.5 
  Property, plant and equipment                           11.2           11.7 
  Investment property                          6           0.8              - 
  Deferred tax assets                                      3.2            7.8 
                                                     ---------      --------- 
                                                          30.4           34.0 
                                                     ---------      --------- 
 Current assets 
  Inventories                                             18.5           18.1 
  Trade and other receivables                             24.3           21.5 
  Cash and cash equivalents                               15.0           13.3 
                                                     ---------      --------- 
                                                          57.8           52.9 
 Current liabilities 
  Trade and other payables                              (29.5)         (26.9) 
  Current tax liabilities                                (1.2)          (1.0) 
  Provisions                                             (1.6)          (1.7) 
                                                     ---------      --------- 
                                                        (32.3)         (29.6) 
                                                     ---------      --------- 
 Net current assets                                       25.5           23.3 
                                                     ---------      --------- 
 Total assets less current liabilities                    55.9           57.3 
                                                     ---------      --------- 
 
  Non-current liabilities 
   Interest-bearing loans and borrowings                 (9.8)          (5.9) 
   Employee benefits                           6         (5.6)         (19.2) 
   Deferred tax liabilities                                  -          (1.7) 
                                                     ---------      --------- 
                                                        (15.4)         (26.8) 
                                                     ---------      --------- 
 Net assets                                    2          40.5           30.5 
                                                     =========      ========= 
 
  Equity 
   Issued capital                                          5.0            5.0 
   Share premium                                          26.0           26.0 
   Reserves                                                5.4            7.6 
   Retained earnings                                       4.1          (8.1) 
                                                     ---------      --------- 
 Total equity                                             40.5           30.5 
                                                     =========      ========= 
 
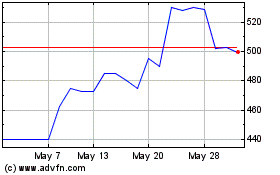
Mpac (LSE:MPAC)
Historical Stock Chart
From Jun 2024 to Jul 2024 Click Here for more Mpac Charts.
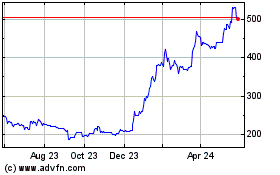
Mpac (LSE:MPAC)
Historical Stock Chart
From Jul 2023 to Jul 2024 Click Here for more Mpac Charts.