Thyssenkrupp AG 2Q 2016 - Forecast
May 06 2016 - 10:16AM
Dow Jones News
FRANKFURT--The following is a summary of analysts' forecasts for
Thyssenkrupp AG (TKA.XE) second-quarter results, based on a poll of
10 analysts conducted by Dow Jones Newswires (figures in million
euros, EPS, dividend and target price in euro, according to IFRS).
Earnings figures are scheduled to be released May 10.
===
                                           EBIT  Net attrib.
2nd Quarter           Sales  EBITDA  EBIT  adj.       profit
AVERAGE              10,316     586   280   298           67
Prev. Year           10,995     678   201   405           50
+/- in %               -6.2     -14   +39   -26          +34

MEDIAN               10,288     590   282   297           61
Maximum              10,676     628   310   325          142
Minimum              10,025     548   243   278           13
Amount                    9       6     7    10            8

Baader-Helvea            --      --    --   325           --
Berenberg            10,134      --    --   297           13
Commerzbank          10,676     595   260   300          142
Deutsche Bank        10,054     604   297   297           96
Exane BNP Paribas    10,025     585   292   292           60
Goldman Sachs        10,288      --    --   307           17
Jefferies            10,309     628   310   310           99
Kepler Cheuvreux     10,177      --   282   282           62
RBC Capital Markets  10,625     554   278   278           47
Warburg Research     10,553     548   243   293           --

2nd Quarter                EPS
AVERAGE                   0.12
Prev. Year                0.09
+/- in %                   +33

MEDIAN                    0.11
Maximum                   0.18
Minimum                   0.02
Amount                       9

Berenberg                 0.02
Commerzbank               0.10
Deutsche Bank             0.17
Exane BNP Paribas         0.11
Goldman Sachs             0.18
Jefferies                 0.17
Kepler Cheuvreux          0.11
RBC Capital Markets       0.08
Warburg Research          0.14


               Target price  Rating                DPS 2016
AVERAGE               22.20  positive 6   AVERAGE      0.24
Prev. Quarter         20.43  neutral  3   Prev. Year   0.15
+/- in %               +8.7  negative 1   +/- in %      +62

MEDIAN                22.50               MEDIAN       0.25
Maximum               28.00               Maximum      0.30
Minimum               17.00               Minimum      0.15
Amount                   10               Amount          7

Baader-Helvea         17.50  Hold                        --
Berenberg             28.00  Buy                       0.20
Commerzbank           26.00  Buy                         --
Deutsche Bank         24.00  Buy                       0.15
Exane BNP Paribas     21.00  Outperform                0.25
Goldman Sachs         18.50  Neutral                     --
Jefferies             25.00  Buy                       0.25
LBBW                  17.00  Sell                      0.30
RBC Capital Markets   24.00  Outperform                0.25
Warburg Research      21.00  Hold                      0.30
===
Year-earlier figures are as reported by the company - continued
operations
DJG/voi
(END) Dow Jones Newswires
May 06, 2016 10:01 ET (14:01 GMT)
Copyright (c) 2016 Dow Jones & Company, Inc.
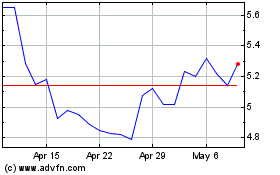
Thyssenkrupp (PK) (USOTC:TKAMY)
Historical Stock Chart
From Jun 2024 to Jul 2024

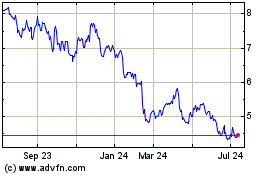
Thyssenkrupp (PK) (USOTC:TKAMY)
Historical Stock Chart
From Jul 2023 to Jul 2024
