~ Revenue Grew Over 49% to $345.6 Million
~
~ Same-Store Sales Grew 44% ~
~ Reports Quarterly Diluted Earnings Per
Share of $0.57 ~
~ Comparable Adjusted Diluted Earnings Per
Share Increased More Than 78% ~
~ Company Raises Fiscal 2016 Guidance
~
MarineMax, Inc. (NYSE:HZO), the nation’s largest recreational
boat and yacht retailer, today announced results for its third
quarter ended June 30, 2016.
Revenue grew over 49% to $345.6 million for the quarter ended
June 30, 2016 from $231.8 million for the comparable quarter last
year. Same-store sales grew 44% which is on top of 10% growth in
the same period last year. Pretax earnings for the quarter ended
June 30, 2016 were $23.1 million compared with $14.9 million in the
same period last year, which included a $1.6 million gain from the
sale of real estate. The Company was not required to provide an
income tax provision in the same period of 2015. Reported net
income was $14.1 million, or $0.57 per diluted share, for the
quarter ended June 30, 2016 compared to reported net income of
$14.9 million or $0.59 per diluted share, including the $1.6
million or $0.06 per diluted share gain in the June 2015 quarter.
Assuming the same tax rate in both periods and excluding the
benefit of the $1.6 million gain in the June 2015 quarter,
comparable adjusted diluted earnings per share grew in excess of
78% to $0.57 compared with $0.32.
For the nine months ended June 30, 2016, revenue growth was 27%
to $714.7 million compared with $562.1 million for the comparable
period last year. Same-store sales increased more than 25%, which
is on top of 23% growth in the comparable period last year. Pretax
earnings for the nine-months ended June 30, 2016 were $28.5 million
compared with $15.5 million in the same period last year, which
included the $1.6 million gain noted above. The Company was not
required to provide an income tax provision in the same period of
2015. Reported net income was $17.4 million, or $0.70 per diluted
share, for the nine-months ended June 30, 2016 compared to reported
net income of $15.5 million or $0.61 per diluted share, including
the $1.6 million or $0.06 per diluted share gain noted above.
Assuming the same tax rate in both periods, and excluding the
benefit of the $1.6 million gain in the nine-months ended June 30,
2015, comparable adjusted diluted earnings per share for nine
months ended June 30, 2016 more than doubled to $0.70 compared with
$0.33 in the same period last year.
William H. McGill, Jr., Chairman, President, and Chief Executive
Officer, stated, “Our excellent results are a testimony to the
strength of our Team and the passion for the boating lifestyle
enjoyed by many and desired by most. The cadence throughout the
quarter was consistently strong as we drove exceptional unit and
revenue growth, as almost every category and brand contributed to
our performance. Larger boat sales were unusually strong for a June
quarter, further driving our same-store sales growth. We believe
that our results demonstrate that our customer centric strategies
are aligned with the needs of our customers, which continues to
drive our industry leading market share gains.”
Mr. McGill continued, “Our manufacturing partners are investing
considerably more in new model development than they have in many
years. Our growth has been aided by these new models as consumers
seek newer, innovative products that better enhance their boating
lifestyle. We believe the future is bright, as more new models are
developed and produced while the industry continues its recovery.
It is worth noting that our strong June quarter results are among
the best we have reported in our history, even though industry unit
sales are considerably lower than historical levels. The brand and
segment expansions we executed during the Great Recession are
driving meaningful growth, despite the current industry unit
levels. As the industry continues to recover in the coming years,
such expansion should further contribute to even greater cash flow
and earnings growth. Additionally, with our strong and improving
balance sheet, we are well positioned to capture additional growth
and take advantage of additional opportunities as they evolve.”
2016 Guidance
Based on current business conditions, retail trends and other
factors, the Company is raising its guidance expectations for fully
taxed earnings per diluted share to be in the range of $0.86 to
$0.90 for fiscal 2016 from our previously issued range of $0.68 to
$0.75. This compares to an adjusted, but fully taxed, diluted
earnings per share of $0.47 in fiscal 2015. The adjustments to
fiscal 2015 are the removal of certain gains and a deferred tax
asset valuation allowance reversal noted in previous earnings
releases. These expectations do not take into account, or give
effect, for future possible material acquisitions that may
potentially be completed by the Company during the fiscal year or
other unforeseen events.
About MarineMax
Headquartered in Clearwater, Florida, MarineMax is the nation’s
largest recreational boat and yacht retailer. Focused on premium
brands, such as Sea Ray, Boston Whaler, Meridian, Hatteras, Azimut
Yachts, Ocean Alexander, Galeon, Grady-White, Harris, Crest, Scout,
Sailfish, Sea Pro, Scarab Jet Boats, Aquila, and Nautique,
MarineMax sells new and used recreational boats and related marine
products and services as well as provides yacht brokerage and
charter services. MarineMax currently has 56 retail locations in
Alabama, California, Connecticut, Florida, Georgia, Maryland,
Massachusetts, Minnesota, Missouri, New Jersey, New York, North
Carolina, Ohio, Oklahoma, Rhode Island, and Texas and operates
MarineMax Vacations in Tortola, British Virgin Islands. MarineMax
is a New York Stock Exchange-listed company. For more information,
please visit www.marinemax.com.
Certain statements in this press release are forward-looking as
defined in the Private Securities Litigation Reform Act of 1995.
Such forward-looking statements include the Company's anticipated
financial results for the third quarter ended June 30, 2016; our
belief that our future is bright; our belief that new models will
keep driving growth; our expectation to continue our ongoing market
share gains and improved earnings performance; our belief we are
well positioned to take advantage of acquisition opportunities; and
our fiscal 2016 guidance. These statements involve certain risks
and uncertainties that may cause actual results to differ
materially from expectations as of the date of this release. These
risks include the Company’s abilities to reduce inventory, manage
expenses and accomplish its goals and strategies, the quality of
the new product offerings from the Company's manufacturing
partners, general economic conditions, as well as those within our
industry, and the level of consumer spending, the Company’s ability
to integrate acquisitions into existing operations, and numerous
other factors identified in the Company’s Form 10-K for the fiscal
year ended September 30, 2015 and other filings with the Securities
and Exchange Commission.
MarineMax, Inc. and
Subsidiaries
Condensed Consolidated Statements of
Operations
(Amounts in thousands, except share and
per share data)
(Unaudited)
Three Months Ended June 30, Nine
Months Ended June 30, 2016 2015
2016 2015 Revenue $ 345,592 $ 231,849 $
714,695 $ 562,118 Cost of sales 266,690 174,809
545,152 425,423 Gross profit 78,902
57,040 169,543 136,695 Selling, general, and administrative
expenses 54,325 41,049 136,735
117,701 Income from operations 24,577 15,991 32,808 18,994
Interest expense 1,473 1,141
4,282 3,540 Income before income tax provision 23,104
14,850 28,526 15,454 Income tax provision 9,043
— 11,154 — Net income $ 14,061 $
14,850 $ 17,372 $ 15,454 Basic net income per
common share $ 0.58 $ 0.60 $ 0.72 $ 0.63
Diluted net income per common share $ 0.57 $ 0.59 $ 0.70 $
0.61 Weighted average number of common shares used in
computing net income per common share: Basic
24,159,070 24,654,076 24,175,671
24,491,338 Diluted 24,731,389 25,316,092
24,710,227 25,175,538
Supplemental Information Net income $ 14,061 $
14,850 $ 17,372 $ 15,454 Gain on sale of property, net — (1,628 ) —
(1,628 ) Pro forma income tax provision for 2015 —
(5,175 ) — (5,406 ) Adjusted net income $ 14,061 $
8,047 $ 17,372 $ 8,420 Diluted net income per
common share $ 0.57 $ 0.59 $ 0.70 $ 0.61 Gain on sale of property,
net — (0.06 ) — (0.06 ) Pro forma income tax provision for 2015
— (0.21 ) — (0.22 ) Adjusted diluted
net income per common share $ 0.57 $ 0.32 $ 0.70 $ 0.33
MarineMax, Inc. and
Subsidiaries
Condensed Consolidated Balance
Sheets
(Amounts in thousands)
(Unaudited)
June 30, 2016 June 30,
2015 ASSETS CURRENT ASSETS: Cash and cash equivalents
$ 55,560 $ 47,448 Accounts receivable, net 27,324 23,018
Inventories, net 306,631 257,597 Prepaid expenses and other current
assets 11,319 4,978 Total current
assets 400,834 333,041 Property and equipment, net 115,346
106,279 Other long-term assets, net 13,271 5,163 Deferred tax
assets, net 16,378 — Total assets $
545,829 $ 444,483
LIABILITIES AND
STOCKHOLDERS’ EQUITY CURRENT LIABILITIES: Accounts payable $
19,342 $ 11,544 Customer deposits 18,153 13,630 Accrued expenses
27,242 22,719 Short-term borrowings 176,972
137,388 Total current liabilities 241,709 185,281
Long-term liabilities 2,463 425 Total
liabilities 244,172 185,706 STOCKHOLDERS' EQUITY: Preferred
stock — — Common stock 26 26 Additional paid-in capital 238,196
233,894 Retained earnings 92,805 42,595 Treasury stock
(29,370 ) (17,738 ) Total stockholders’ equity
301,657 258,777 Total liabilities and
stockholders’ equity $ 545,829 $ 444,483
View source
version on businesswire.com: http://www.businesswire.com/news/home/20160726005535/en/
MarineMax, Inc.Michael H. McLamb, Chief Financial OfficerAbbey
Heimensen, Public Relations727.531.1700orIntegrated Corporate
Relations, Inc.Brad Cohen - Investor Relations, 203.682.8211Susan
Hartzell – Media Contact, 203.682.8238
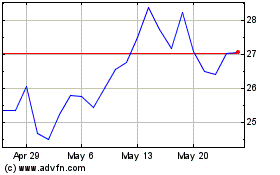
MarineMax (NYSE:HZO)
Historical Stock Chart
From Jun 2024 to Jul 2024

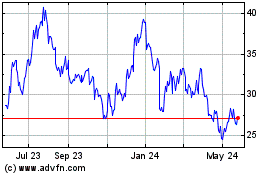
MarineMax (NYSE:HZO)
Historical Stock Chart
From Jul 2023 to Jul 2024
