false
0001822993
0001822993
2024-02-21
2024-02-21
iso4217:USD
xbrli:shares
iso4217:USD
xbrli:shares
UNITED STATES
SECURITIES AND EXCHANGE COMMISSION
Washington, D.C. 20549
FORM 8-K
CURRENT REPORT
Pursuant to Section 13 or 15(d) of the Securities
Exchange Act of 1934
Date of Report (Date of earliest event reported): February 21, 2024
Jackson
Financial Inc.
(Exact name of registrant as specified in its
charter)
| Delaware |
|
001-40274 |
|
98-0486152 |
(State or other jurisdiction of incorporation or
organization) |
|
(Commission
File
Number) |
|
(I.R.S.
Employer Identification No.) |
1 Corporate Way,
Lansing,
Michigan |
|
48951 |
| (Address of principal executive
offices) |
|
(Zip Code) |
(517) 381-5500
(Registrant’s telephone number, including
area code)
N/A
(Former name or former address, if changed since
last report)
Check the appropriate box below if the Form 8-K filing is intended
to simultaneously satisfy the filing obligation of the registrant under any of the following provisions:
| ¨ | Written communications pursuant to Rule 425 under the Securities
Act (17 CFR 230.425) |
| | |
| ¨ | Soliciting material pursuant to Rule 14a-12 under the Exchange
Act (17 CFR 240.14a-12) |
| | |
| ¨ | Pre-commencement communications pursuant to Rule 14d-2(b) under
the Exchange Act (17 CFR 240.14d-2(b)) |
| | |
| ¨ | Pre-commencement communications pursuant to Rule 13e-4(c) under
the Exchange Act (17 CFR 240.13e-4(c)) |
Securities registered pursuant to Section 12(b) of the Act:
| Title
of Each Class |
|
Trading
Symbol(s) |
|
Name
of Exchange on Which Registered |
| Common Stock, Par Value $0.01 Per Share |
|
JXN |
|
New
York Stock Exchange |
Indicate by check mark whether the registrant is an emerging growth
company as defined in Rule 405 of the Securities Act of 1933 (230.405 of this chapter) or Rule 12b-2 of the Securities Exchange
Act of 1934 (240.12b-2 of this chapter).
Emerging growth company ¨
If an emerging growth company, indicate by check mark if the registrant
has elected not to use the extended transition period for complying with any new or revised financial accounting standards provided pursuant
to Section 13(a) of the Exchange Act. ¨
| Item 7.01 | Regulation FD Disclosure. |
Jackson Financial Inc. has prepared a slide presentation
to accompany its fourth quarter and full year ended December 31, 2023 earnings call to be held on Thursday, February 22, 2024, at 10:00
a.m. Eastern Time. A copy of that slide presentation is furnished as Exhibit 99.1 to this report.
The information in this Item (including Exhibit
99.1) shall not be deemed “filed” for the purposes of Section 18 of the Securities Exchange Act of 1934, as amended, or otherwise
subject to the liabilities of that section, nor shall it be deemed incorporated by reference in any filing under the Securities Act of
1933, as amended, except as shall be expressly set forth in such a filing.
SAFE HARBOR
The information in this report contains forward-looking
statements about future events and circumstances and their effects upon revenues, expenses and business opportunities. Generally speaking,
any statement in this report not based upon historical fact is a forward-looking statement. Forward-looking statements can also be identified
by the use of forward-looking or conditional words, such as “could,” “should,” “can,” “continue,”
“estimate,” “forecast,” “intend,” “look,” “may,” “will,” “expect,”
“believe,” “anticipate,” “plan,” “remain,” “confident” and “commit”
or similar expressions. In particular, statements regarding plans, strategies, prospects, targets and expectations regarding the business
and industry are forward-looking statements. They reflect expectations, are not guarantees of performance and speak only as of the dates
the statements are made. We caution investors that these forward-looking statements are subject to known and unknown risks and uncertainties
that may cause actual results to differ materially from those projected, expressed, or implied. Factors that could cause actual results
to differ materially from those in the forward-looking statements include those reflected in Part I, Item 1A. Risk Factors and Part II,
Item 7. Management's Discussion and Analysis of Financial Condition and Results of Operations in our Annual Report on Form 10-K for the
year ended December 31, 2022, as filed with the SEC on March 1, 2023, (the "2022 Annual Report"), as Part II, Item 7 was recast
to reflect the adoption of the Long Duration Targeted Improvements accounting principle in our Current Report on Form 8-K filed May 10,
2023, and elsewhere in the Company’s reports filed with the U.S. Securities and Exchange Commission. Except as required by law,
Jackson Financial Inc. does not undertake to update such forward-looking statements. You should not rely unduly on forward-looking statements.
Certain financial data included in this report
consists of non-GAAP (Generally Accepted Accounting Principles) financial measures. These non-GAAP financial measures may not be comparable
to similarly titled measures presented by other entities, nor should they be construed as an alternative to other financial measures determined
in accordance with U.S. GAAP. Although the Company believes these non-GAAP financial measures provide useful information to investors
in measuring the financial performance and condition of its business, investors are cautioned not to place undue reliance on any non-GAAP
financial measures and ratios included in this report. A reconciliation of the non-GAAP financial measures to the most directly comparable
U.S. GAAP financial measure can be found in the “Non-GAAP Financial Measures” Appendix of this report.
Certain financial data included in this report
consists of statutory accounting principles (“statutory”) financial measures, including “total adjusted capital.”
These statutory financial measures are included in or derived from the Jackson National Life Insurance Company annual and/or quarterly
statements filed with the Michigan Department of Insurance and Financial Services and available in the investor relations section of
the Company’s website at investors.jackson.com/financials/statutory-filings.
| Item 9.01. | Financial Statements and Exhibits. |
(d) Exhibits.
SIGNATURES
Pursuant to the requirements of the Securities Exchange Act of 1934,
as amended, the registrant has duly caused this report to be signed on its behalf by the undersigned thereunto duly authorized.
| |
JACKSON
FINANCIAL INC. |
| |
|
| |
By: |
/s/
Marcia Wadsten |
| |
|
Marcia
Wadsten |
| |
|
Executive Vice President and
Chief Financial
Officer |
| |
|
(Principal
Financial Officer) |
| Date:
February 21, 2024 |
|
|
Exhibit 99.1

February 22, 2024 Jackson Financial Inc. Fourth Quarter and Full Year 2023 Financial Results
Forward - Looking Statements and Non - GAAP Measures The information in this document contains forward - looking statements about future events and circumstances and their effects upo n revenues, expenses and business opportunities. Generally speaking, any statement in this document not based upon historical fact is a forward - looking statement. Forward - lookin g statements can also be identified by the use of forward - looking or conditional words, such as “could,” “should,” “can,” “continue,” “estimate,” “forecast,” “intend,” “look,” “m ay,” “will,” “expect,” “believe,” “anticipate,” “plan,” “remain,” “confident” and “commit” or similar expressions. In particular, statements regarding plans, strategies, prospects, tar gets and expectations regarding the business and industry are forward - looking statements. They reflect expectations, are not guarantees of performance and speak only as of the dates the statements are made. We caution investors that these forward - looking statements are subject to known and unknown risks and uncertainties that may cause actual results to differ mate rially from those projected, expressed, or implied. Factors that could cause actual results to differ materially from those in the forward - looking statements include those reflecte d in Part I, Item 1A, Risk Factors and Part II, Item 7, Management’s Discussion and Analysis of Financial Condition and Results of Operations in the Form 10 - K for the year ended Decemb er 31, 2022, as filed with the SEC on March 1, 2023, as Part II, Item 7 was recast to reflect the adoption of LDTI in our Current Report on Form 8 - K filed May 10, 2023, and el sewhere in Jackson Financial Inc.’s filings filed with the U.S. Securities and Exchange Commission. Except as required by law, Jackson Financial Inc. does not undertake to update such for ward - looking statements. You should not rely unduly on forward - looking statements. Certain financial data included in this document consists of non - GAAP (Generally Accepted Accounting Principles) financial measu res. These non - GAAP financial measures may not be comparable to similarly titled measures presented by other entities, nor should they be construed as an alternative to other fin ancial measures determined in accordance with U.S. GAAP. Although the Company believes these non - GAAP financial measures provide useful information to investors in measuring the f inancial performance and condition of its business, investors are cautioned not to place undue reliance on any non - GAAP financial measures and ratios included in this document. A r econciliation of the non - GAAP financial measures to the most directly comparable U.S. GAAP financial measure can be found under “Non - GAAP Financial Measures” in the Appendix of thi s document. Certain financial data included in this document consists of statutory accounting principles (“statutory”) financial measures , i ncluding “total adjusted capital.” These statutory financial measures are included in or derived from the Jackson National Life Insurance Company annual and/or quarterly statements filed wi th the Michigan Department of Insurance and Financial Services and available in the investor relations section of the Company’s website at https://investors.jackson.com/ fin ancials/statutory - filings. 2

Oct 2021 Dec 2021 Mar 2022 Jun 2022 Sep 2022 Dec 2022 Mar 2023 Jun 2023 Sep 2023 Dec 2023 Cumulative Capital Return to Common Shareholders JFI has repurchased to date 19.9 million shares, which equates to over 21% of outstanding common shares at separation JFI updates capital return target to $425 - $525m for calendar year 2022 JFI announces increased share repurchase authorization by $300m and increased per share dividend by 10% to $0.55 for 1Q22 March 2, 2022 JFI announces 4Q21 $0.50 per share dividend and $300m share repurchase authorization November 9, 2021 JFI establishes capital return target prior to its separation – $325 - $425m in the first 12 months as a public company August 6, 2021 2023 Capital Return Activity $ millions Common Share Repurchase Authorization Share repurchase authorization remaining at YE22 106 February 2023 authorization increase 450 Shares repurchased in 2023 (255) Remaining Authorization 301 2023 Capital Return to Common Shareholder vs. Target 2023 capital return target 450 - 550 2023 shares repurchased/dividends paid 464 JFI updates capital return target to $450 - $550m for calendar year 2023 JFI announces increased share repurchase authorization by $450m and increased per share dividend by nearly 13% to $0.62 for 1Q23 February 28, 2023 3 $1.2B+
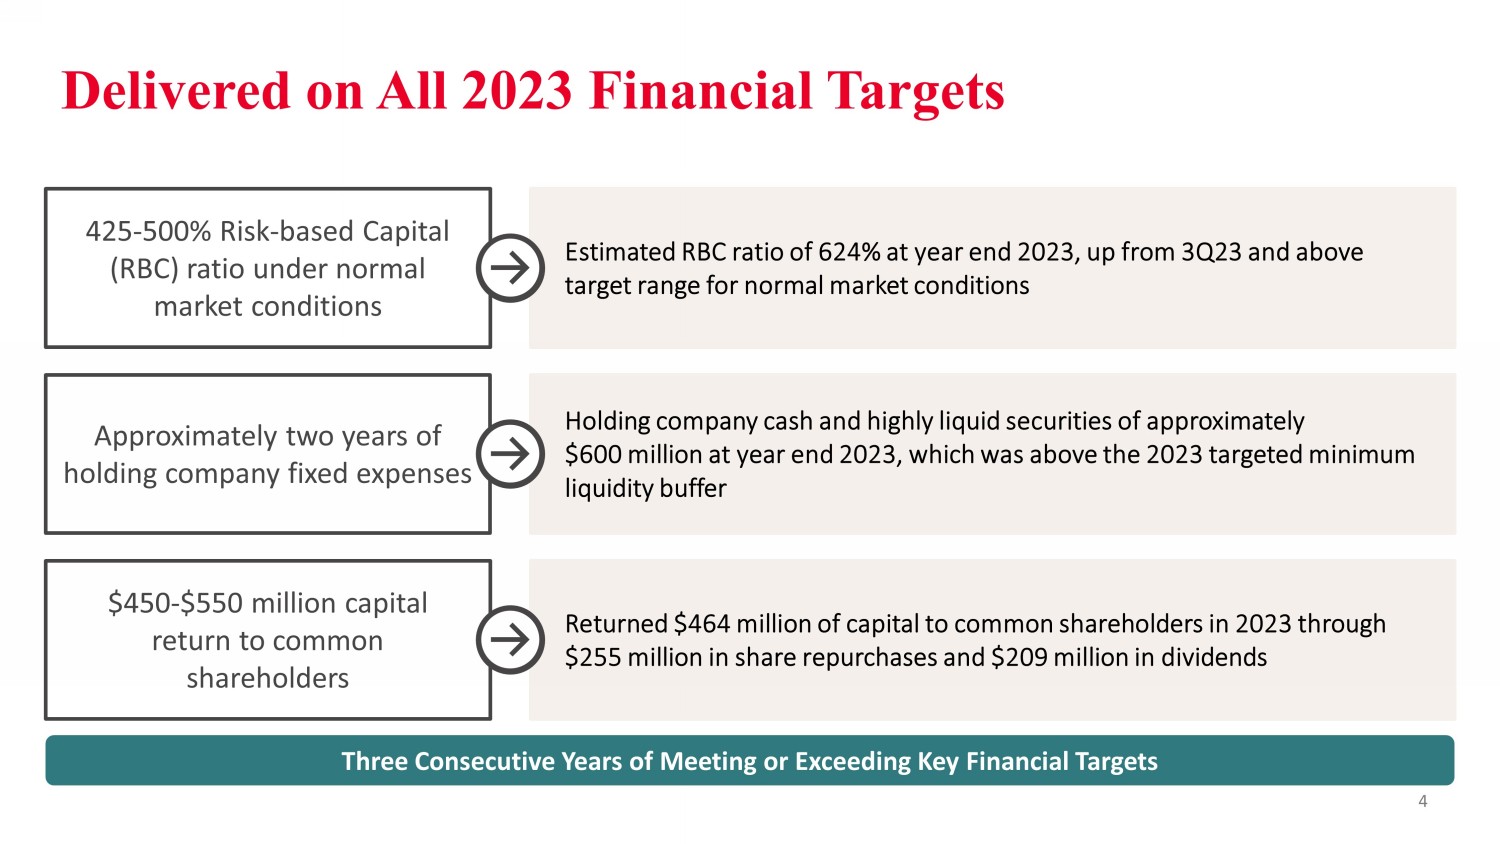
Delivered on All 2023 Financial Targets $450 - $550 million capital return to common shareholders Approximately two years of holding company fixed expenses Returned $464 million of capital to common shareholders in 2023 through $255 million in share repurchases and $209 million in dividends Holding company cash and highly liquid securities of approximately $600 million at year end 2023, which was above the 2023 targeted minimum liquidity buffer 425 - 500% Risk - based Capital (RBC) ratio under normal market conditions Estimated RBC ratio of 624% at year end 2023, up from 3Q23 and above target range for normal market conditions 4 Three Consecutive Years of Meeting or Exceeding Key Financial Targets

Successful Year of Execution Full Year 2023 Highlights Earnings Results • Net income attributable to Jackson Financial Inc. common shareholders of nearly $900 million or $10.76 per common share (diluted) • Adjusted Operating Earnings 1 of $1.1 billion • Adjusted Operating Earnings per common share (diluted) 1 of $12.84 • Adjusted Operating Earnings per common share, excluding notable items 2 , of $13.32 Strong Capital Position • Operating company estimated Risk - based Capital (RBC) ratio of 624% Consistent Capital Return • Achieved full year 2023 capital return target with $464 million in dividends and share repurchases • Established and funded Brooke Re, a wholly - owned Michigan based captive reinsurer in January of 2024 positioning us for more predictable capital generation going forward Capital Efficient Sales Mix • Total retail annuity sales of $12.8 billion, including Registered Index - Linked Annuity (RILA) sales of $2.9 billion • Institutional sales of $1.1 billion 1) See the Appendix for the non - GAAP financial measures, definitions and reconciliations to most comparable U.S. GAAP measure. 2) See slide #8 for details of FY23 notable items and adjustment for the impact of the effective tax rate. 5
6 ― Continued progress toward our strategic and operational goals ― Maintained strong balance sheet and robust levels of liquidity ― Met or exceeded all key financial targets for the third consecutive year ― Well - positioned for continued long - term value creation for shareholders Continue to Execute on Annual Targets & Focus on Shareholder Value Creation 6
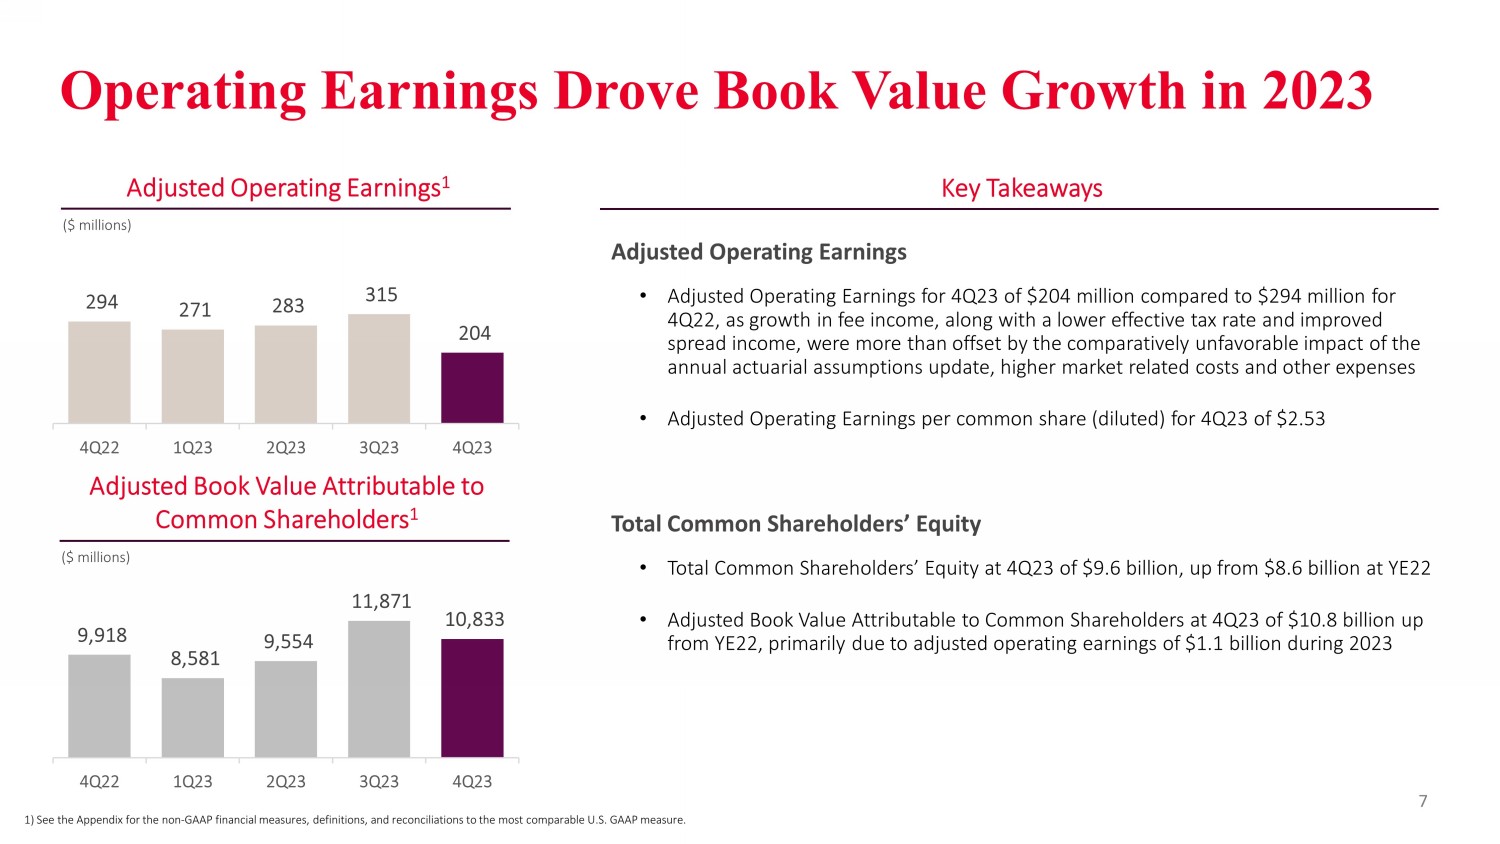
Operating Earnings Drove Book Value Growth in 2023 Adjusted Operating Earnings • Adjusted Operating Earnings for 4Q23 of $204 million compared to $294 million for 4Q22, as growth in fee income, along with a lower effective tax rate and improved spread income, were more than offset by the comparatively unfavorable impact of the annual actuarial assumptions update, higher market related costs and other expenses • Adjusted Operating Earnings per common share (diluted) for 4Q23 of $2.53 Total Common Shareholders’ Equity • Total Common Shareholders’ Equity at 4Q23 of $9.6 billion, up from $8.6 billion at YE22 • Adjusted Book Value Attributable to Common Shareholders at 4Q23 of $10.8 billion up from YE22, primarily due to adjusted operating earnings of $1.1 billion during 2023 Adjusted Operating Earnings 1 ($ millions) Adjusted Book Value Attributable to Common Shareholders 1 ($ millions) Key Takeaways 1) See the Appendix for the non - GAAP financial measures, definitions, and reconciliations to the most comparable U.S. GAAP measu re. 7 294 271 283 315 204 4Q22 1Q23 2Q23 3Q23 4Q23 9,918 8,581 9,554 11,871 10,833 4Q22 1Q23 2Q23 3Q23 4Q23

Notable Items Fourth Quarter 2023 4Q22 4Q23 ($ millions, except per share amounts) Pretax After - tax 1 EPS - Diluted Pretax After - tax 1,2 EPS - Diluted Adjusted Operating Earnings 3 320 294 3.39 203 204 2.53 Notable Items Included in Adjusted Operating Earnings Out performance/(Under performance) from Limited Partnership Income 4 (62) (57) (0.66) (28) (30) (0.37) Assumption Unlocking 38 35 0.40 (60) (64) (0.79) Total Notable Items (24) (22) (0.26) (88) (93) (1.16) EPS - Diluted EPS - Diluted Impact from Effective Tax Rate versus a 15% Tax Rate Guidance 0.28 0.62 1) After - tax results for Notable Items were calculated using the corresponding quarter’s effective tax rate for adjusted operati ng earnings (4Q22 of 8.1%; 4Q23 of - 5.9%). 2) Includes dividends on preferred stock of $11m. 3) See the Appendix for the non - GAAP financial measures, definitions, and reconciliations to the most comparable U.S. GAAP measure. 4) Limited Partnership income assumes an annualize d 1 0% return and excludes income and assets attributable to non - controlling interests. Income from limited partnerships is reported on a one - quarter lag. 5) Total Limited Partnership returns were a positive 1% and a negative 1% for 4Q23 and 4Q22, respectively, if y ou include non - operating results as well. Limited partnership annualized operating return of 3% for 4Q23 compared to a negative 5% during 4Q22 4,5 Excluding the notable items impact shown above, adjusted pretax operating earnings were $291 million for 4Q23 compared to $34 4 m illion for 4Q22 After adjusting for the impact of the effective tax rate, the diluted EPS excluding notable items was $3.07 per share for 4Q23 comp are d to $3.37 per share for 4Q22 8
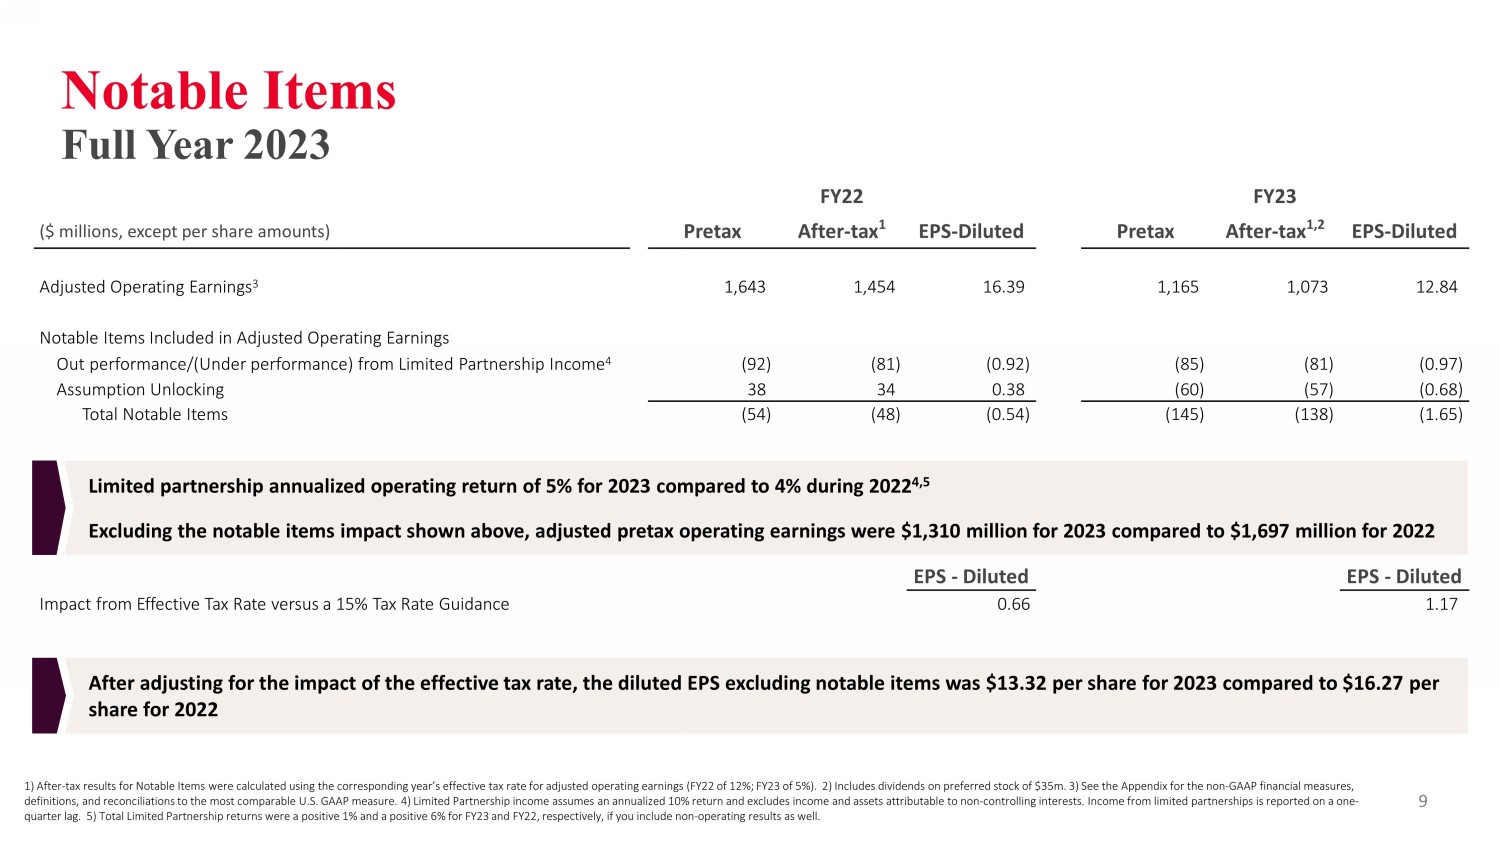
Notable Items Full Year 2023 FY22 FY23 ($ millions, except per share amounts) Pretax After - tax 1 EPS - Diluted Pretax After - tax 1,2 EPS - Diluted Adjusted Operating Earnings 3 1,643 1,454 16.39 1,165 1,073 12.84 Notable Items Included in Adjusted Operating Earnings Out performance/(Under performance) from Limited Partnership Income 4 (92) (81) (0.92) (85) (81) (0.97) Assumption Unlocking 38 34 0.38 (60) (57) (0.68) Total Notable Items (54) (48) (0.54) (145) (138) (1.65) EPS - Diluted EPS - Diluted Impact from Effective Tax Rate versus a 15% Tax Rate Guidance 0.66 1.17 1) After - tax results for Notable Items were calculated using the corresponding year’s effective tax rate for adjusted operating earnings (FY22 of 12%; FY23 of 5%). 2) Includes dividends on preferred stock of $35m. 3) See the Appendix for the non - GAAP financial measures, definitions, and reconciliations to the most comparable U.S. GAAP measure. 4) Limited Partnership income assumes an annualize d 1 0% return and excludes income and assets attributable to non - controlling interests. Income from limited partnerships is reported on a one - quarter lag. 5) Total Limited Partnership returns were a positive 1% and a positive 6% for FY23 and FY22, respectively, if y ou include non - operating results as well. Limited partnership annualized operating return of 5% for 2023 compared to 4% during 2022 4,5 Excluding the notable items impact shown above, adjusted pretax operating earnings were $1,310 million for 2023 compared to $ 1,6 97 million for 2022 After adjusting for the impact of the effective tax rate, the diluted EPS excluding notable items was $13.32 per share for 2023 com par ed to $16.27 per share for 2022 9
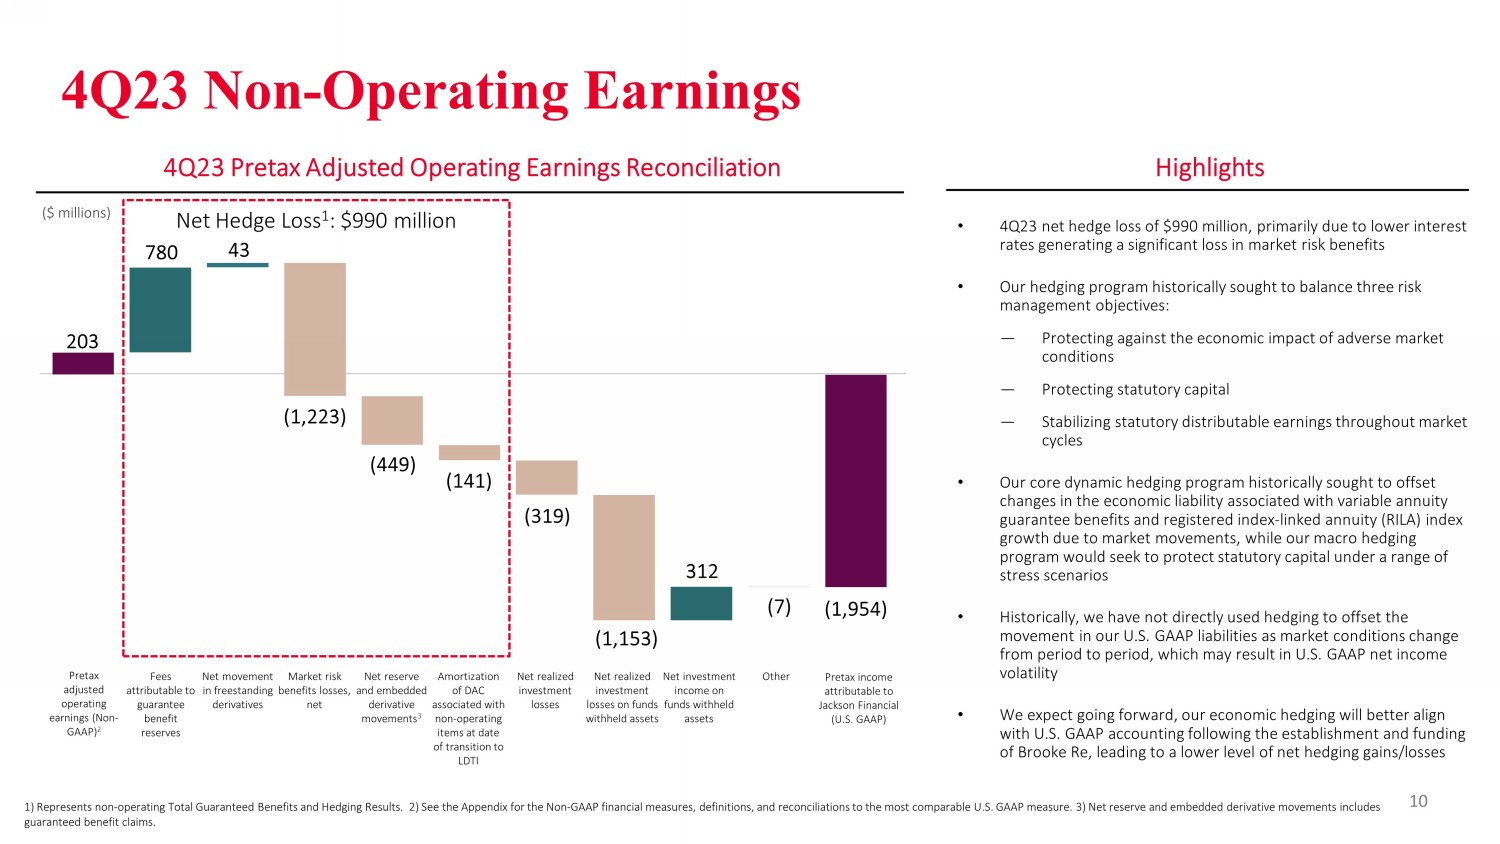
Net Hedge Loss 1 : $990 million 4Q23 Non - Operating Earnings • 4Q23 net hedge loss of $990 million, primarily due to lower interest rates generating a significant loss in market risk benefits • Our hedging program historically sought to balance three risk management objectives: ― Protecting against the economic impact of adverse market conditions ― Protecting statutory capital ― Stabilizing statutory distributable earnings throughout market cycles • Our core dynamic hedging program historically sought to offset changes in the economic liability associated with variable annuity guarantee benefits and registered index - linked annuity (RILA) index growth due to market movements, while our macro hedging program would seek to protect statutory capital under a range of stress scenarios • Historically, we have not directly used hedging to offset the movement in our U.S. GAAP liabilities as market conditions change from period to period, which may result in U.S. GAAP net income volatility • We expect going forward, our economic hedging will better align with U.S. GAAP accounting following the establishment and funding of Brooke Re, leading to a lower level of net hedging gains/losses Highlights Pretax income attributable to Jackson Financial (U.S. GAAP) Pretax adjusted operating earnings (Non - GAAP) 2 Fees attributable to guarantee benefit reserves Net movement in freestanding derivatives Net reserve and embedded derivative movements 3 Market risk benefits losses, net Net realized investment losses on funds withheld assets Net investment income on funds withheld assets Other (1,954) 1) Represents non - operating Total Guaranteed Benefits and Hedging Results. 2) See the Appendix for the Non - GAAP financial measu res, definitions, and reconciliations to the most comparable U.S. GAAP measure. 3) Net reserve and embedded derivative moveme nts includes guaranteed benefit claims. (7) (319) (449) (1,223) 43 780 203 ($ millions) 4Q23 Pretax Adjusted Operating Earnings Reconciliation (141) 10 312 Amortization of DAC associated with non - operating items at date of transition to LDTI Net realized investment losses (1,153)

3.2 3.1 3.1 3.3 3.3 4Q22 1Q23 2Q23 3Q23 4Q23 640 549 568 822 1,000 4Q22 1Q23 2Q23 3Q23 4Q23 Segment Results – Retail Annuities 1 • 4Q23 total annuity sales up from 4Q22 with an increasingly diversified product mix • More than half of annuity sales now without lifetime benefit riders • 4Q23 RILA sales grew 80% from 4Q22 and 25% from 3Q23, reaching an annualized run - rate of over $4 billion • Momentum in non - VA net flows, which crossed $1.0 billion in 4Q23, up 56% compared to 4Q22 Continued Retail Sales Diversification ($ billions) Non - VA Net Flows 53% 48% 43% 42% 43% Recent Trends 1) Excludes the FA/FIA business ceded to Athene. Variable Annuities RILA FA / FIA % w/o lifetime guarantees 11 ($ millions)

1.9 5.2 4Q22 4Q23 1.6 1.8 4Q22 4Q23 Segment Results – Retail Annuities • Pretax adjusted operating earnings for 4Q23 of $326 million broadly unchanged from 4Q22 • Growth of inforce business across all product lines supports future earnings trajectory • VA account value up 11% from 4Q22, benefiting from strong equity markets in 2023 • RILA account value up 178% from 4Q22 driven by healthy net flows • RILA and guaranteed VA have offsetting equity risk - netting these exposures together reduces the amount of external equity hedg ing required • The reduction in the liability equity sensitivity at YE23 was 14%, up from 8% at 2Q23 • FA and FIA account value, excluding the business ceded to Athene, was up 13% from 4Q22 ($ billions) Separate Account General Account Variable Annuity Account Value FA / FIA Account Value ($ billions) 1) See the Appendix for the non - GAAP financial measures, definitions, and reconciliations to the most comparable U.S. GAAP measu re. 12 RILA Account Value ($ billions) 206 228 4Q22 4Q23

9.0 8.4 ( 2.0 ) 1.1 0.3 4Q22 Sales Surrenders, Withdrawals, and Benefits Interest Credited 4Q23 Segment Results – Institutional & Closed Blocks • Pretax adjusted operating earnings 1 of $22 million in 4Q23 up from $17 million in the year - ago quarter • Institutional sales of $1.1 billion during 2023 reflects our opportunistic approach to this business, depending on both the risk - adjusted return on investment opportunities available and the prevailing cost of funding required by purchasers • Institutional account value of $8.4 billion at 4Q23, down from $9.0 billion at 4Q22 • Pretax adjusted operating loss 1 of $88 million in 4Q23, compared to income of $38 million in 4Q22. The current quarter benefited from lower expenses, which was more than offset by the comparatively unfavorable impact of the annual actuarial assumption update and lower spread income. • Under LDTI, there will be some volatility in closed block results from quarterly updates of actual versus expected cash flows and annual assumption updates. Results for 4Q23 included an expense of $75 million related to cash flow and assumption updates compared to a gain of $20 million in 4Q22. Institutional Account Value Closed Block Reserves ($ billions) Institutional Highlights Closed Block Highlights ($ billions) 1) See the Appendix for the non - GAAP financial measures, definitions, and reconciliations to the most comparable U.S. GAAP measu re 13 ($ billions) 22.3 22.3 21.9 21.4 21.7 4Q22 1Q23 2Q23 3Q23 4Q23

Strong Year - End 2023 Capital Position Returned $464 million to common shareholders in 2023 through $255 million of share repurchases and $209 million in dividends • Returned $117 million to common shareholders in 4Q23 through $67 million of share repurchases and $50 million in dividends • $301 million remaining on common share repurchase authorization as of YE23 • Increased 1Q24 dividend by nearly 13% to $0.70 per share Operating company estimated RBC ratio of 624%, up from 3Q23 • Statutory Total Adjusted Capital (TAC) ended 4Q23 at $5.2 billion, up from $4.5 billion at 3Q23 primarily due to positive net VA guarantee results, base contract cashflows, and related tax benefits including deferred tax asset admissibility limits • Company Action Level (CAL) required capital down primarily as a result of positive equity market movements in 4Q23 • Effective January 1, 2024, we established and funded Brooke Re, a wholly - owned Michigan based captive reinsurer. As the result of this transaction, the proforma estimated RBC ratio at Jackson National Life Insurance Company (JNLIC) as of January 1, 2024, was 543% Holding company liquid assets totaled approximately $600 million, providing an excess cash position over the minimum targeted li quidity buffer of 2x annual holding company expenses • Holding company liquid assets reduced by the previously disclosed repayment of $600 million of senior notes upon maturity in Nov ember 2023 14

Brooke Life Reinsurance Company (Brooke Re) A Captive Solution
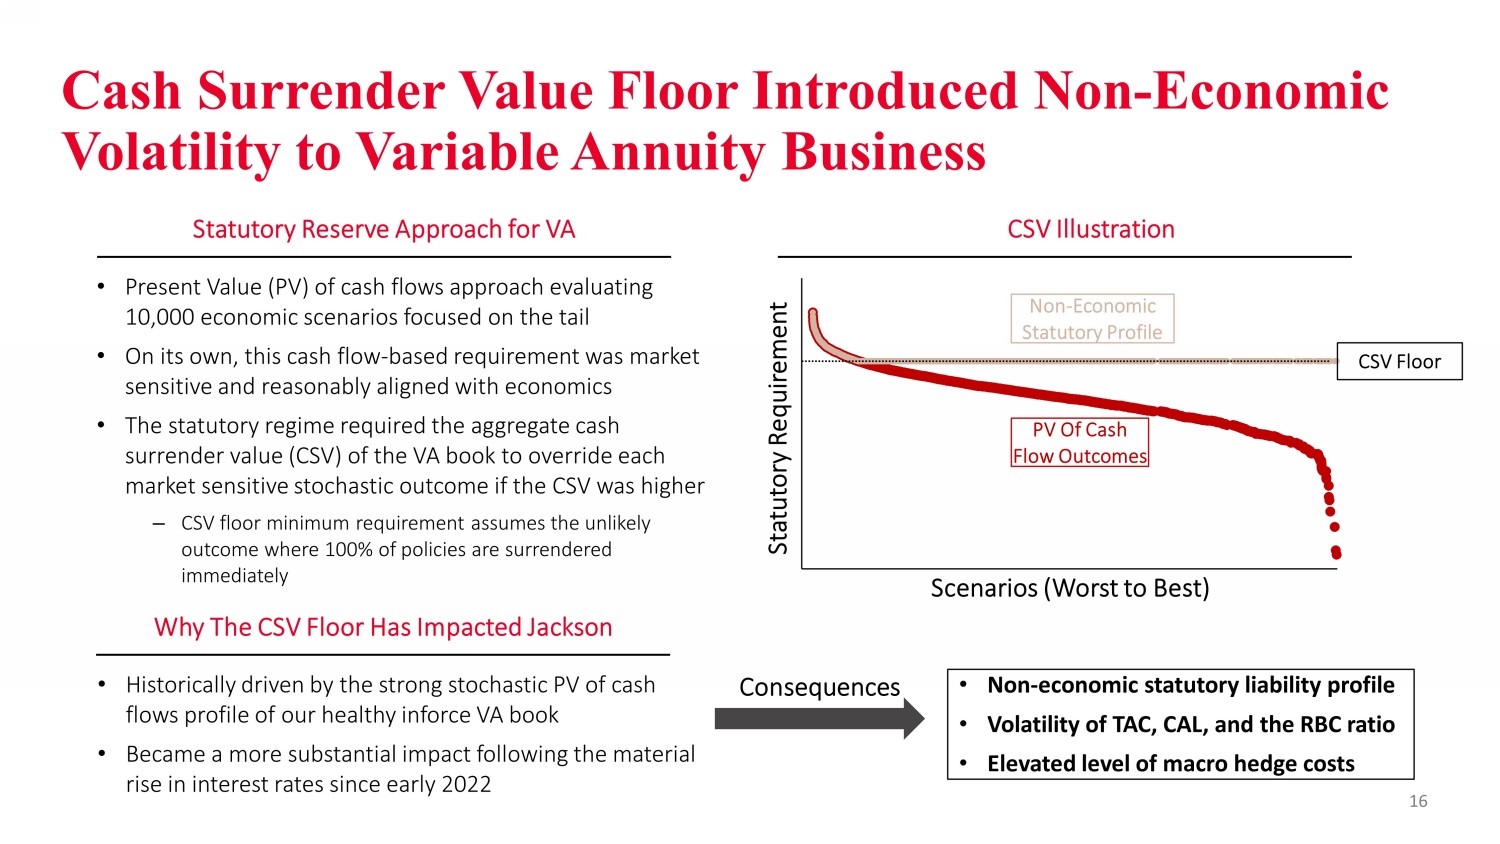
16 Cash Surrender Value Floor Introduced Non - Economic Volatility to Variable Annuity Business • Present Value (PV) of cash flows approach evaluating 10,000 economic scenarios focused on the tail • On its own, this cash flow - based requirement was market sensitive and reasonably aligned with economics • The statutory regime required the aggregate cash surrender value (CSV) of the VA book to override each market sensitive stochastic outcome if the CSV was higher ‒ CSV floor minimum requirement assumes the unlikely outcome where 100% of policies are surrendered immediately Statutory Reserve Approach for VA Scenarios (Worst to Best) Statutory Requirement • Historically driven by the strong stochastic PV of cash flows profile of our healthy inforce VA book • Became a more substantial impact following the material rise in interest rates since early 2022 CSV Floor PV Of Cash Flow Outcomes Why The CSV Floor Has Impacted Jackson • Non - economic statutory liability profile • Volatility of TAC, CAL, and the RBC ratio • Elevated level of macro hedge costs CSV Illustration Consequences Non - Economic Statutory Profile

Seeking a Long - Term Solution That Aligns Liability Treatment With the Economics of Our Business 17 Goals of Solution • Align reserves and hedging instruments in a more consistent, economic manner • Reduce the need for non - economic hedging • Allow for more intuitive results to stakeholders • Strong PV of VA cash flows resulted in a large, persistent cash surrender value floor impact • Lack of offsetting reserve movements to hedging results in rising rate and/or equity market environment led to greater volatility in statutory capital levels and RBC ratio Statutory Liability Not Aligned With Economics CSV Floor Driven Volatility Led To Inefficient Hedging and Less Predictable Results • Non - economic hedging required which: • Consumed resources that could be deployed elsewhere • Clouded the communication of our hedging strategy • Reduced predictability of financial results CHALLENGE CONSEQUENCES
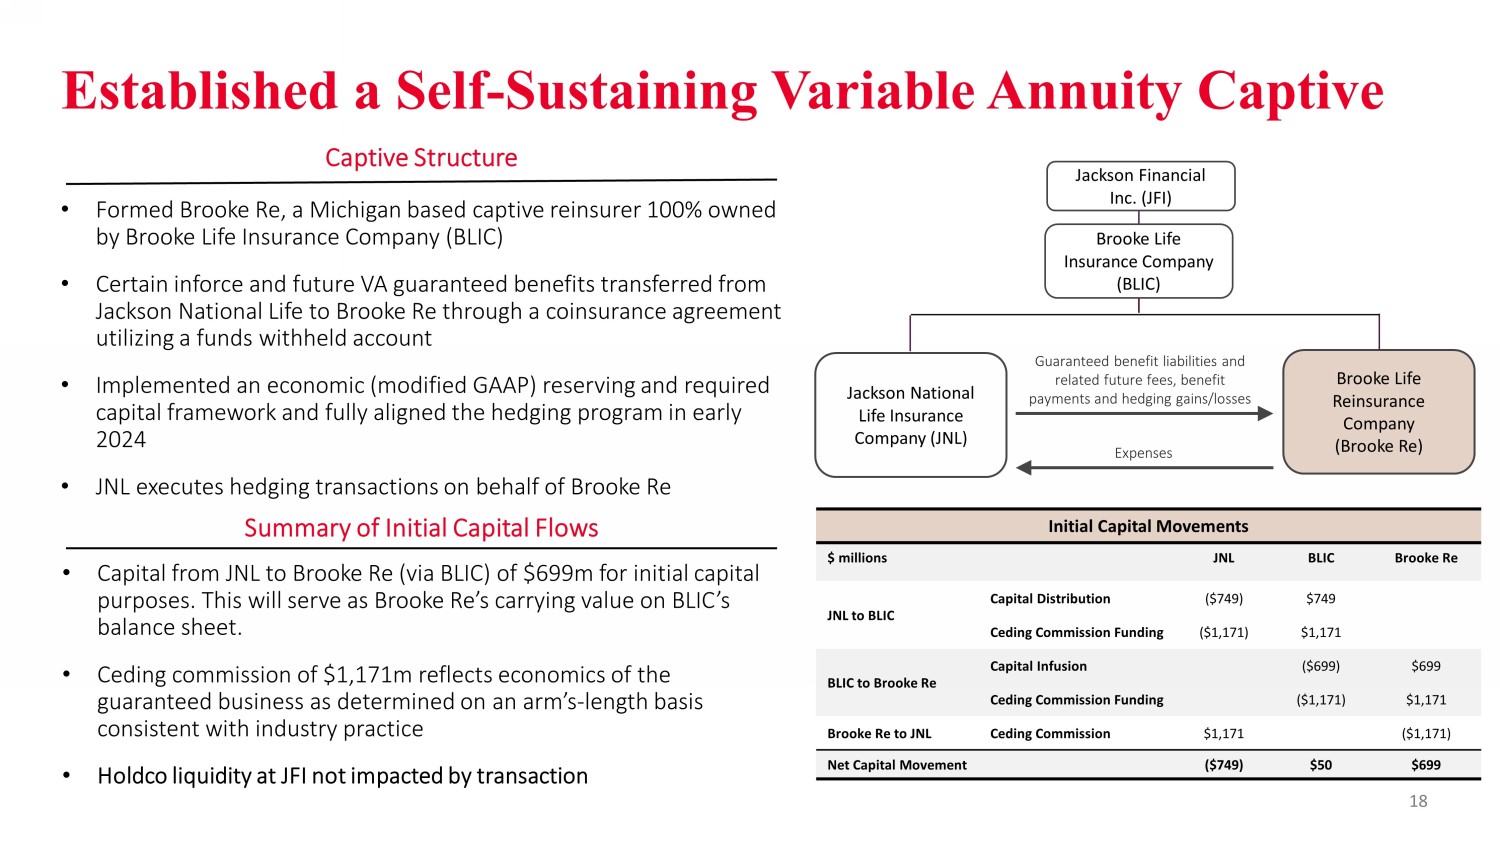
• Formed Brooke Re, a Michigan based captive reinsurer 100% owned by Brooke Life Insurance Company (BLIC) • Certain inforce and future VA guaranteed benefits transferred from Jackson National Life to Brooke Re through a coinsurance agreement utilizing a funds withheld account • Implemented an economic (modified GAAP) reserving and required capital framework and fully aligned the hedging program in early 2024 • JNL executes hedging transactions on behalf of Brooke Re Established a Self - Sustaining Variable Annuity Captive Captive Structure Summary of Initial Capital Flows Initial Capital Movements $ millions JNL BLIC Brooke Re JNL to BLIC Capital Distribution ($749) $749 Ceding Commission Funding ($1,171) $1,171 BLIC to Brooke Re Capital Infusion ($699) $699 Ceding Commission Funding ($1,171) $1,171 Brooke Re to JNL Ceding Commission $1,171 ($1,171) Net Capital Movement ($749) $50 $699 Guaranteed benefit liabilities and related future fees, benefit payments and hedging gains/losses Expenses • Capital from JNL to Brooke Re (via BLIC) of $699m for initial capital purposes. This will serve as Brooke Re’s carrying value on BLIC’s balance sheet. • Ceding commission of $1,171m reflects economics of the guaranteed business as determined on an arm’s - length basis consistent with industry practice • Holdco liquidity at JFI not impacted by transaction Jackson Financial Inc. (JFI) Brooke Life Insurance Company (BLIC) Brooke Life Reinsurance Company (Brooke Re) Jackson National Life Insurance Company (JNL) 18

Reserve Methodology at Brooke Re Aligns with the Economics of the Business 19 • No cash surrender value floor, allowing reserve to increase or decrease in response to changes in markets • Includes only the guarantee cash flows creating a clear line between: • Guaranteed benefit economics in Brooke Re • Base contract economics in Jackson National Life • Modifications applied to add stability to the captive balance sheet and facilitate self - sustainability Key Design Goals Associated Modifications to MRB Rationale for Modification Promote Stability in Brooke Re Balance Sheet - Fixed long - term volatility assumption - Fixed non - performance risk spread - Items that we have not explicitly hedged in the past or going forward, as they are not primary economic risks in the business Self - Sustaining Design - Apply haircut to guarantee fee stream - Apply expense provision for administration costs - Prudence Benefits of Modified GAAP Market Risk Benefits (MRB) Methodology Collectively modifications typically result in a more conservative reserve compared to U.S. GAAP

Capital Framework at Brooke Re Designed to Be Highly Resilient 20 • Built using statutory required risk capital charges with the exception of market/interest rate risk • Statutory market/interest rate risk calculation would be impacted by the CSV floor • Brooke Re’s market/interest rate risk charge recalculates the modified GAAP reserve under stressed conditions, with the charg e b ased on this stressed reserve relative to the original reserve • Brooke Re is well in excess of minimum operating capital at implementation, including initial funding • Risk framework seeks to hold capital sufficient to remain above this minimum level following adverse scenarios • Looking across multiple time frames • Projected capital remains in excess of the minimum operating capital level in 95%+ of scenarios Brooke Re Minimum Operating Capital Methodology Brooke Re expected to be self - sustaining and capital generative over the long - term
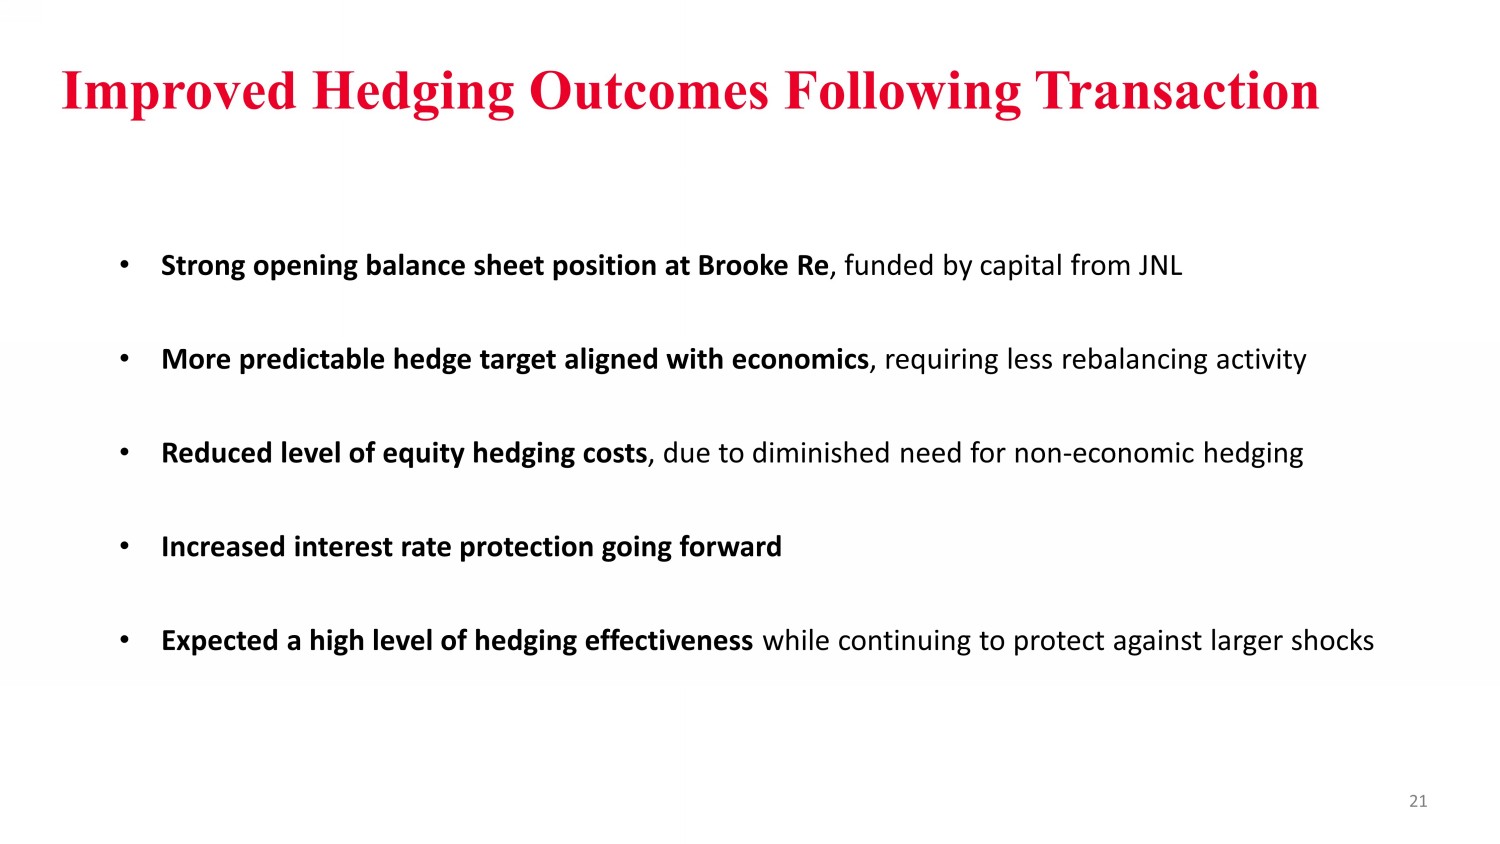
Improved Hedging Outcomes Following Transaction 21 • Strong opening balance sheet position at Brooke Re , funded by capital from JNL • More predictable hedge target aligned with economics , requiring less rebalancing activity • Reduced level of equity hedging costs , due to diminished need for non - economic hedging • Increased interest rate protection going forward • Expected a high level of hedging effectiveness while continuing to protect against larger shocks

Brooke Re Is a Durable, Long - Term Solution to the Cash Surrender Value Floor 22 x Modified GAAP reserve not limited by cash surrender value floor x Hedges and reserves consistently and fully responsive to market and rate movements x Reserve better aligned with economics of business Align reserves and hedging instruments in a more consistent, economic manner x Hedging focused on economic risks to VA guarantees x Inefficient and non - economic upside hedging no longer needed x High expected level of hedge effectiveness Reduce the need for non - economic hedging x More stable and predictable capital generation at JNL x Better alignment of adjusted operating earnings and regulatory capital generation x Greater stability of GAAP net income Allow for more intuitive results to stakeholders

Jackson National Life Stronger & More Predictable Capital Creation

Jackson National Life Post Transaction 24 • Capital generation focused on more predictable VA fee income separated from guarantees • Diversification from spread and mortality - based business with opportunity to grow • Robust initial capital position with a high level of excess over targeted RBC ratio • Substantial, resilient future cash flow profile

25 Jackson National Life Capital Generation Driven Primarily By Fee Business VA Separate Account VA Fixed Account FA/FIA/Payout RILA Institutional Closed Block Annuity Closed Block Life Fee 82% Life 6% Inforce Reserves By Type 1 • Capital generation more aligned with adjusted operating earnings • Fee business driven by VA base contract cash flows • Asset management economics reflecting significant scale • AUM most impacted by market performance and net flows • Spread business has strong capacity for growth • Consists of non - VA annuities, fixed portion of VA, and Institutional business • Retained block is primarily composed of recently issued RILA/FA/FIA suggesting limited near - term surrender activity • Spread economics driven by rates, spreads, and credit performance • Closed block life reflects successful M&A track record • Size of block will depend on future acquisition activity • Income will also be dependent on mortality outcomes Economics of Business 1) Based on GAAP reserves shown net of reinsurance. Excludes MRB, claims payable, and other. VA separate account reserves i ncl ude a small amount of non - VA business.

Robust JNL Capital Position Following Transaction 26 Jackson National Life Insurance Company – Impact of Reinsurance Transaction $ millions Total Adjusted Capital (TAC) Company Action Level Required Capital (CAL) RBC Ratio As Reported Year - End 2023 $5,158 $827 624% Release of Required Capital (36) Capital Distribution (749) Reduced DTA Admissibility (112) Proforma Year - End 2023 $4,297 $791 543% • RBC ratio was up from 3Q 2023 to 624% • Continued strong underlying business results • Hedging mostly transitioned to align with modified GAAP reserving methodology during 4Q 2023 • Fully transitioned by early January Strong Estimated Year - End RBC Ratio • Captive established in January with an effective date of 1/1/24 • JNL total adjusted capital (TAC) reduced by initial capitalization amount – Brooke Re well capitalized with hard assets • Incremental 15% impact on TAC related to reduced capacity for admissibility of statutory deferred tax assets • The associated VA guarantee capital requirement was released by JNL, which mitigated the impact of the initial captive funding • Proforma JNL RBC remained well above 500% Transaction Impacts

Increased Transparency Into Economics of Business Jackson Financial Inc. Jackson National Life Brooke Re Holding Company Regulated Insurance Company Regulated Captive Reinsurer • Holding company fixed expenses including debt service • Cash and highly liquid securities funded by operating company remittances • VA guaranteed benefit reserves, including both in - force and future business • Primary drivers of cash flow and capital generation will be hedging instrument and reserve movements, and guarantee fees and claims • Designed to be self sustaining from a capital and liquidity perspective • VA base contract fees and expenses the largest drivers of profitability • RILA, FA, FIA, and Institutional products generate incremental spread based earnings • Closed block segment provides mortality based earnings • Improved risk adjusted capital generation as majority of VA guarantee benefits reinsured to Brooke Re Target 2x Annual Holding Company Fixed Expenses Target RBC Ratio Minimum Operating Capital Reflecting Stressed Conditions Description Capital Framework Drivers of Underlying Value Key Financial Metrics Cash and Highly Liquid Securities Fee Based Reserves of $220b; Spread Based Reserves of $31b; Life Reserves of $16b $699m Capital Contribution Day One; Hedge Effectiveness 27

2024 Key Financial Targets

2024 Financial Targets 425% Risk - Based Capital (RBC) ratio Approximately two years of holding company fixed expenses Excess capital at Jackson National Life Insurance Company measured at 425% RBC ratio Holding company fixed net expenses, including interest expense, at approximately $250 million $550 - $650 million capital return to common shareholders Supported by periodic distributions from JNL to JFI throughout the year 29

Investments

31 ― Conservative underwriting is a consistent theme throughout ― Highly rated and diversified commercial mortgage loan office portfolio, which is less than 2% of the general account portfolio ― Corporate portfolio is concentrated in investment - grade securities 31 High Quality, Diversified Investment Portfolio

U.S government securities 10% Other government securities 2% Corporate securities 55% Residential mortgage - backed <1% Commercial mortgage - backed 3% Other asset - backed securities 5% Equity securities <1% Mortgage loans 17% Policy loans 2% Derivatives <1% Limited Partnerships 3% Other invested assets <1% U.S. GAAP – Investment Portfolio December 31, 2023 • Market/book ratio of the fixed maturity portfolio is 0.93 • Exposure to below investment grade securities is only 6% 2 of total invested assets, which is almost entirely corporate bonds and loans • Exposure to highly liquid U.S. Treasuries is 10% • 100% of securitized assets are investment grade • 99% of Commercial Mortgage Loans are first mortgage and 95% are CM1 - 2 rated Investment Portfolio Classification 1 Key Highlights 1) Excludes Funds Withheld. 2) includes investments in affiliate CLOs which results in the entire CLO being consolidated for US GAAP reporting purposes. While this results in all of the underlying loans held by the CLO being included in our financial statements, our economic risk is solely limited to our direct investment in the CLO. Excluding these consolidated items, our exposure to be low investment grade securities was 1 % at 12/31/23. Percentages may not total 100 due to rounding. $41b 32
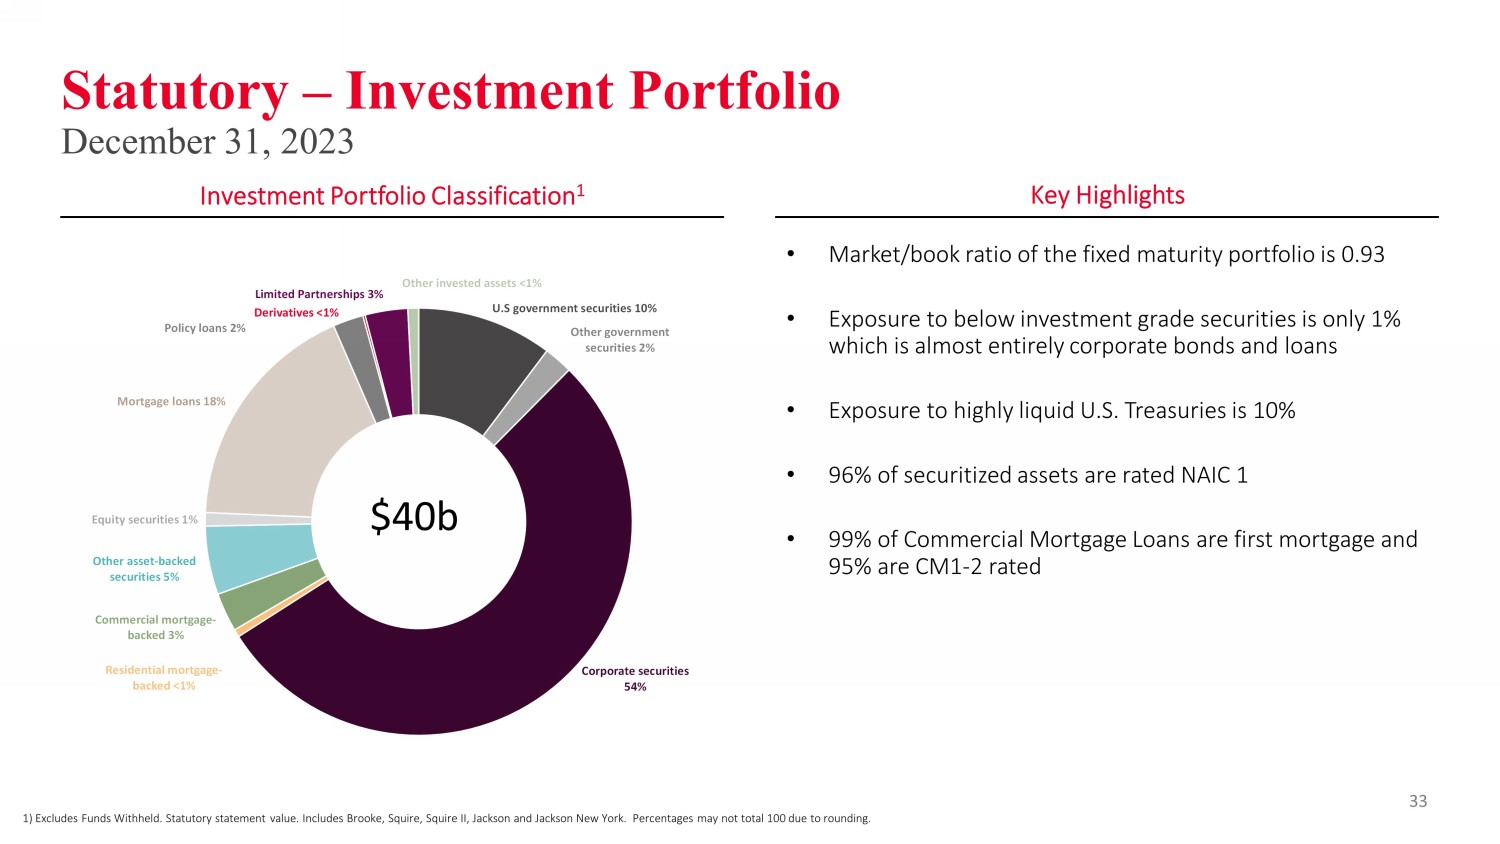
U.S government securities 10% Other government securities 2% Corporate securities 54% Residential mortgage - backed <1% Commercial mortgage - backed 3% Other asset - backed securities 5% Equity securities 1% Mortgage loans 18% Policy loans 2% Derivatives <1% Limited Partnerships 3% Other invested assets <1% Statutory – Investment Portfolio December 31, 2023 1) Excludes Funds Withheld. Statutory statement value. Includes Brooke, Squire, Squire II, Jackson and Jackson New York. Per cen tages may not total 100 due to rounding. Investment Portfolio Classification 1 Key Highlights • Market/book ratio of the fixed maturity portfolio is 0.93 • Exposure to below investment grade securities is only 1% which is almost entirely corporate bonds and loans • Exposure to highly liquid U.S. Treasuries is 10% • 96% of securitized assets are rated NAIC 1 • 99% of Commercial Mortgage Loans are first mortgage and 95% are CM1 - 2 rated 33 $40b
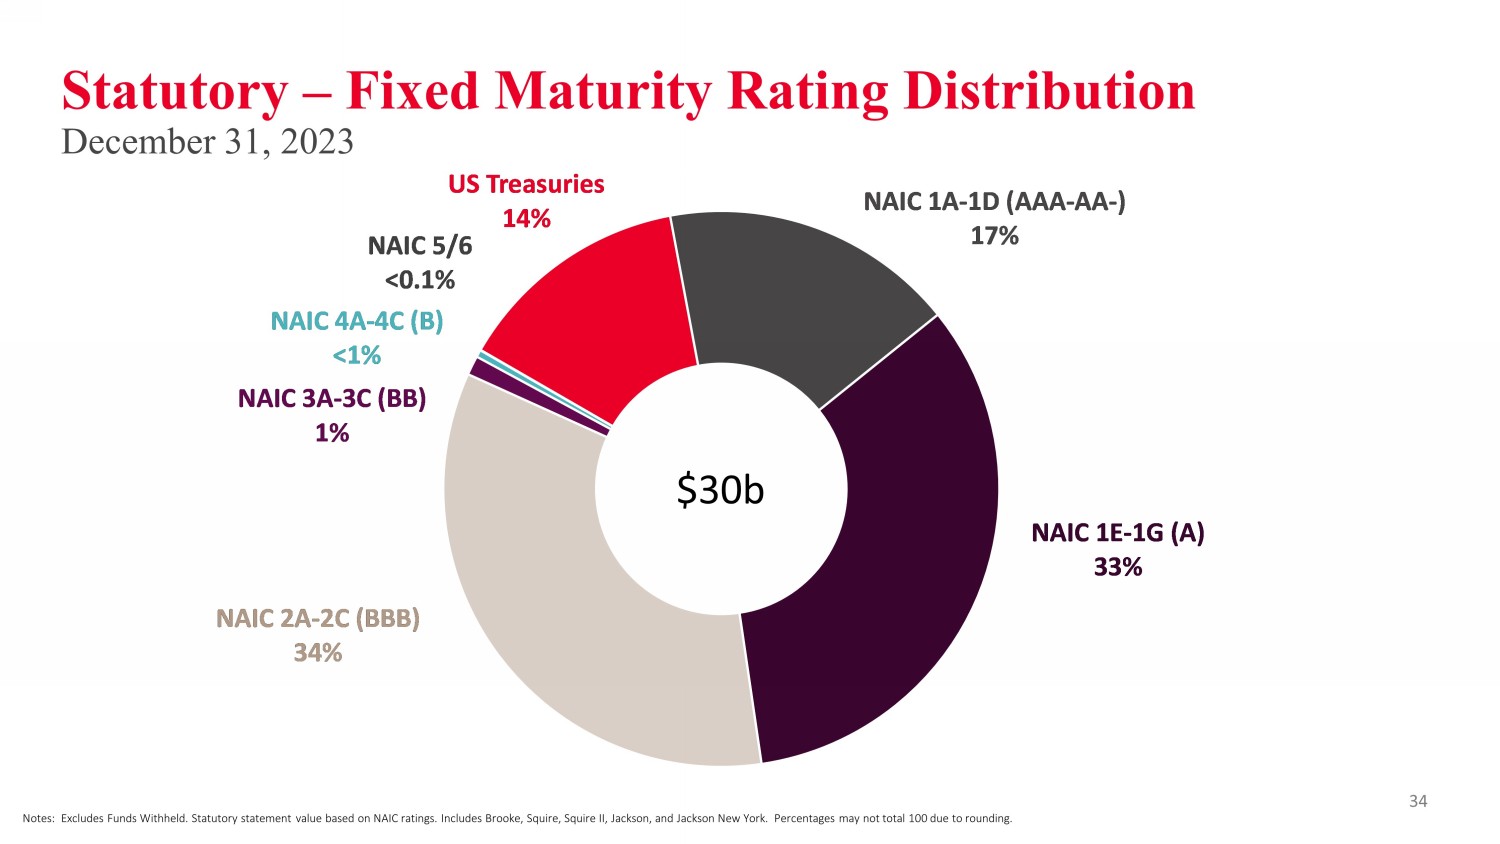
US Treasuries 14% NAIC 1A - 1D (AAA - AA - ) 17% NAIC 1E - 1G (A) 33% NAIC 2A - 2C (BBB) 34% NAIC 3A - 3C (BB) 1% NAIC 4A - 4C (B) <1% NAIC 5/6 <0.1% Statutory – Fixed Maturity Rating Distribution December 31, 2023 Notes: Excludes Funds Withheld. Statutory statement value based on NAIC ratings. Includes Brooke, Squire, Squire II, Jackson , a nd Jackson New York. Percentages may not total 100 due to rounding. $30b 34
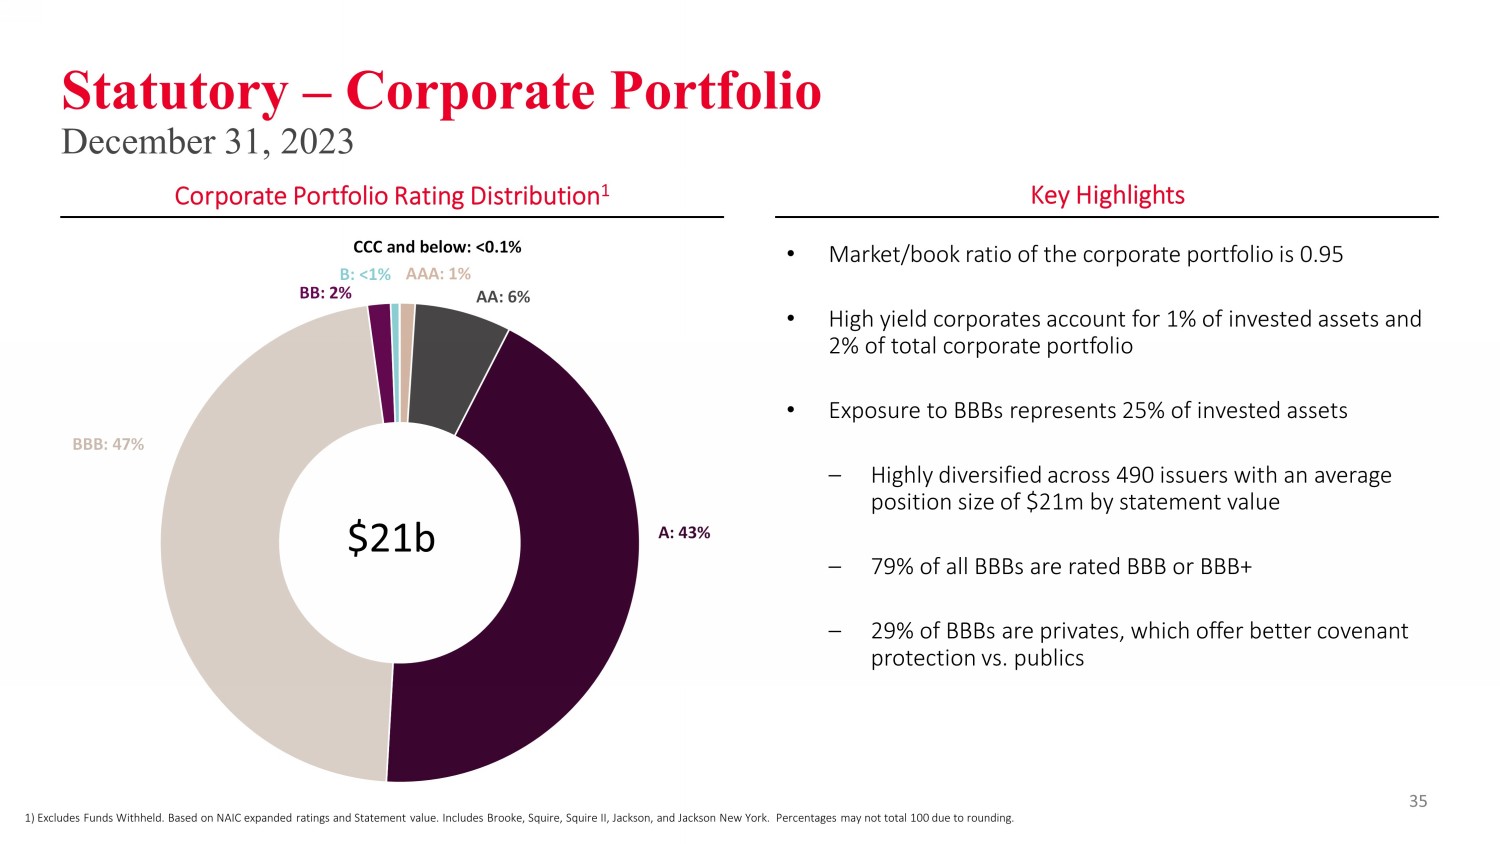
AAA: 1% AA: 6% A: 43% BBB: 47% BB: 2% B: <1% CCC and below: <0.1% Statutory – Corporate Portfolio December 31, 2023 1) Excludes Funds Withheld. Based on NAIC expanded ratings and Statement value. Includes Brooke, Squire, Squire II, Jackson, and Jackson New York. Percentages may not total 100 due to rounding. Corporate Portfolio Rating Distribution 1 Key Highlights • Market/book ratio of the corporate portfolio is 0.95 • High yield corporates account for 1% of invested assets and 2% of total corporate portfolio • Exposure to BBBs represents 25% of invested assets ‒ Highly diversified across 490 issuers with an average position size of $21m by statement value ‒ 79% of all BBBs are rated BBB or BBB+ ‒ 29% of BBBs are privates, which offer better covenant protection vs. publics $21b 35
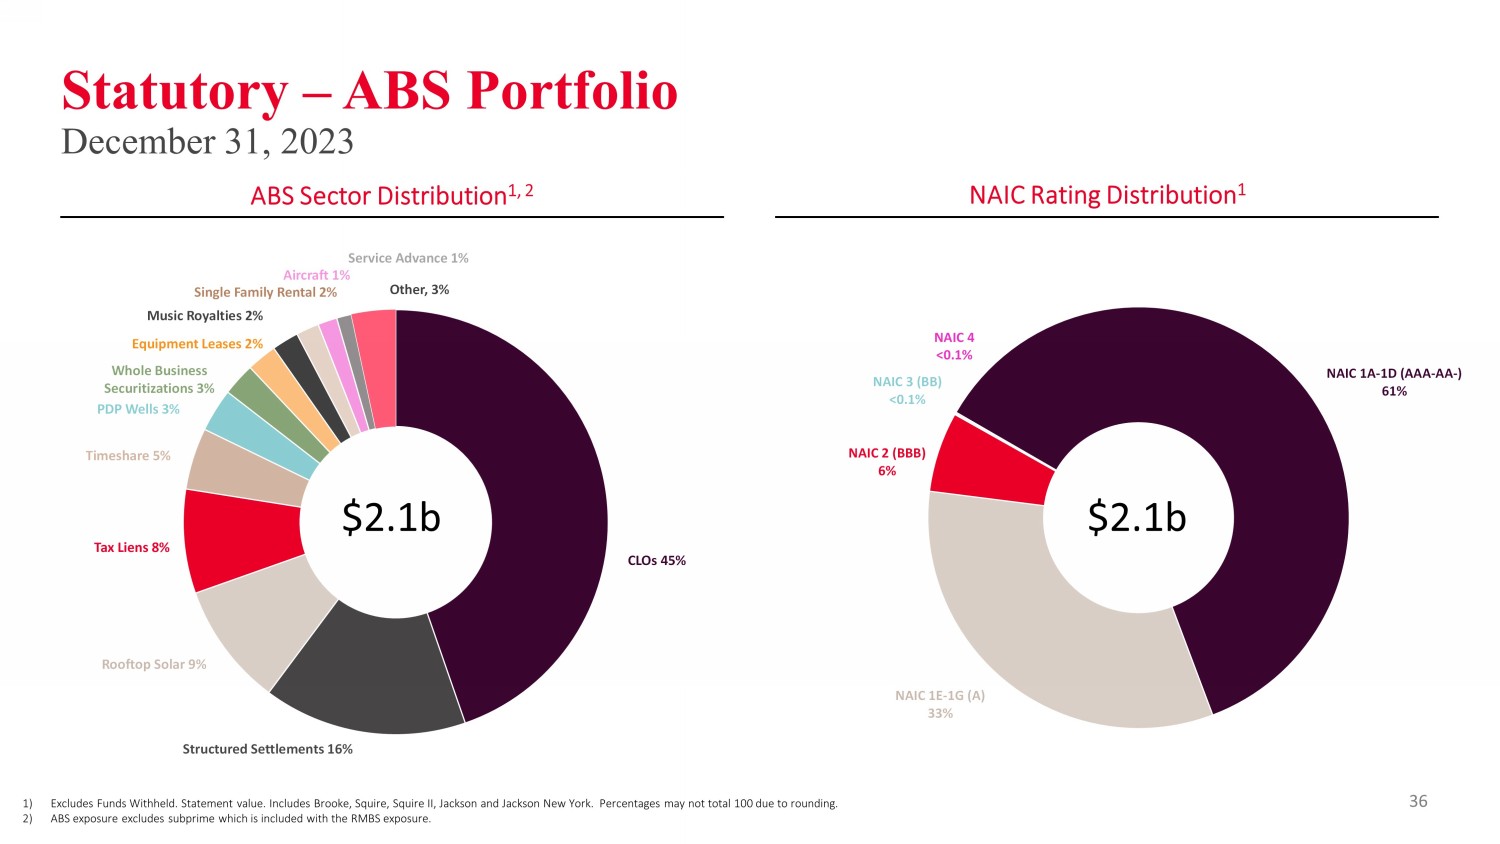
NAIC 1A - 1D (AAA - AA - ) 61% NAIC 1E - 1G (A) 33% NAIC 2 (BBB) 6% NAIC 3 (BB) <0.1% NAIC 4 <0.1% CLOs 45% Structured Settlements 16% Rooftop Solar 9% Tax Liens 8% Timeshare 5% PDP Wells 3% Whole Business Securitizations 3% Equipment Leases 2% Music Royalties 2% Single Family Rental 2% Aircraft 1% Service Advance 1% Other , 3% Statutory – ABS Portfolio December 31, 2023 1) Excludes Funds Withheld. Statement value. Includes Brooke, Squire, Squire II, Jackson and Jackson New York. Percentages may not total 100 due to rounding. 2) ABS exposure excludes subprime which is included with the RMBS exposure. $2.1b ABS Sector Distribution 1, 2 NAIC Rating Distribution 1 $2.1b 36
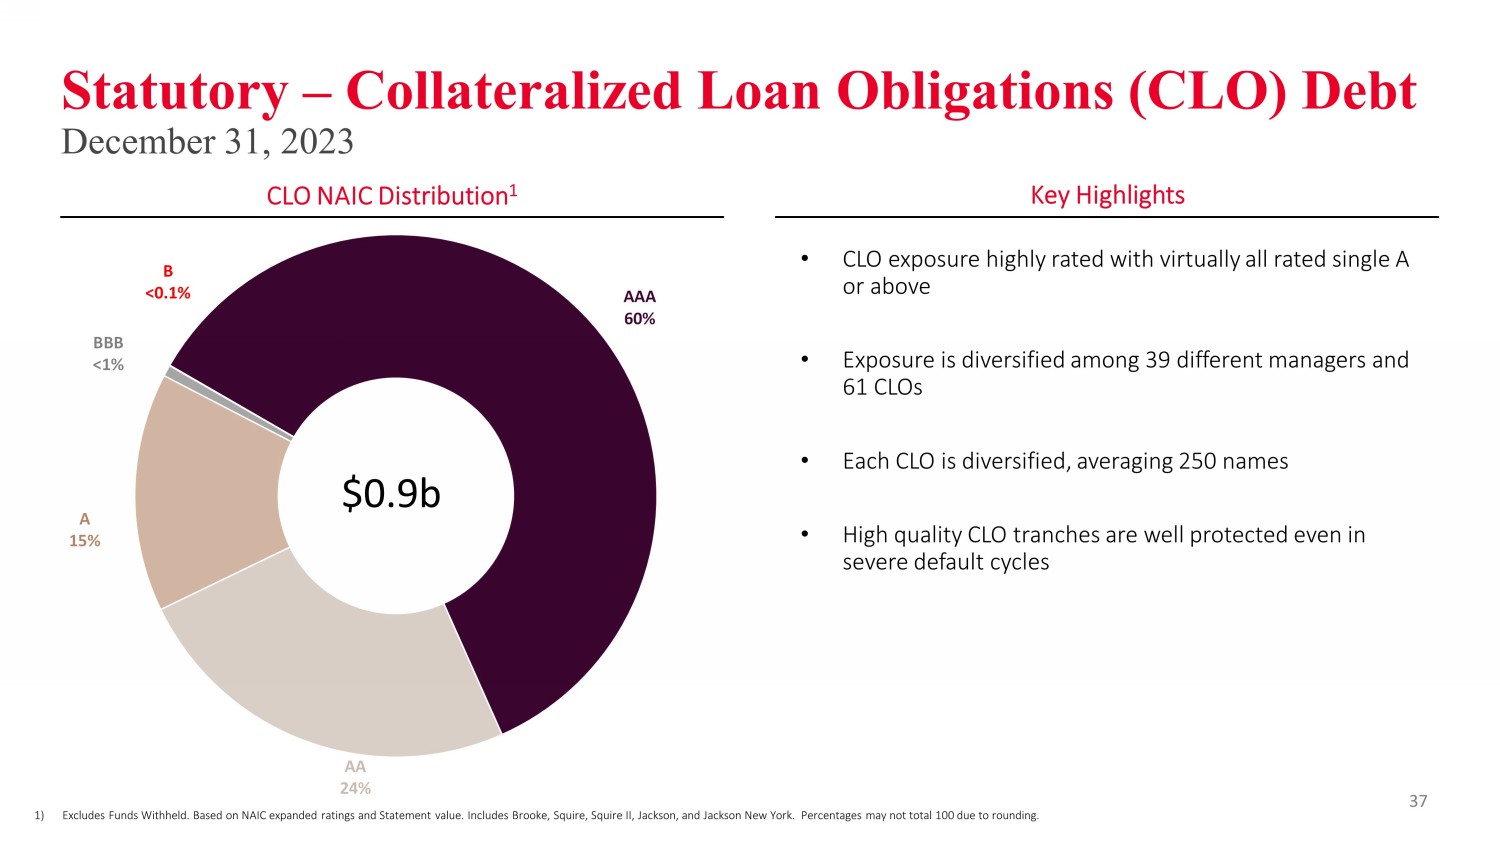
AAA 60% AA 24% A 15% BBB <1% B <0.1% Statutory – Collateralized Loan Obligations (CLO) Debt December 31, 2023 1) Excludes Funds Withheld. Based on NAIC expanded ratings and Statement value. Includes Brooke, Squire, Squire II, Jackson, and Ja ckson New York. Percentages may not total 100 due to rounding. CLO NAIC Distribution 1 Key Highlights • CLO exposure highly rated with virtually all rated single A or above • Exposure is diversified among 39 different managers and 61 CLOs • Each CLO is diversified, averaging 250 names • High quality CLO tranches are well protected even in severe default cycles $0.9b 37

CM 1 69% CM 2 28% CM 3/4 3% Statutory – Commercial Mortgage Loan Portfolio 1 December 31, 2023 CML NAIC Distribution 2 CML Property Type Distribution 2 • Highly diversified with an average loan size of $19m • 99% are senior/first mortgage loans • 97% of the portfolio has the highest ratings of CM1 - 2 • Weighted average loan - to - value based on 2023 internal valuation is 51.8% • Weighted average debt service coverage is 2.2x • No delinquencies and no foreclosed/REO at 12/31/23 $7.1b 38 Loan - to - Value / Debt Service Coverage 3 $7.1b Debt Service Coverage Ratio >1.5x 1.25x - 1.50x 1.0x - 1.25x <1.0x Total Loan - to - Value <60% 60.4% 5.1% 3.3% 0.4% 69.2% 60 - 70% 14.2% 1.7% 5.3% 1.0% 22.1% 70 - 80% 2.9% 0.8% 1.0% 0.6% 5.3% >80% 1.1% 0.4% 1.4% 0.6% 3.4% Total 78.5% 8.0% 10.9% 2.6% 100.0% 1) Excludes Funds Withheld. Based on NAIC expanded ratings and Statement value, which is net of specific credit loss reserves of $6 6 million. Includes Brooke, Squire, Squire II, Jackson, and Jackson New York. 2) Percentages may not total 100 due to rounding. 3) Loan - to - value based on internal value based on annual valuation process that uses the latest available property - level data combi ned with updated market vacancy, rental, and capitalization rates. This valuation process is typically completed by the end of Q3. In addition, loans of elevated concern may be subject to either a broker opinion of value (BOV) or MAI appraisal on an as - needed basis. Perc entages may not sum, due to rounding. Multi - Family 28% Retail 23% Industrial 25% Office 10% Hotels 10% Other 4%
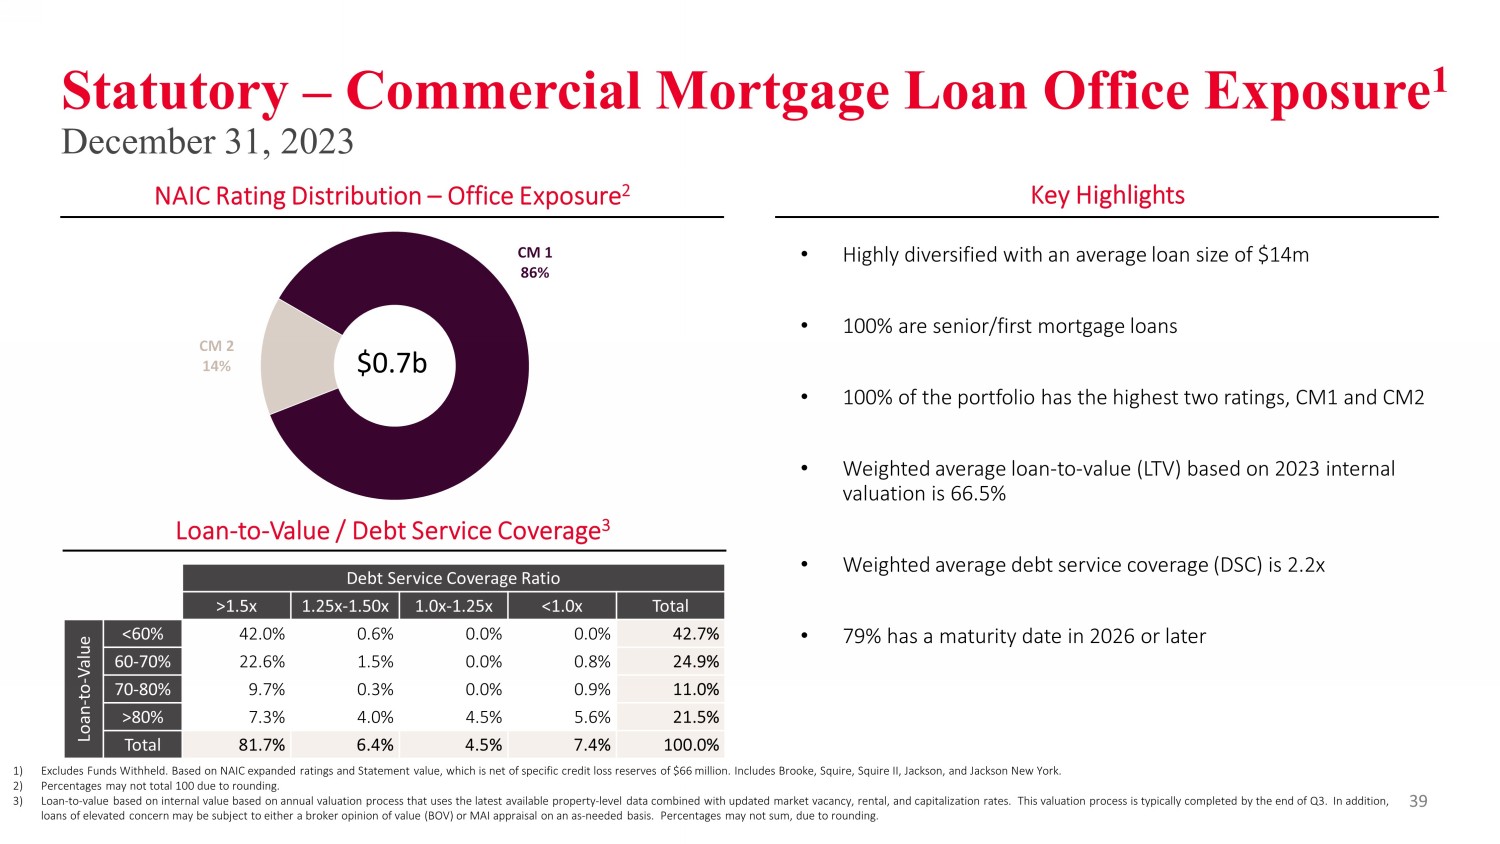
CM 1 86% CM 2 14% Statutory – Commercial Mortgage Loan Office Exposure 1 December 31, 2023 NAIC Rating Distribution – Office Exposure 2 Key Highlights • Highly diversified with an average loan size of $14m • 100% are senior/first mortgage loans • 100% of the portfolio has the highest two ratings, CM1 and CM2 • Weighted average loan - to - value (LTV) based on 2023 internal valuation is 66.5% • Weighted average debt service coverage (DSC) is 2.2x • 79% has a maturity date in 2026 or later $0.7b 39 Loan - to - Value / Debt Service Coverage 3 1) Excludes Funds Withheld. Based on NAIC expanded ratings and Statement value, which is net of specific credit loss reserves of $6 6 million. Includes Brooke, Squire, Squire II, Jackson, and Jackson New York. 2) Percentages may not total 100 due to rounding. 3) Loan - to - value based on internal value based on annual valuation process that uses the latest available property - level data combi ned with updated market vacancy, rental, and capitalization rates. This valuation process is typically completed by the end of Q3. In addition, loans of elevated concern may be subject to either a broker opinion of value (BOV) or MAI appraisal on an as - needed basis. Perc entages may not sum, due to rounding. Debt Service Coverage Ratio >1.5x 1.25x - 1.50x 1.0x - 1.25x <1.0x Total Loan - to - Value <60% 42.0% 0.6% 0.0% 0.0% 42.7% 60 - 70% 22.6% 1.5% 0.0% 0.8% 24.9% 70 - 80% 9.7% 0.3% 0.0% 0.9% 11.0% >80% 7.3% 4.0% 4.5% 5.6% 21.5% Total 81.7% 6.4% 4.5% 7.4% 100.0%

Appendix

VA Market Risk Benefits 41 Liability Effect Category Runs Through: Description of Impact Drivers Changes in Interest Rates Net Income Movement in risk free rates (impacts both assumed future separate account returns and discounting of cash flows) Fund Performance Net Income Separate account returns gross of fees Changes in Equity Index Volatility Net Income Movement in implied volatility Expected Policyholder Behavior Net Income Policyholder behavior as assumed in reserving Actual Policyholder Behavior Net Income Difference between actual behavior during the period vs. assumptions Time Net Income Effect of passage of time – including reduction to separate account balances from fees, the change in proximity of future cash flows, and impacts to policy features such as bonus credits Changes in Assumptions Net Income Changes in assumptions resulting from annual review Changes in Non - Performance Risk AOCI Changes in Jackson’s own credit spread

Non - GAAP Financial Measures In addition to presenting our results of operations and financial condition in accordance with U.S. GAAP, we use and report, sel ected non - GAAP financial measures. Management believes that the use of these non - GAAP financial measures, together with relevant U.S. GAAP financial measures, provides a better understanding of our results of op era tions, financial condition and the underlying performance drivers of our business. These non - GAAP financial measures should be considered supplementary to our results of operations and financial condition that are pres ent ed in accordance with U.S. GAAP and should not be viewed as a substitute for the U.S. GAAP financial measures. Other companies may use similarly titled non - GAAP financial measures that are calculated differently from th e way we calculate such measures. Consequently, our non - GAAP financial measures may not be comparable to similar measures used by other companies. These non - GAAP financial measures should not be viewed as substitutes for the most directly comparable financial measures calculated in accordance with U.S. GAAP. Adjusted Operating Earnings Adjusted Operating Earnings is an after - tax non - GAAP financial measure, which we believe should be used to evaluate our financia l performance on a consolidated basis by excluding certain items that may be highly variable from period to period due to accounting treatment under U.S. GAAP or that are non - recurring in nature, as well as certa in other revenues and expenses that we do not view as driving our underlying performance. Adjusted Operating Earnings should not be used as a substitute for net income as calculated in accordance with U .S. GAAP. However, we believe the adjustments to net income are useful for gaining an understanding of our overall results of operations. Adjusted Operating Earnings equals our Net income (loss) attributable to Jackson Financial Inc. common shareholders (which ex clu des income attributable to non - controlling interest and dividends on preferred stock) adjusted to eliminate the impact of the items described in the following numbered paragraphs. These items are excluded as th ey may vary significantly from period to period due to near - term market conditions or are otherwise not directly comparable or reflective of the underlying performance of our business. We believe these exclusions p rov ide investors a better picture of the drivers of our underlying performance. 1) Net Hedging Results: Comprised of: ( i ) fees attributed to guaranteed benefits; (ii) changes in the fair value of freestanding derivatives used to manage the risk ass ociated with market risk benefits and other guaranteed benefit features; (iii) the movements in reserves, market risk benefits, guaranteed benefit features accounted for as embedded derivative instruments, and related claims and benefit payments; (iv) amortization of the balance of unamortized deferred acquisition costs at the date of transition to current accounting guidanc e o n January 1, 2021 associated with items excluded from adjusted operating earnings prior to transition; and (v) the impact on the valuation of Guaranteed Benefits and Net Hedging Results arising from changes in underlying actuarial assumptions. We believe excluding these items removes the impact to both revenue and related expenses associated with Guaranteed Benefits and Net Hedging Results. 2) Net Realized Investment Gains and Losses: Comprised of: ( i ) realized investment gains and losses associated with the periodic sales or disposals of securities, excluding those held wi thi n our trading portfolio; and (ii) impairments of securities, after adjustment for the non - credit component of the impairment charges. 3) Change in Value of Funds Withheld Embedded Derivative and Net investment income on funds withheld assets: Comprised of ( i ) the change in fair value of funds withheld embedded derivatives; and (ii) net investment income on funds withheld assets related to funds withheld reinsurance transactions. 4) Other items: Comprised of: ( i ) the impact of investments that are consolidated in our financial statements due to U.S. GAAP accounting requirements, such as our investments in collateralized loan obligations (CLOs), but for which the consolidation effects are not consistent with our economic interest or exposure to those entities; and (ii) one - time or other non - recurring items, such as costs relating to our separation from Prudential. Operating income taxes are calculated using the prevailing corporate federal income tax rate of 21% while taking into account any items recognized d iff erently in our financial statements and federal income tax returns, including the dividends received deduction and other tax credits. For interim reporting periods, the Company uses an es timated annual effective tax rate ("ETR") in computing its tax provision including consideration of discrete items. 42

Non - GAAP Financial Measures Adjusted Book Value Attributable to Common Shareholders Adjusted Book Value Attributable to Common Shareholders excludes Preferred Stock and Accumulated Other Comprehensive Income ( Los s) ("AOCI") attributable to Jackson Financial Inc ("JFI"), which does not include AOCI arising from investments held within the funds withheld account related to the Athene Reinsurance Transaction. We exclud e A OCI attributable to JFI from Adjusted Book Value Attributable to Common Shareholders because our invested assets are generally invested to closely match the duration of our liabilities, which are l ong er duration in nature, and therefore we believe period - to - period fair market value fluctuations in AOCI to be inconsistent with this objective. We believe excluding AOCI attributable to JFI is more useful to inv estors in analyzing trends in our business. Changes in AOCI within the funds withheld account related to the Athene Reinsurance Transaction offset the related non - operating earnings from the Athene Reinsurance Transactions resulting in a minimal net impact on Adjusted Book Value of Jackson Financial Inc. Adjusted Operating Return on Equity Attributable to Common Shareholders We use Adjusted Operating Return on Equity (“ROE”) Attributable to Common Shareholders to manage our business and evaluate ou r f inancial performance which: ( i ) excludes items that vary from period - to - period due to accounting treatment under U.S. GAAP or that are non - recurring in nature, as such items may distort the underlying performanc e of our business; and (ii) is calculated by dividing our Adjusted Operating Earnings by average Adjusted Book Value Attributable to Common Shareholders. Adjusted Book Value Attributable to Common Shareholders and Adjusted Operating ROE Attributable to Common Shareholders should no t be used as substitutes for total shareholders’ equity and ROE as calculated using annualized net income and average equity in accordance with U.S. GAAP. However, we believe the adjustments to equity and earn ing s are useful to gaining an understanding of our overall results of operations. Notable Items Notable items reflect the impact on our results of certain items or events that may or may not have been anticipated and resu lte d in volatility in the Company's earnings expectations. The presentation of notable items is intended to help investors better understand our results for the period and to evaluate and forecast those results. 43
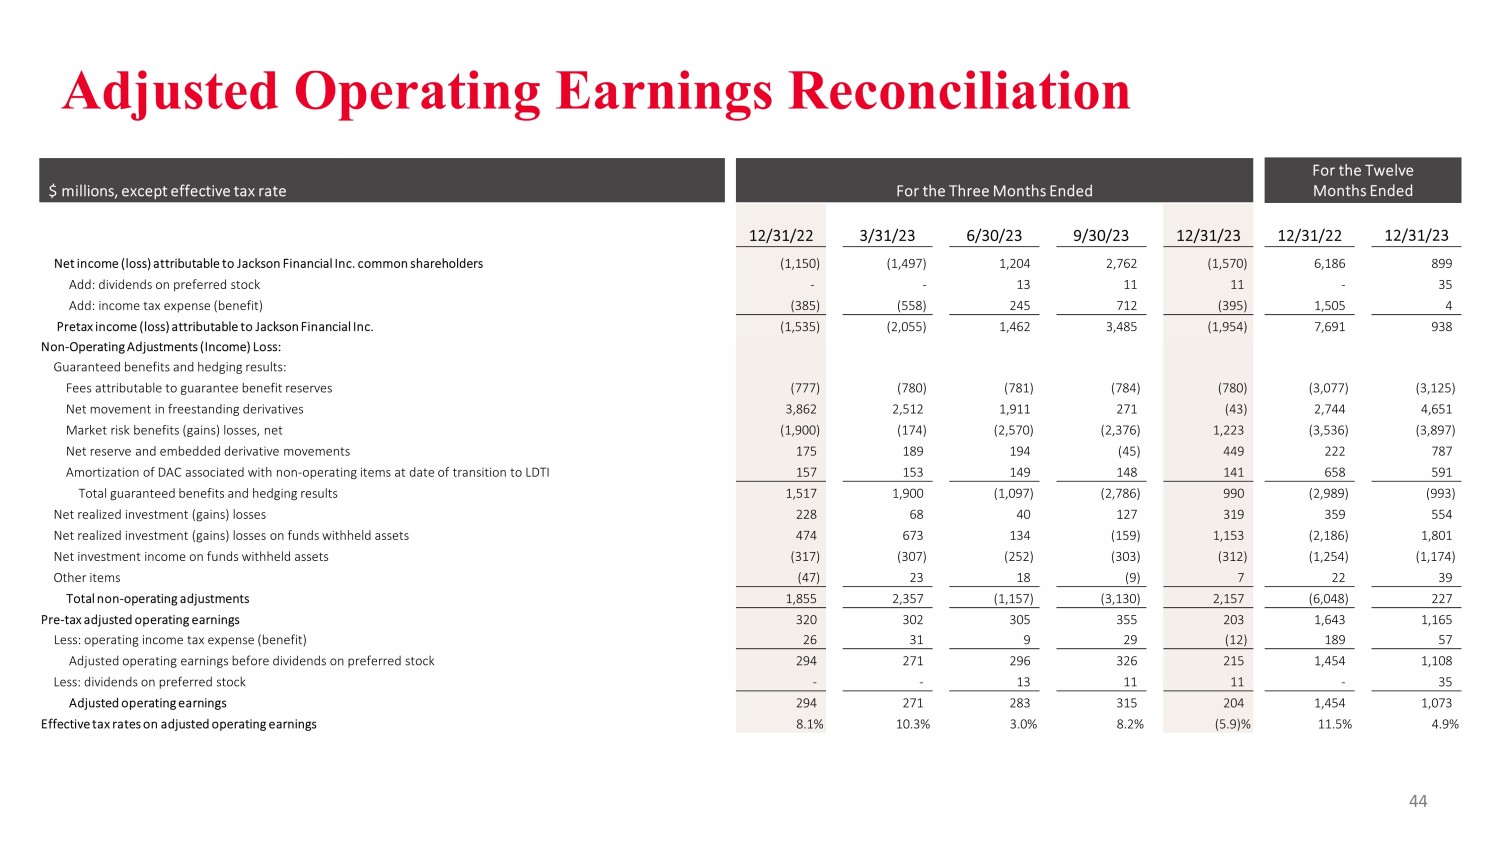
Adjusted Operating Earnings Reconciliation $ millions, except effective tax rate For the Three Months Ended For the Twelve Months Ended 12/31/22 3/31/23 6/30/23 9/30/23 12/31/23 12/31/22 12/31/23 Net income (loss) attributable to Jackson Financial Inc. common shareholders (1,150) (1,497) 1,204 2,762 (1,570) 6,186 899 Add: dividends on preferred stock - - 13 11 11 - 35 Add: income tax expense (benefit) (385) (558) 245 712 (395) 1,505 4 Pretax income (loss) attributable to Jackson Financial Inc. (1,535) (2,055) 1,462 3,485 (1,954) 7,691 938 Non - Operating Adjustments (Income) Loss: Guaranteed benefits and hedging results: Fees attributable to guarantee benefit reserves (777) (780) (781) (784) (780) (3,077) (3,125) Net movement in freestanding derivatives 3,862 2,512 1,911 271 (43) 2,744 4,651 Market risk benefits (gains) losses, net (1,900) (174) (2,570) (2,376) 1,223 (3,536) (3,897) Net reserve and embedded derivative movements 175 189 194 (45) 449 222 787 Amortization of DAC associated with non - operating items at date of transition to LDTI 157 153 149 148 141 658 591 Total guaranteed benefits and hedging results 1,517 1,900 (1,097) (2,786) 990 (2,989) (993) Net realized investment (gains) losses 228 68 40 127 319 359 554 Net realized investment (gains) losses on funds withheld assets 474 673 134 (159) 1,153 (2,186) 1,801 Net investment income on funds withheld assets (317) (307) (252) (303) (312) (1,254) (1,174) Other items (47) 23 18 (9) 7 22 39 Total non - operating adjustments 1,855 2,357 (1,157) (3,130) 2,157 (6,048) 227 Pre - tax adjusted operating earnings 320 302 305 355 203 1,643 1,165 Less: operating income tax expense (benefit) 26 31 9 29 (12) 189 57 Adjusted operating earnings before dividends on preferred stock 294 271 296 326 215 1,454 1,108 Less: dividends on preferred stock - - 13 11 11 - 35 Adjusted operating earnings 294 271 283 315 204 1,454 1,073 Effective tax rates on adjusted operating earnings 8.1% 10.3% 3.0% 8.2% (5.9)% 11.5% 4.9% 44

Select U.S. GAAP to Non - GAAP Reconciliation $ millions, except per share and shares outstanding data For the Three Months Ended For the Twelve Months Ended 12/31/22 3/31/23 6/30/23 9/30/23 12/31/23 12/31/22 12/31/23 Net Income (Loss) (1,158) (1,496) 1,220 2,790 (1,560) 6,229 954 Income attributable to non - controlling interest (8) 1 3 17 (1) 43 20 Net Income (Loss) Attributable to Jackson Financial Inc. (1,150) (1,497) 1,217 2,773 (1,559) 6,186 934 Less: Dividends on preferred stock - - 13 11 11 - 35 Net Income (Loss) Attributable to Jackson Financial Inc. common shareholders [a] (1,150) (1,497) 1,204 2,762 (1,570) 6,186 899 Total Shareholders' Equity 8,646 8,638 8,652 9,478 10,170 8,646 10,170 Less: Preferred Equity - 533 533 533 533 - 533 Total Common Shareholders’ Equity 8,646 8,105 8,119 8,945 9,637 8,646 9,637 Average Common Shareholders' Equity [b] 9,433 8,376 8,112 8,532 9,291 8,881 8,690 Total ROE Attributable to Common Shareholders [a]/[b]; Annualized (48.8)% (71.5)% 59.4% 129.5% (67.6)% 69.7% 10.3% Adjusted Operating Earnings [c] 294 271 283 315 204 1,454 1,073 Adjusted Book Value Attributable to Common Shareholders: Total common shareholders' equity 8,646 8,105 8,119 8,945 9,637 8,646 9,637 Exclude AOCI attributable to Jackson Financial Inc. 1,272 476 1,435 2,926 1,196 1,272 1,196 Adjusted Book Value Attributable to Common Shareholders 9,918 8,581 9,554 11,871 10,833 9,918 10,833 Average Adjusted Book Value Attributable to Common Shareholders[d] 10,427 9,250 9,068 10,713 11,352 8,963 10,151 Adjusted Operating ROE Attributable to Common Shareholders [c]/[d]; Annualized 11.3% 11.7% 12.5% 11.8% 7.2% 16.2% 10.6% Per Share Data (Common Shareholders) Net income (loss) (basic) (13.74) (18.11) 14.58 33.66 (19.64) 72.34 10.99 Net income (loss) (diluted) 1 (13.74) (18.11) 14.21 33.35 (19.64) 69.75 10.76 Adjusted operating earnings per common share (diluted) 3.39 3.15 3.34 3.80 2.53 16.39 12.84 Book value per common share (diluted) 100.56 95.70 98.27 110.64 121.29 100.56 121.29 Adjusted book value per common share (diluted) 115.36 101.32 115.63 146.84 136.34 115.36 136.34 Shares Outstanding Weighted average number of common shares (basic) 83,695,001 82,646,113 82,595,287 82,061,813 79,923,108 85,513,787 81,799,820 Weighted average number of common shares (diluted) 86,807,053 86,082,970 84,754,611 82,821,818 80,716,770 88,690,700 83,577,226 End of period common shares (basic) 82,690,098 81,044,318 81,910,831 80,051,900 78,660,221 82,690,098 78,660,221 End of period common shares (diluted) 85,976,078 84,690,303 82,622,875 80,845,230 79,455,615 85,976,078 79,455,615 45 1) In a quarter in which if we reported a net loss attributable to Jackson Financial Inc., all common stock equivalents are a nti - dilutive and are therefore excluded from the calculation of diluted shares and diluted per share amounts. The shares excluded f rom the diluted EPS calculation were 793,662, 3,436,857 and 3,112,052 for the three months ended December 31, 2023, March 31, 2023, a nd December 31, 2022, respectively.
Glossary Assets Under Management (AUM) - Investment assets that are managed by one of our subsidiaries and includes: ( i ) assets managed by PPM America, Inc. (“PPM”), including our investment portfolio (but excludes assets held in funds withheld accounts for reinsurance transactions), (ii) third - party assets (including our former parent and its affiliates, and (i ii) the separate account assets of our retail annuities managed and administered by Jackson National Asset Management LLC (“JNAM”). Athene Reinsurance Transaction - The funds withheld coinsurance agreement with Athene, entered on June 18, 2020, and effective June 1, 2020, to reinsure a 100 % quota share of a block of our in - force fixed and fixed index annuity liabilities in exchange for approximately $1.2 billion in ceding commissions. Deferred Acquisition Cost (DAC) - Represents the incremental costs related directly to the successful acquisition of new, and certain renewal, insurance polici e s and annuity contracts. The recognition of these costs has been deferred, and the deferred amounts are shown on the balance sheet as an asset, which is subject to amortization over the estimated live s o f those policies and contracts. Derivative Instruments - Jackson Financial Inc.'s (JFI) business model includes the acceptance, monitoring and mitigation of risk. Specifically, JFI c onsiders, among other factors, exposures to interest rate and equity market movements, foreign exchange rates and other asset or liability prices. JFI uses derivative instruments to mitigate or reduce these risk s i n accordance with established policies and goals. JFI's derivative holdings, while effective in managing defined risks, are not structured to meet accounting requirements to be designated as hedging instruments. As a result, freestanding de rivatives are carried at fair value with changes each period recorded in net gains or losses on derivatives and investments. Earnings per Share (EPS) - Basic earnings per share is calculated by dividing net income (loss) attributable to JFI common shareholders by the weighted - a verage number of common shares outstanding during the period. Diluted earnings per share is calculated by dividing the net income (loss) attributable to JFI common shareholders, by the weighted - average numbe r of shares of common stock outstanding for the period, plus shares representing the dilutive effect of share - based awards. Fixed Annuity (FA) - An annuity that guarantees a set annual rate of return with interest at rates we determine, subject to specified minimums. C r edited interest rates are guaranteed not to change for certain limited periods of time, after which rates may reset. Fixed Index Annuity (FIA) - An annuity with an ability to share in the upside from certain financial markets such as equity indices and provides downside protection. Guaranteed Minimum Accumulation Benefit (GMAB) - An add - on benefit (enhanced benefits available for an additional cost) that entitles an owner to a minimum payment, typically in lump - sum, after a set period of time, referred to as the accumulation period. The minimum payment is based on the benefit base, which could be greater than the underlying accoun t v alue. Guaranteed Minimum Death Benefit (GMDB) - An add - on benefit (enhanced benefits available for an additional cost) that guarantees an owner's beneficiaries are entitled t o a minimum payment based on the benefit base, which could be greater than the underlying account value, upon the death of the owner. Guaranteed Minimum Income Benefit (GMIB) - An add - on benefit (available for an additional cost) where an owner is entitled to annuitize the policy and receive a minimum payment stream based on the benefit base, which could be greater than the payment stream resulting from current annuitization of the underlying account value. Guaranteed Minimum Withdrawal Benefit (GMWB) - An add - on benefit (available for an additional cost) where an owner is entitled to withdraw a maximum amount of their benefit base each year, for which cumulative payments to the owner could be greater than the underlying account value. Guaranteed Minimum Withdrawal Benefit for Life (GMWB for Life) - An add - on benefit (available for an additional cost) where an owner is entitled to withdraw the guaranteed annual withdrawal a mount each year for the duration of the policyholder's life, regardless of account performance. LDTI - Accounting Standards Update 2018 - 12, “Targeted Improvements to the Accounting for Long - Duration Contracts”, effective January 1, 2023, with a transition date of January 1, 2021. Net Amount at Risk (NAR) - The greater of Death Benefit NAR (DBNAR) and Living Benefit NAR (LBNAR), as applicable, where DBNAR is the GMDB benefit base i n excess of the account value, and the LBNAR is the actuarial present value of guaranteed living benefits in excess of the account value. 46
Glossary Net Flows - The net change in customer account balances during a period, including gross premiums, surrenders, withdrawals and benefits. Net flows exclude investment performance, interest credited to customer accounts and policy charges. Registered Index - Linked Annuity (RILA) - A registered index - linked annuity, which offers market index - linked investment options, subject to a cap, and offers a variety of guarantees designed to modify or limit losses. Return of Premium (ROP) Death Benefit - This death benefit pays the greater of the account value at the time of a claim following the owner's death or the total cont r ibutions to the contract (subject to adjustment for withdrawals). The charge for this benefit is usually included in the Mortality and Expense fee that is deducted daily from the net assets in ea ch variable investment option. We also refer to this death benefit as the Return of Principal death benefit. Risk Based Capital (RBC) - Statutory minimum level of capital that is required by regulators for an insurer to support its operations. Segment - Retail Annuities JFI's Retail Annuities segment offers a variety of retirement income and savings products through its diverse suite of produc ts, consisting primarily of variable annuities, fixed index annuities, fixed annuities, payout annuities and registered index - linked annuities (“RILA”). These products are distributed through various wirehouses, insurance brokers and in dependent broker - dealers, as well as through banks and financial institutions, primarily to high - net - worth investors and the mass and affluent markets. The financial results of the variable annuity business within the Company’s Retail Annuities segment are largely dependent on th e performance of the contract holder account value, which impacts both the level of fees collected and the benefits paid to the contract holder. The financial results of the Company’s fixed annuities, including the fixed option on var iable annuities, RILA and fixed index annuities, are largely dependent on the Company's ability to earn a spread between earned investment rates on general account assets and the interest credited to contract holders. Segment - Institutional Products JFI's Institutional Products consist of traditional guaranteed investment contracts (“GICs”), funding agreements (including a gre ements issued in conjunction with JFI's participation in the U.S. Federal Home Loan Bank (“FHLB”) program) and Medium - Term Note funding agreements. JFI's GIC products are marketed to defined contribution pension and profit - sharing ret irement plans. Funding agreements are marketed to institutional investors, including corporate cash accounts and securities lending funds, as well as money market funds, and are issued to the FHLB in connection with its progr am. The financial results of JFI's Institutional Products business are primarily dependent on Company’s ability to earn a spread bet ween earned investment rates on general account assets and the interest credited on GICs and funding agreements. Segment - Closed Life and Annuity Blocks JFI’s Closed Life and Annuity Blocks segment is primarily composed of blocks of business that have been acquired since 2004. Th e segment includes various protection products, primarily whole life, universal life, variable universal life, and term life insurance products as well as fixed, fixed index, and payout annuities. The Closed Life and Annuity Blocks seg men t also includes a block of group payout annuities that we assumed from John Hancock Life Insurance Company (USA) and John Hancock Life Insurance Company of New York through reinsurance transactions in 2018 and 2019, respecti vel y. The Company historically offered traditional and interest - sensitive life insurance products but discontinued new sales of life insurance products in 2012, as we believe opportunistically acquiring mature blocks of life in sur ance policies is a more efficient means of diversifying our in - force business than selling new life insurance products. The profitability of JFI's Closed Life and Annuity Blocks segment is largely driven by its historical ability to appropriatel y p rice its products and purchase appropriately priced blocks of business, as realized through underwriting, expense and net gains (losses) on derivatives and investments, and the ability to earn an assumed rate of return on the assets suppor tin g that business. Variable Annuity (VA) - An annuity that offers tax - deferred investment into a range of asset classes and a variable return, which offers insurance fea tures related to potential future income payments. 47
v3.24.0.1
| X |
- DefinitionBoolean flag that is true when the XBRL content amends previously-filed or accepted submission.
| Name: |
dei_AmendmentFlag |
| Namespace Prefix: |
dei_ |
| Data Type: |
xbrli:booleanItemType |
| Balance Type: |
na |
| Period Type: |
duration |
|
| X |
- DefinitionFor the EDGAR submission types of Form 8-K: the date of the report, the date of the earliest event reported; for the EDGAR submission types of Form N-1A: the filing date; for all other submission types: the end of the reporting or transition period. The format of the date is YYYY-MM-DD.
| Name: |
dei_DocumentPeriodEndDate |
| Namespace Prefix: |
dei_ |
| Data Type: |
xbrli:dateItemType |
| Balance Type: |
na |
| Period Type: |
duration |
|
| X |
- DefinitionThe type of document being provided (such as 10-K, 10-Q, 485BPOS, etc). The document type is limited to the same value as the supporting SEC submission type, or the word 'Other'.
| Name: |
dei_DocumentType |
| Namespace Prefix: |
dei_ |
| Data Type: |
dei:submissionTypeItemType |
| Balance Type: |
na |
| Period Type: |
duration |
|
| X |
- DefinitionAddress Line 1 such as Attn, Building Name, Street Name
| Name: |
dei_EntityAddressAddressLine1 |
| Namespace Prefix: |
dei_ |
| Data Type: |
xbrli:normalizedStringItemType |
| Balance Type: |
na |
| Period Type: |
duration |
|
| X |
- Definition
+ References
+ Details
| Name: |
dei_EntityAddressCityOrTown |
| Namespace Prefix: |
dei_ |
| Data Type: |
xbrli:normalizedStringItemType |
| Balance Type: |
na |
| Period Type: |
duration |
|
| X |
- DefinitionCode for the postal or zip code
| Name: |
dei_EntityAddressPostalZipCode |
| Namespace Prefix: |
dei_ |
| Data Type: |
xbrli:normalizedStringItemType |
| Balance Type: |
na |
| Period Type: |
duration |
|
| X |
- DefinitionName of the state or province.
| Name: |
dei_EntityAddressStateOrProvince |
| Namespace Prefix: |
dei_ |
| Data Type: |
dei:stateOrProvinceItemType |
| Balance Type: |
na |
| Period Type: |
duration |
|
| X |
- DefinitionA unique 10-digit SEC-issued value to identify entities that have filed disclosures with the SEC. It is commonly abbreviated as CIK. Reference 1: http://www.xbrl.org/2003/role/presentationRef
-Publisher SEC
-Name Exchange Act
-Number 240
-Section 12
-Subsection b-2
| Name: |
dei_EntityCentralIndexKey |
| Namespace Prefix: |
dei_ |
| Data Type: |
dei:centralIndexKeyItemType |
| Balance Type: |
na |
| Period Type: |
duration |
|
| X |
- DefinitionIndicate if registrant meets the emerging growth company criteria. Reference 1: http://www.xbrl.org/2003/role/presentationRef
-Publisher SEC
-Name Exchange Act
-Number 240
-Section 12
-Subsection b-2
| Name: |
dei_EntityEmergingGrowthCompany |
| Namespace Prefix: |
dei_ |
| Data Type: |
xbrli:booleanItemType |
| Balance Type: |
na |
| Period Type: |
duration |
|
| X |
- DefinitionCommission file number. The field allows up to 17 characters. The prefix may contain 1-3 digits, the sequence number may contain 1-8 digits, the optional suffix may contain 1-4 characters, and the fields are separated with a hyphen.
| Name: |
dei_EntityFileNumber |
| Namespace Prefix: |
dei_ |
| Data Type: |
dei:fileNumberItemType |
| Balance Type: |
na |
| Period Type: |
duration |
|
| X |
- DefinitionTwo-character EDGAR code representing the state or country of incorporation.
| Name: |
dei_EntityIncorporationStateCountryCode |
| Namespace Prefix: |
dei_ |
| Data Type: |
dei:edgarStateCountryItemType |
| Balance Type: |
na |
| Period Type: |
duration |
|
| X |
- DefinitionThe exact name of the entity filing the report as specified in its charter, which is required by forms filed with the SEC. Reference 1: http://www.xbrl.org/2003/role/presentationRef
-Publisher SEC
-Name Exchange Act
-Number 240
-Section 12
-Subsection b-2
| Name: |
dei_EntityRegistrantName |
| Namespace Prefix: |
dei_ |
| Data Type: |
xbrli:normalizedStringItemType |
| Balance Type: |
na |
| Period Type: |
duration |
|
| X |
- DefinitionThe Tax Identification Number (TIN), also known as an Employer Identification Number (EIN), is a unique 9-digit value assigned by the IRS. Reference 1: http://www.xbrl.org/2003/role/presentationRef
-Publisher SEC
-Name Exchange Act
-Number 240
-Section 12
-Subsection b-2
| Name: |
dei_EntityTaxIdentificationNumber |
| Namespace Prefix: |
dei_ |
| Data Type: |
dei:employerIdItemType |
| Balance Type: |
na |
| Period Type: |
duration |
|
| X |
- DefinitionLocal phone number for entity.
| Name: |
dei_LocalPhoneNumber |
| Namespace Prefix: |
dei_ |
| Data Type: |
xbrli:normalizedStringItemType |
| Balance Type: |
na |
| Period Type: |
duration |
|
| X |
- DefinitionBoolean flag that is true when the Form 8-K filing is intended to satisfy the filing obligation of the registrant as pre-commencement communications pursuant to Rule 13e-4(c) under the Exchange Act. Reference 1: http://www.xbrl.org/2003/role/presentationRef
-Publisher SEC
-Name Exchange Act
-Number 240
-Section 13e
-Subsection 4c
| Name: |
dei_PreCommencementIssuerTenderOffer |
| Namespace Prefix: |
dei_ |
| Data Type: |
xbrli:booleanItemType |
| Balance Type: |
na |
| Period Type: |
duration |
|
| X |
- DefinitionBoolean flag that is true when the Form 8-K filing is intended to satisfy the filing obligation of the registrant as pre-commencement communications pursuant to Rule 14d-2(b) under the Exchange Act. Reference 1: http://www.xbrl.org/2003/role/presentationRef
-Publisher SEC
-Name Exchange Act
-Number 240
-Section 14d
-Subsection 2b
| Name: |
dei_PreCommencementTenderOffer |
| Namespace Prefix: |
dei_ |
| Data Type: |
xbrli:booleanItemType |
| Balance Type: |
na |
| Period Type: |
duration |
|
| X |
- DefinitionTitle of a 12(b) registered security. Reference 1: http://www.xbrl.org/2003/role/presentationRef
-Publisher SEC
-Name Exchange Act
-Number 240
-Section 12
-Subsection b
| Name: |
dei_Security12bTitle |
| Namespace Prefix: |
dei_ |
| Data Type: |
dei:securityTitleItemType |
| Balance Type: |
na |
| Period Type: |
duration |
|
| X |
- DefinitionName of the Exchange on which a security is registered. Reference 1: http://www.xbrl.org/2003/role/presentationRef
-Publisher SEC
-Name Exchange Act
-Number 240
-Section 12
-Subsection d1-1
| Name: |
dei_SecurityExchangeName |
| Namespace Prefix: |
dei_ |
| Data Type: |
dei:edgarExchangeCodeItemType |
| Balance Type: |
na |
| Period Type: |
duration |
|
| X |
- DefinitionBoolean flag that is true when the Form 8-K filing is intended to satisfy the filing obligation of the registrant as soliciting material pursuant to Rule 14a-12 under the Exchange Act. Reference 1: http://www.xbrl.org/2003/role/presentationRef
-Publisher SEC
-Name Exchange Act
-Section 14a
-Number 240
-Subsection 12
| Name: |
dei_SolicitingMaterial |
| Namespace Prefix: |
dei_ |
| Data Type: |
xbrli:booleanItemType |
| Balance Type: |
na |
| Period Type: |
duration |
|
| X |
- DefinitionTrading symbol of an instrument as listed on an exchange.
| Name: |
dei_TradingSymbol |
| Namespace Prefix: |
dei_ |
| Data Type: |
dei:tradingSymbolItemType |
| Balance Type: |
na |
| Period Type: |
duration |
|
| X |
- DefinitionBoolean flag that is true when the Form 8-K filing is intended to satisfy the filing obligation of the registrant as written communications pursuant to Rule 425 under the Securities Act. Reference 1: http://www.xbrl.org/2003/role/presentationRef
-Publisher SEC
-Name Securities Act
-Number 230
-Section 425
| Name: |
dei_WrittenCommunications |
| Namespace Prefix: |
dei_ |
| Data Type: |
xbrli:booleanItemType |
| Balance Type: |
na |
| Period Type: |
duration |
|
Jackson Financial (NYSE:JXN)
Historical Stock Chart
From Jul 2024 to Aug 2024

Jackson Financial (NYSE:JXN)
Historical Stock Chart
From Aug 2023 to Aug 2024
