BOK Financial Corporation’s (BOKF)
fourth-quarter 2011 earnings came in at 98 cents per share, below
the Zacks Consensus Estimate by 12 cents. Results were, however,
above 86 cents per share in the prior-year quarter, although it
missed the prior quarter's earnings of $1.24 per share.
The earnings results primarily reflect a decrease in net
interest revenue and lower fees and commissions sequentially,
thereby leading to reduced top-line growth. However, these
negatives were partially offset by decreased operating expenses.
Moreover, improved credit quality and growth in loans and deposits
were also positives for the quarter.
Net income in the reported quarter was $67.0 million compared
with $85.1 million in the prior quarter and $58.8 million in the
prior-year quarter.
For full-year 2011, net income was $285.9 million or $4.17 per
share, up 16% year over year (y/y). However, the reported full year
earnings lagged the Zacks Consensus Estimate of $4.32.
Performance in Detail
BOK Financial reported total revenue of $309.5 million in the
quarter, down 11.4% from $349.4 million in the prior quarter.
Moreover, revenue was also below the Zacks Consensus Estimate of
$313.0 million.
For full year, total revenue was $1.26 billion, up 2.4% from
$1.23 billion in the prior year. Moreover, revenue also exceeded
the Zacks Consensus Estimate of $1.22 billion.
Net interest revenue totaled $171.5 million in the reported
quarter, down 2.2% sequentially. Net interest margin also fell 14
basis points (bps) from the prior quarter to 3.20%. However, the
effect of lower interest rates on net interest revenue was
partially offset by earning asset growth, which increased $789
million during the quarter under review.
Fees and commissions revenue totaled $131.8 million, reflecting
a sequential downside of 9.7%. The decline was fueled by lower
brokerage and trading revenue, mortgage banking revenue and
transaction card revenue. Moreover, transaction card revenue
dropped mainly due to interchange fee regulations, which became
effective October 1, 2011. BOK Financial expects these regulations
to reduce annual interchange revenue by $20 million to $25
million.
Total operating expenses were $219.2 million, down 0.8%
sequentially. Excluding changes in the fair value of mortgage
servicing rights, operating expenses totaled $213.9 million, up
$17.9 million from the prior quarter. Nevertheless, the company
experienced increases in personnel expenses, though non-personnel
expenses remained flat sequentially. The rise in personnel expenses
was primarily due to increased incentive compensation expenses.
Credit Quality
The credit quality of BOK Financial’s loan portfolio produced
improved results. Nonperforming assets totaled $357 million or
3.13% of outstanding loans and repossessed assets as of December
31, 2011, down from $388 million or 3.45%, respectively, as of
September 30, 2011.
Net loans charged off edged down 6.9% to $9.5 million from $10.2
million in the prior quarter. Moreover, negative provision for
credit losses of $15 million was recorded in the fourth quarter of
2011, following no provision for credit losses in the prior
quarter.
Further, the combined allowance for credit losses totaled $263
million or 2.33% of outstanding loans as of December 31, 2011,
declining from $287 million or 2.58% of outstanding loans as of
September 30, 2011.
Capital Position
At December 31, 2011, armed with strong capital ratios, the
company and its subsidiary bank exceeded the regulatory definition
of well capitalized. As of December 31, 2011, Tier 1 and total
capital ratios were 13.27% and 16.49%, respectively, compared with
13.14% and 16.54%, respectively as of September 30, 2011. Moreover,
its tangible common equity ratio marginally declined to 9.56% from
9.65% as of September 30, 2011.
Outstanding loan balances at BOK Financial were $11.3 billion as
of December 31, 2011, up from $11.1 billion as of September 30,
2011. Growth in commercial loan and residential mortgage loan
balances was partially offset by lower consumer loans. Moreover,
period-end deposits totaled $18.8 billion as of December 31, 2011,
up from $18.4 billion as of September 30, 2011.
Share Repurchase and Dividend Update
During the reported quarter, the company repurchased 69,581
common shares at an average price of $51.44 per share, through a
previously-announced share repurchase program.
During the fourth quarter of 2011, the Board of Directors of BOK
Financial increased its quarterly cash dividend to 33 cents per
share, indicating quarterly cash dividend increase twice in
2011.
On January 31, 2012, the Board of Directors approved a quarterly
cash dividend of 33 cents per share. The dividend will be paid on
February 29, 2012 to shareholders of record as of February 15,
2012.
Our Take
The strategic expansions and local-leadership based business
model of BOK Financial, which has peers such as
Cullen/Frost Bankers Inc. (CFR) and First
Financial Bankshares Inc. (FFIN), have aided its expansion
into a leading financial service provider from a small bank in
Oklahoma.
The company’s diverse revenue stream, sturdy capital position
and expense control initiatives augur well for investors. The
dividend hike will also bode well and boost investors’
confidence.
Nevertheless, with a protracted economic recovery, we expect
revenue growth to be restricted. Furthermore, we remain concerned
about the regulatory issues and the margin pressure resulting from
a highly liquid balance sheet.
The shares of BOK Financial currently retain a Zacks #3 Rank,
which translates into a short-term ‘Hold’ rating. Considering the
company’s business model and fundamentals, we have a long-term
“Neutral” recommendation on the stock.
BOK FINL CORP (BOKF): Free Stock Analysis Report
CULLEN FROST BK (CFR): Free Stock Analysis Report
FIRST FIN BK-TX (FFIN): Free Stock Analysis Report
To read this article on Zacks.com click here.
Zacks Investment Research
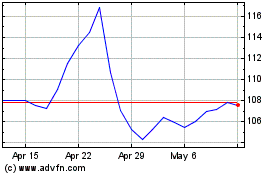
Cullen Frost Bankers (NYSE:CFR)
Historical Stock Chart
From Jun 2024 to Jul 2024

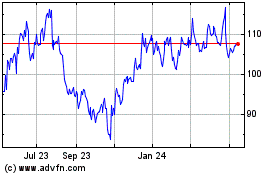
Cullen Frost Bankers (NYSE:CFR)
Historical Stock Chart
From Jul 2023 to Jul 2024
