SECURITIES AND EXCHANGE COMMISSION
Washington, D.C. 20549
FORM 6-K
Report of Foreign Private Issuer
Pursuant to Rule 13a-16 or 15d-16 of the
Securities Exchange Act of 1934
For the month of May, 2024
Commission File Number 1-34129
CENTRAIS ELÉTRICAS BRASILEIRAS S.A.
- ELETROBRÁS
(Exact name of registrant as specified in its
charter)
BRAZILIAN ELECTRIC POWER COMPANY
(Translation of Registrant's name into English)
Rua da Quitanda, 196 – 24th floor,
Centro, CEP 20091-005,
Rio de Janeiro, RJ, Brazil
(Address of principal executive office)
Indicate by check mark whether the registrant
files or will file annual reports under cover Form 20-F or Form 40-F.
Form 20-F ___X___ Form 40-F _______
Indicate by check mark whether the registrant
by furnishing the information contained in this Form is also thereby furnishing the information to the Commission pursuant to Rule
12g3-2(b) under the Securities Exchange Act of 1934.
Yes _______ No___X____


SUMMARY
| 1. Operating Result |
6 |
| 1.1. Generation Segment |
6 |
| 1.2. Trading Segment |
9 |
| 1.3. Transmission Segment |
11 |
| 2. Consolidated result | IFRS and regulatory |
12 |
| 2.1. Operating Revenues |
13 |
| 2.2. Other Income |
18 |
| 2.3. Operating Costs and Expenses |
19 |
| 2.4. Equity Holdings |
23 |
| 2.5. EBITDA |
24 |
| 2.6. Financial Result |
25 |
| 2.7. Current and Deferred Taxes |
26 |
| 3. Debt and receivables |
27 |
| 3.1. Holding / Parent Company and Consolidated |
27 |
| 4. Loans and Financing (Receivables) |
29 |
| 4.1. Holding / Parent Company and Consolidated |
29 |
| 4.2. RBSE |
29 |
| 5. Investments |
30 |
| 6. ESG |
32 |
| 7. Cash Flow |
33 |
| 8. Appendices |
34 |
| 8.1. Appendix 1 – Financial Statements |
34 |
| 8.2. Appendix 2 – Compulsory Loan |
41 |
| 8.3. Appendix 3 – Reconciliation IFRS X Regulatory |
42 |
MAIN OPERATING AND FINANCIAL INDICATORS
Table 1 - Operational Highlights
| Highlights |
1Q24 |
1Q23 |
% |
4Q23 |
% |
| Generation |
|
|
|
|
|
| Installed Generation Capacity (MW) |
44,304 |
43,009 |
3.0 |
44,654 |
-0.8 |
| Assured Capacity (aMW) (1) |
22,033 |
21,354 |
3.2 |
22,294 |
-1.2 |
| Net Generation (GWh) |
44,521 |
44,346 |
0.4 |
31,806 |
40 |
| Energy Sold ACR (GWh) (2) |
9.9 |
8.8 |
12.5 |
10.8 |
-8.3 |
| Energy Sold ACL (GWh) (3) |
13.6 |
12.4 |
9.7 |
14.3 |
-4.9 |
| Energy Sold Quotas (GWh) (4) |
8.6 |
11.4 |
-24.6 |
11.6 |
-25.9 |
| Average ACR Price (R$/MWh) |
216.16 |
219.81 |
-1.7 |
220 |
-1.7 |
| Average ACL Price (R$/MWh) |
153.76 |
199.96 |
-23.1 |
194 |
-20.7 |
| Transmission |
|
|
|
|
|
| Transmission lines (km) |
73,795 |
73,946 |
-0.2 |
73,789 |
0.0 |
| RAP (R$mn) |
17,702 |
13,778 |
28.5 |
17,663 |
0.2 |
Changes in the period: (1.1) Revision of the Assured Capacity
values of the plants that had their concessions renewed due to the capitalization (plants under the Quota regime, Tucuruí, Itumbiara,
Sobradinho, Mascarenhas de Moraes and Curuá-Una), as defined in Ordinance GM/MME 544/21, with a significant reduction in Assured
Capacity, effective from 2023; (1.2) Ordinary Revision of the Assured Capacity of hydroelectric plants, effective from 2023, affecting
several Eletrobras plants; (1.3) Increase in the assured Capacity of the Santa Cruz TPP due to the closure of the Combined Cycle; (1.4)
Exit of Candiota III TPP; (1.5) Inclusion of the SPEs that are now consolidated: HPPs Teles Pires, Baguari and Retiro Baixo; (2) does
not include quotas; (3) includes contracts under Law 13.182/2015; (4) figures shown are Assured Capacity of quotas in GWh.
Table 2 - Financial Highlights
| |
|
1Q24 |
1Q23 |
% |
4Q23 |
% |
| |
Financial Indicators (R$ mn) |
|
|
|
|
|
| Gross Revenue |
10,571 |
10,997 |
-4 |
11,858 |
-11 |
| Adjusted Gross Revenue |
10,571 |
11,053 |
-4 |
11,858 |
-11 |
| Net Operating Revenue |
8,718 |
9,210 |
-5 |
9,922 |
-12 |
| Adjusted Net Operating Revenue |
8,718 |
9,266 |
-6 |
9,922 |
-12 |
| Regulatory Net Operating Revenue |
9,700 |
8,900 |
9 |
10,275 |
-6 |
| EBITDA |
4,620 |
4,890 |
-6 |
1,055 |
338 |
| Adjusted EBITDA |
4,505 |
5,577 |
-19 |
3,840 |
17 |
| Regulatory EBITDA |
5,537 |
4,486 |
23 |
2,856 |
94 |
| Adjusted Regulatory EBITDA |
5,422 |
5,173 |
5 |
5,642 |
-4 |
| EBITDA Margin |
53% |
53% |
- 0.1 |
11% |
4.0 |
| Adjusted EBITDA Margin |
52% |
60% |
- 8.5 |
39% |
0.3 |
| Return on Equity (ROE) LTM |
3.8% |
1.2% |
2.7 |
3.9% |
- 0.0 |
| Adjusted Gross Debt |
60,947 |
58,038 |
5 |
61,438 |
-1 |
| Adjusted Net Debt |
42,966 |
36,717 |
17 |
41,763 |
3 |
| Adjusted Net Debt/Adjusted LTM IFRS EBITDA |
2.4 |
2.0 |
18 |
2.2 |
9 |
| Net Income |
331 |
406 |
-19 |
893 |
-63 |
| Investments |
1,202 |
1,121 |
7 |
4,632 |
-74 |
| |
|
|
|
|
|
|
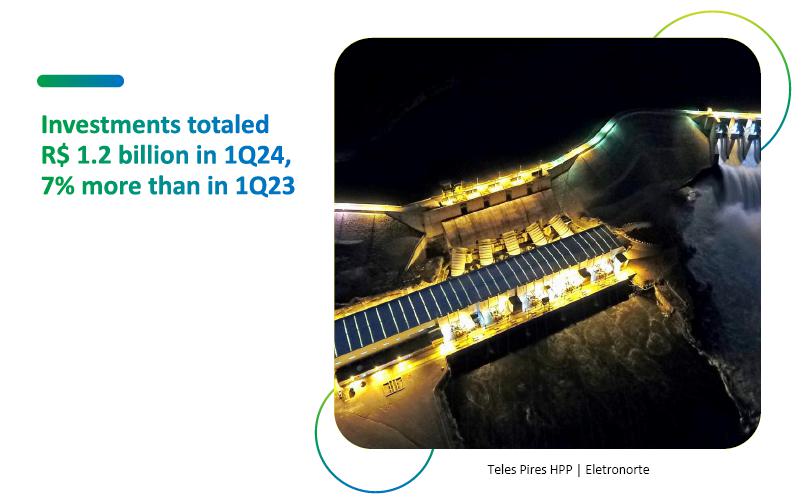
In 1Q24, the Company’s generation operations
consisted of 99 plants, of which 47 were hydroelectric, 43 wind, 8 thermal and 1 solar, encompassing corporate projects, shared ownership
and holdings via SPEs.
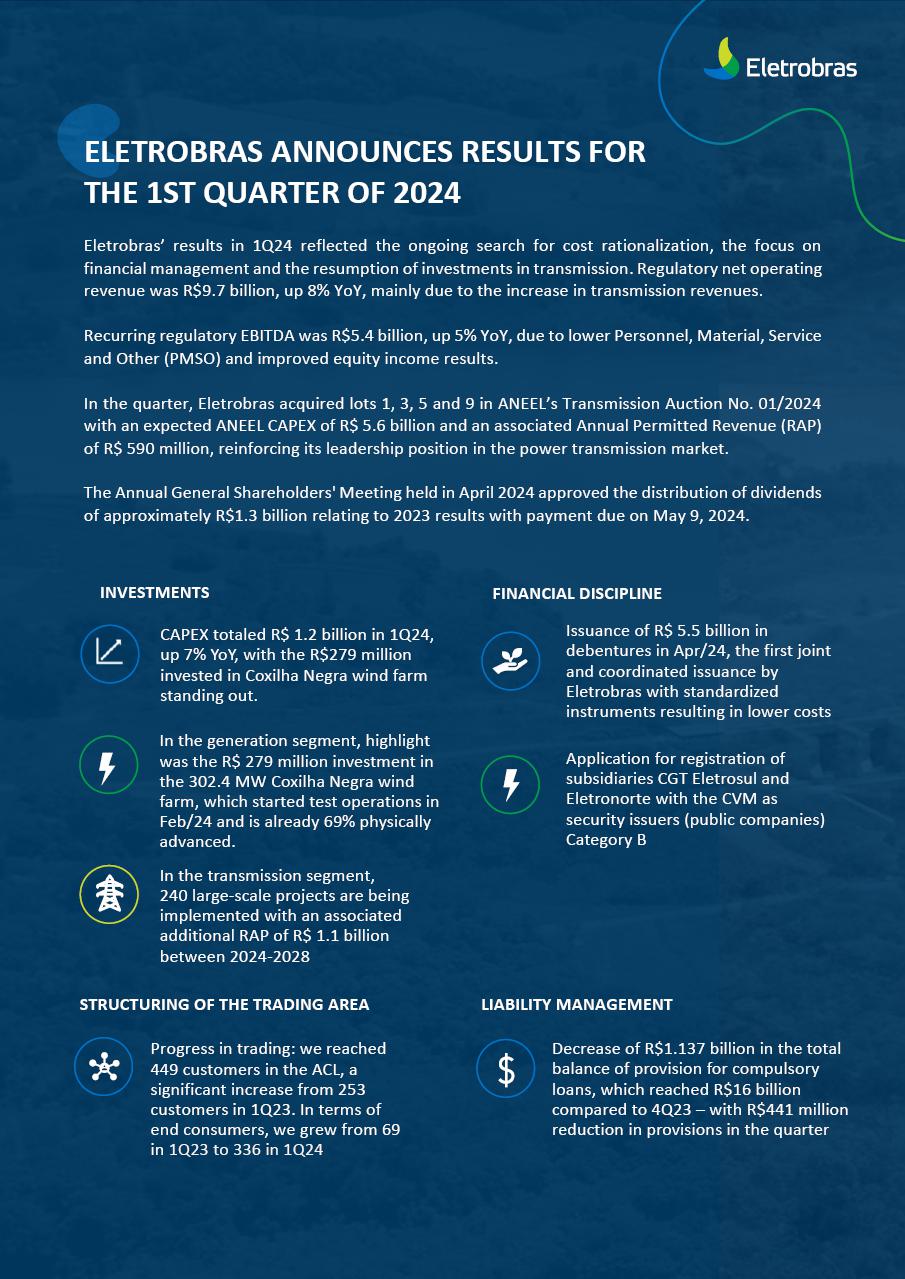
Total installed capacity reached 44,304 MW in the
quarter, which represents 22% of the total installed capacity in Brazil. Of the total installed capacity, approximately 97% is derived
from clean sources, with low greenhouse gas emissions.
Table 3 - Generation Assets
| Source |
Installed Capacity (MW) |
Assured Capacity
(aMW) |
Ac. Generated Energy (GWh) |
|
| |
| Hydro (47 plants) |
42,293.49 |
20,629.79 |
43,101.24 |
|
| Thermal (8 plants) |
1,295.22 |
1,079.50 |
1,092.47 |
|
| Wind power (43 plants) |
714.85 |
322.61 |
327.15 |
|
| Solar (1 plant) |
0.93 |
- |
0.31 |
|
| Total (99 plants) |
44,304.48 |
22,031.89 |
44,521.17 |
|
Brazil’s installed capacity was 200,583.77
MW in 1Q24.
Graph 1 - Installed capacity in Brazil -
by source
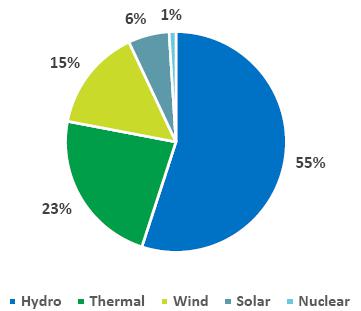
Graph 2 - Energy generated by SIN - National Interconnected
System (GWh)
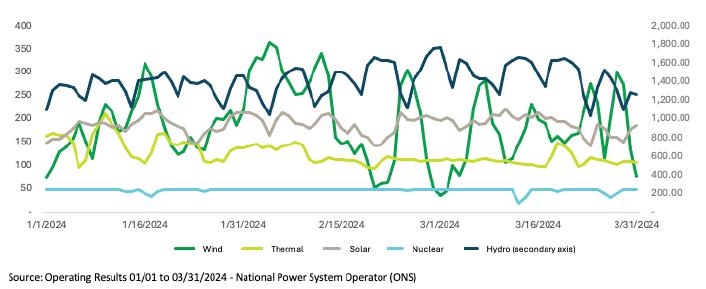
Energy generated was stable in 1Q24 YoY, except for
the wind source, which fell by 20% due to variations in the wind regime.
Graph 3 - Eletrobras Net Energy Generation (GWH)
Table 4 - PLD
| |
|
1Q24 |
1Q23 |
4Q23 |
| Market |
GSF (%) |
90.26 |
101.34 |
83.79 |
| PLD SE (R$/MWh) |
61.13 |
69.04 |
77.70 |
| PLD S (R$/MWh) |
61.13 |
69.04 |
77.70 |
| PLD NE (R$/MWh) |
61.13 |
69.04 |
77.70 |
| PLD N (R$/MWh) |
61.13 |
69.04 |
77.70 |
Graph 4 - GSF (%)
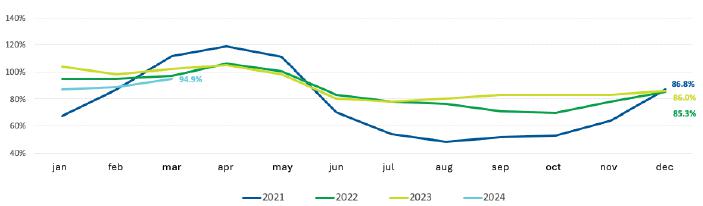
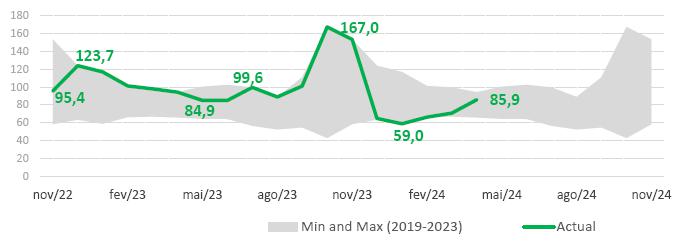
Graph 5 - Historical Average of Affluent Natural Energy (ANE) - SIN
(%)
ANE with a reversal of the recent history of records
from Dec/2023 and Jan/24 with the lowest percentage (59%) in the 93-year history.
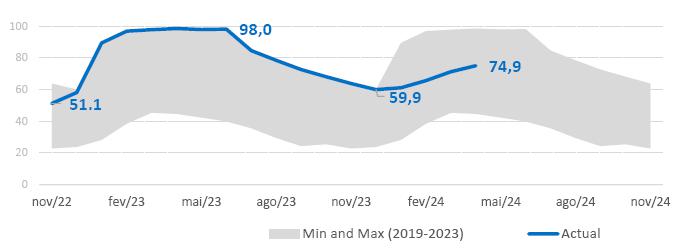
Graph 6 - Energy Stored in Reservoirs - SIN (%)
Two key projects currently under construction
will add 330.45 MW to Eletrobras' installed capacity in 2024: the 302.4 MW Coxilha Negra wind farm, located in Rio Grande do Sul state,
and the 27 MW Casa Nova B wind farm, in Bahia state.
The Coxilha Negra wind farm began its test operation
in February 2024 and is 69% of the way through its physical progress schedule.
The Casa Nova B wind farm is with approximately 60%
of the physical project completed. Transport of the wind turbine blades from the Port of Recife to the project site has been completed,
as well as the recovery of 18 trafos. In addition, mobilization and work has begun on the 34.5kV medium-voltage network and line entry
from the Casa Nova B wind farm to the Casa Nova II substation. The start of operations is scheduled for September 2024.
| 1.2.1. | Energy Sold in 1Q24 |
The Eletrobras companies sold 32.0 TWh of energy
in 1Q24, in line with the 32.4 TWh traded in 1Q23. These volumes include the energy sold by plants under the quota regime, renewed by
Law 12,783/2013, as well as by plants under the operating regime (Free Contracting Environment - ACL and Regulated Contracting Environment
- ACR).
Graph
7 - Energy Sold - ACL & ACR (TWh)
Graph 8 - Energy Sold - quotas (TWh)
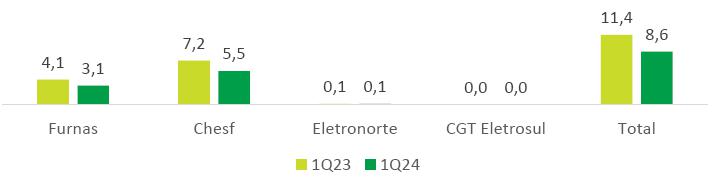
Table 5 - Energy Balance 1Q24 (aMW)
| |
|
2024 |
2025 |
2026 |
2027 |
| Resources with no impact on the balance Sheet (1) |
1,192 |
1,192 |
1,192 |
946 |
| |
|
|
|
|
|
|
|
|
| Resources (A) |
14,213 |
15,356 |
16,529 |
17,621 |
| Own resources (2) (3) (4) (5) |
12,861 |
14,155 |
15,416 |
16,590 |
| Hydro |
12,668 |
13,905 |
15,166 |
16,340 |
| Wind |
193 |
250 |
250 |
250 |
| Energy Purchase |
1,352 |
1,201 |
1,112 |
1,031 |
| Limit => |
|
Lower |
Higher |
Lower |
Higher |
Lower |
Higher |
| Sales (B) |
|
11,658 |
7,994 |
9,994 |
6,594 |
8,094 |
5,749 |
6.749 |
| ACR – Except quotas |
3,707 |
3,094 |
3,094 |
2,999 |
| ACL – Bilateral Contracts + Short Term Market implemented (range) |
7,951 |
4,900 |
6,900 |
3,500 |
5,000 |
2,750 |
3,750 |
| Average Prices Implemented Contracts |
|
|
|
|
| Limit => |
|
Lower |
Higher |
Lower |
Higher |
Lower |
Higher |
Average Price of Sales Contracts (ACR and ACL - R$/MWh) -
lagged by 1 quarter |
189 |
165 |
175 |
175 |
195 |
180 |
210 |
| Balance (A - B) |
|
2,555 |
7,362 |
5,362 |
9,935 |
8,435 |
11,872 |
10.872 |
| Balance considering estimated hedge (6) |
1,242 |
4,831 |
2,831 |
7,174 |
5,674 |
8,898 |
7,898 |
| Decontracted energy considering hedge estimate (8) |
8% |
29% |
17% |
40% |
32% |
48% |
43% |
Contracts signed until March 31,2024.
It should be noted that the balance sheet takes into account
the SPEs consolidated by Furnas: Santo Antônio HPP (as of 3Q22), Baguari and Retiro Baixo HPPs (as of 4Q23), whether in terms of
resources, sales or average prices. The SPE consolidated by Eletronorte, Teles Pires HPP (from 4Q23) is being considered in the same way.
1. Independent Energy Producers (IEP) contracts resulting
from the Amazonas Distribuidora de-verticalization process, the thermal plant availability contracts and the Assured Capacity Quotas are
not included in the balance sheet, whether in resources, requirements (sales) or average prices. These resources are presented in order
to make up the total resources considered.
2. Own Resources include the Decotization plants (new IEPs)
and the New Grants (Sobradinho, Itumbiara, Tucuruí, Curuá-Una and Mascarenhas de Moraes). For the hydroelectric projects,
an estimate of GFIS2 was considered, i.e. the Assured Capacity taking into account the Adjustment Factors due to Internal Losses, Losses
in the Basic Grid and Availability as well as adjustments due to the particularities of the portfolio.
3. The revised Assured Capacity values as defined in Ministerial
Order No. 709/GM/MME of November 30, 2022 are taken into account.
4. With the decotization process, the plants currently under
the quota regime are granted a new concession under the Independent Energy Producer (IEP) regime, which will take place gradually over
a 5-year period starting in 2023. The Assured Capacity values were defined in Ministerial Order GM/MME No. 544/21.
5. Considering the new concession grants from 2023 onwards for the
Sobradinho, Itumbiara, Tucuruí, Curuá-Una and Mascarenhas de Moraes plants, whose Assured Capacity values were defined in
Ministerial Order GM/MME No. 544/21.
Table 6 - Hydroelectric Power Plant Assured Capacity Quotas (aMW)
| |
2024 |
2025 |
2026 |
2027 |
| Assured Capacity Quotas (6) (7) |
3,939 |
2,626 |
1,313 |
- |
6. This does not include the Assured Capacity of the
Jaguari HPP, of 12.7 aMW, whose concession is under provisional administration by Furnas.
7. Decotization takes place gradually over a 5-year
period starting in 2023. The Assured Capacity values considered from 2023 onwards were those defined in Ministerial Order GM/MME No. 544/21.
8. The figures show an estimate of decontracted energy.
For 2023, the value used was 87.1%. For the other years, an average historical GSF value from 2018 to 2023 was used, of 81.8%. Source:
CCEE, obtained from the CCEE website, at the following link: https://www.ccee.org.br/dados-e-analises/dados-geracao (in Portuguese), under
the MRE option in the panel. It should be noted that this is only an estimate, based on facts that occurred in the past. The graph with
the historical GSF values is shown on the page 7 of this report.
The Company ended 1Q24 with 73.8 thousand km of transmission
lines (TLs) and 435 substations, which consist of 282 renewed and 153 tendered projects.
Table 7 - Transmission Lines (Km)
| Company |
Own |
In Partnership (1) |
Total |
| Chesf |
22,043 |
1,831 |
23,873 |
| Eletronorte |
10,921 |
1,073 |
11,994 |
| CGT Eletrosul |
11,966 |
5 |
11,970 |
| Furnas |
21,612 |
4,345 |
25,957 |
| Total |
66,542 |
7,253 |
73,795 |
(1) Partnerships consider extensions proportional
to the capital invested by Eletrobras Companies in the project.
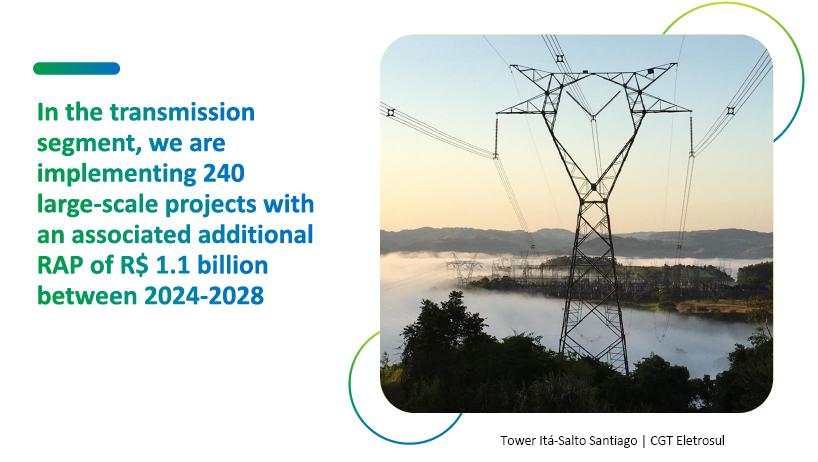
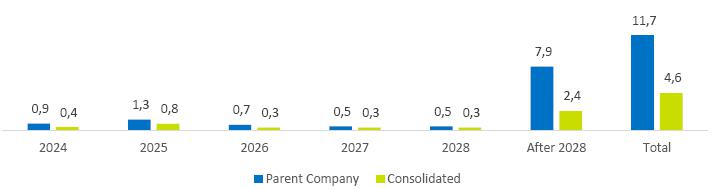
There are 240 large-scale transmission projects under
implementation (reinforcements, improvements and auction projects) with an associated additional RAP of R$1.1 billion between 2024-2028,
which will add around 89 km of TL and 3,841 MVA in substations. According to the ONS SGPMR system database, Eletrobras companies had a
total of 11,025 small-scale events under implementation, of which 10,195 were small-scale improvements and 830 small-scale reinforcements.
| 2. | Consolidated result | IFRS and regulatory |
Table 8 – Income Statement IFRS (R$ mn)
| Income Statement (IFRS) |
1Q24 |
1Q23 |
4Q23 |
| R$ million |
IFRS |
Adjustment |
Adjusted |
Adjusted |
% Y/Y |
Adjusted |
% Q/Q |
| Generation |
5,933 |
- |
5,933 |
6,616 |
-10 |
7,221 |
-18 |
| Transmission |
4,559 |
- |
4,559 |
4,336 |
5 |
4,558 |
0 |
| Others |
79 |
- |
79 |
101 |
-21 |
79 |
1 |
| Gross Revenue |
10,571 |
- |
10,571 |
11,053 |
-4 |
11,858 |
-11 |
| (-) Deductions from Revenue |
-1,853 |
- |
-1,853 |
-1,787 |
4 |
-1,936 |
-4 |
| Net Revenue |
8,718 |
- |
8,718 |
9,266 |
-6 |
9,922 |
-12 |
| Energy resale, grid, fuel and construction |
-2,856 |
- |
-2,856 |
-2,289 |
25 |
-3,948 |
-28 |
| Personnel, Material, Services and Others |
-1,627 |
33 |
-1,594 |
-1,770 |
-10 |
-1,815 |
-12 |
| Operating Provisions |
-196 |
-43 |
-338 |
-139 |
- |
-582 |
-42 |
| Other income and expenses |
5 |
-5 |
- |
- |
- |
- |
- |
| EBITDA, before Shareholdings |
4,044 |
-115 |
3,929 |
5,068 |
-22 |
3,577 |
10 |
| Shareholdings |
576 |
- |
576 |
509 |
13 |
264 |
118 |
| EBITDA |
4,620 |
-115 |
4,505 |
5,577 |
-19 |
3,840 |
17 |
| D&A |
-997 |
- |
-997 |
-903 |
10 |
-899 |
11 |
| EBIT |
3,623 |
-115 |
3,509 |
4,673 |
-25 |
2,941 |
19 |
| Financial Results |
-2,988 |
209 |
-2,779 |
-2,446 |
14 |
-2,123 |
41 |
| EBT |
636 |
94 |
730 |
2,227 |
-67 |
819 |
-36 |
Income Tax and
Social Contribution |
-305 |
- |
-305 |
-448 |
-32 |
358 |
-185 |
Net Income from
Continuing Operations |
331 |
94 |
424 |
1,779 |
-76 |
1,176 |
-82 |
Net Income from
Discontinued Operations |
- |
- |
- |
- |
- |
- |
- |
| Net Income |
331 |
94 |
424 |
1,779 |
-76 |
1,176 |
-82 |
Table 9 – Regulatory Income Statement (R$ mn)
|
Income Statement (Regulatory)
R$ million |
1Q24 |
1Q23 |
4Q23 |
| Regulatory |
Adjustment |
Adjusted |
Adjusted |
% Y/Y |
Adjusted |
% Q/Q |
| Generation(1) |
6,365 |
- |
6,365 |
6,616 |
-4 |
7,221 |
-12 |
| Transmission |
5,110 |
- |
5,110 |
3,906 |
31 |
4,911 |
4 |
| Others |
78 |
- |
78 |
221 |
-64 |
79 |
0 |
| Gross Revenue |
11,553 |
- |
11,553 |
10,743 |
8 |
12,211 |
-5 |
| (-) Deductions from Revenue |
-1,853 |
- |
-1,853 |
-1,787 |
4 |
-1,936 |
-4 |
| Net Revenue |
9,700 |
- |
9,700 |
8,956 |
8 |
10,275 |
-6 |
| Energy resale, grid, fuel and construction |
-2,390 |
- |
-2,390 |
-2,070 |
15 |
-2,763 |
-13 |
| Personnel, Material, Services and Others |
-1,728 |
33 |
-1,695 |
-1,910 |
-11 |
-1,817 |
-7 |
| Operating Provisions |
-497 |
-143 |
-639 |
-27 |
- |
-474 |
35 |
| Other income and expenses |
5 |
-5 |
- |
- |
- |
173 |
-100 |
| EBITDA, before Shareholdings |
5,091 |
-115 |
4,976 |
4,950 |
1 |
5,393 |
-8 |
| Shareholdings |
446 |
- |
446 |
223 |
100 |
249 |
79 |
| EBITDA |
5,537 |
-115 |
5,422 |
5,173 |
5 |
5,642 |
-4 |
| D&A |
-1,478 |
- |
-1,478 |
-1,355 |
9 |
-1,581 |
-6 |
| EBIT |
4,058 |
-115 |
3,944 |
3,818 |
3 |
4,061 |
-3 |
| Financial Results |
-2,917 |
209 |
-2,917 |
-2,304 |
18 |
-2,122 |
37 |
| EBT |
1,141 |
94 |
1,235 |
1,514 |
-18 |
1,939 |
-47 |
Income Tax and
Social Contribution |
-370 |
- |
-370 |
-402 |
-8 |
205 |
-281 |
Net Income from
Continuing Operations |
771 |
94 |
865 |
1,111 |
-22 |
2,144 |
-69 |
Net Income from
Discontinued Operations |
- |
- |
- |
- |
- |
- |
- |
| Net Income |
771 |
94 |
865 |
1,111 |
-22 |
2,144 |
-69 |
| (1) | In 1Q24, the difference between
the regulatory and IFRS generation revenue consists of the different treatment of Amazonas Energia's customer billing of R$432 million,
which does not cause a difference between IFRS and regulatory EBITDA. |
Recurring IFRS generation revenue was R$5.933
billion in 1Q24, down R$683 million on 1Q23, due to the non-recognition of revenue related to Amazonas Energia of R$432 million and a
decline of R$149 million due to the sale of Candiota TPP.
Recurring regulatory revenue was R$6.365 billion,
R$432 million higher than recurring IFRS generation revenue, since the revenue related to Amazonas Energia is recognized and then fully
provisioned.
Power supply for distribution
companies
Revenue from power supply for distribution
companies is obtained from customers who are not end consumers, such as distributors, traders and generators. In 1Q24, revenue from power
supply was R$3,683 million, down R$338 million YoY, mainly due to: (a) the sale of the Candiota plant with a reduction of 226 aMW and
R$149 million at CGT Eletrosul, in line with Eletrobras' decarbonization strategy to be Net Zero by 2030; (b) write-off of Amazonas
Energia S.A.'s revenues, amounting to
R$432 million, due to the fact that Eletronorte began not to recognize the effects of the invoiced electricity supply contract as the
customer defaulted; and (c) reduction in the ACL price, with effects partially offset by the revenue increase of R$256 million related
to the consolidation of Teles Pires, which took place in 4Q23.
Power supply for end consumers
Revenue from power supply for end consumers,
in turn, is obtained directly from the end consumer, for example industries and retail. In 1Q24, supply revenues amounted to R$761 million,
down R$313 million YoY. This reduction is mainly related to the lower volume of energy sold to industrial consumers covered by Law 13,182/15,
particularly energy from the Itumbiara HPP in Furnas, and was caused by unilateral cancellations by customers of part of the contracted
supply volumes. The reductions amounted to R$160 million, R$124 million and R$37 million at Furnas, Chesf and Eletronorte, respectively.
CCEE Revenue
Revenues from the CCEE (short term market)
were R$701 million, up R$266 million YoY, due to the increase in energy settled (more decontracted energy available, due to the gradual
decotization of the plants).
Operation and Maintenance Revenue
- Plants Renewed by Law 12,783/2013
Operation and maintenance revenues were R$787
million, down R$242 million YoY, mainly reflecting the gradual decotization process of quota-holding plants (20% each year), mitigated
by the effects of the annual adjustment of the Annual Generation Revenue - RAG, according to Homologatory Resolutions No. 3,068/2022 (2022-2023
cycle) and No. 3,225/2023 (2023-2024 cycle), impacting Eletronorte, Chesf and Furnas.
Table 10 - Gross Revenue 1Q24 (R$ mn)
| Gross Revenue |
1Q24 |
| Holding |
Furnas |
Chesf |
Eletronorte |
CGT Eletrosul |
Total |
Eliminations |
Consolidated IFRS |
| Power supply for distribution companies |
- |
1,872 |
116 |
1,505 |
191 |
3,684 |
-1 |
3,683 |
| Power supply for end consumers |
- |
310 |
77 |
365 |
9 |
761 |
- |
761 |
| CCEE revenue (short term market) |
- |
188 |
228 |
284 |
2 |
701 |
- |
701 |
| Operation and maintenance revenue |
- |
263 |
518 |
7 |
- |
787 |
- |
787 |
| Generation Revenues |
- |
2,633 |
938 |
2,161 |
202 |
5,934 |
-1 |
5,933 |
| Non-recurring items - Adjustments |
- |
- |
- |
- |
- |
- |
- |
- |
| Adjusted Generation Revenue |
- |
2,633 |
938 |
2,161 |
202 |
5,934 |
-1 |
5,933 |
Table 11 - Gross Revenue 1Q23 (R$ mn)
| Gross Revenue |
1Q23 |
| Holding |
Furnas |
Chesf |
Eletronorte |
CGT Eletrosul |
Total |
Eliminations |
Consolidated IFRS |
| Power supply for distribution companies |
- |
1,803 |
133 |
1,770 |
378 |
4,084 |
-63 |
4,021 |
| Power supply for end consumers |
- |
471 |
201 |
403 |
- |
1,074 |
- |
1,074 |
| CCEE revenue (short term market) |
- |
29 |
97 |
308 |
1 |
435 |
- |
435 |
| Operation and maintenance revenue |
- |
359 |
662 |
9 |
- |
1,030 |
- |
1,030 |
| Generation Revenues |
- |
2,662 |
1,093 |
2,490 |
379 |
6,624 |
-63 |
6,560 |
| Non-recurring items - Adjustments |
|
|
|
|
|
|
|
|
| (-) CCEE Reaccountings - Furnas |
- |
56 |
- |
- |
- |
56 |
- |
56 |
| Adjusted Generation Revenue |
- |
2,718 |
1,093 |
2,490 |
379 |
6,680 |
-63 |
6,616 |
Generation Revenue by Contracting Environment
Below, we present Eletrobras’ trading results by contracting
environment.
Table 12 - Generation Revenue by Contracting Environment (R$
mn)
| Generation Revenue |
Volume (aMW) (a) |
Price (R$/MWh) (b) |
Regulatory Revenue (c) = (a) x (b) |
| R$ million |
1Q24 |
% Y/Y |
%Q/Q |
1Q24 |
% Y/Y |
%Q/Q |
1Q24 |
% Y/Y |
%Q/Q |
| (+) Regulated market |
4,157 |
12.4 |
-5.8 |
302.2 |
-7.8 |
-3.6 |
2,744 |
4.7 |
-10.2 |
| (+) Free Market |
6,302 |
3.5 |
-3.7 |
155.0 |
-19.7 |
-20.2 |
2,133 |
-15.9 |
-24.0 |
| (+) O&M (Quotas) |
3,943 |
-25.1 |
-25.0 |
91.4 |
0.9 |
2.1 |
787 |
-23.6 |
-24.3 |
| (+) ST Market (CCEE) |
4,856 |
86.9 |
206.8 |
66.1 |
-14.8 |
-40.3 |
701 |
61.1 |
81.2 |
| (=) Ex Other |
19,259 |
9.1 |
8.2 |
151.3 |
-12.9 |
-18.4 |
6,366 |
-3.9 |
-12.7 |
| (+) Other (1) |
- |
- |
- |
- |
- |
- |
-1 |
-98.7 |
-98.8 |
| (=) Total |
- |
- |
- |
- |
- |
- |
6,365 |
-3.0 |
-11.9 |
| Recurring |
- |
- |
- |
- |
- |
- |
6,365 |
-3.8 |
-11.9 |
| Non-recurring |
- |
- |
- |
- |
- |
- |
0 |
-100.0 |
- |
| Generation Revenue |
Regulatory Revenue (c) |
Accounting Adjustment (d) ** |
Generation Revenue (R$ million) (e) = (c) + (d) |
| R$ million |
1TQ4 |
1Q23 |
4Q23 |
1TQ4 |
1Q23 |
4Q23 |
1Q24 |
1Q23 |
% Y/Y |
4Q23 |
%Q/Q |
| (+) Regulated market |
2,744 |
2,620 |
3,056 |
-432 |
0 |
0 |
2,313 |
2,620 |
-11.8 |
3,056 |
-24.3 |
| (+) Free Market |
2,133 |
2,538 |
2,807 |
0 |
0 |
0 |
2,133 |
2,538 |
-15.9 |
2,807 |
-24.0 |
| (+) O&M (Quotas) |
787 |
1,030 |
1,040 |
0 |
0 |
0 |
787 |
1,030 |
-23.6 |
1,040 |
-24.3 |
| (+) ST Market (CCEE) |
701 |
435 |
387 |
0 |
0 |
0 |
701 |
435 |
61.1 |
387 |
81.2 |
| (=) Ex Other |
6,366 |
6,624 |
7,290 |
-432 |
0 |
0 |
5,934 |
6,624 |
-10.4 |
7,290 |
-18.6 |
| (+) Other (1) |
-1 |
-63 |
-69 |
0 |
0 |
0 |
-1 |
-63 |
-98.7 |
-69 |
-98.8 |
| (=) Total |
6,365 |
6,560 |
7,221 |
-432 |
0 |
0 |
5,933 |
6,560 |
-9.6 |
7,221 |
-17.8 |
| Recurring |
6,365 |
6,616 |
7,221 |
-432 |
0 |
0 |
5,933 |
6,616 |
-10.3 |
7,221 |
-17.8 |
| Non-recurring |
0 |
-56 |
0 |
0 |
0 |
0 |
0 |
-56 |
-100.0 |
0 |
- |
*Construction Revenues, Financial Effect of Itaipu and Elimination (accounting
adjustments - internal sales).
** In 1Q24, Amazonas' revenue (R$432mn) is no longer recognized as revenue,
but as a reducer of provisions.
Transmission revenue was R$4,559 million in 1Q24,
up 8% YoY, with an increase of R$302 million in construction revenue and R$265 million in O&M, offset by a reduction of R$225 million
in contractual transmission revenue.
O&M Revenue
O&M revenue increased by R$265 million YoY,
mainly due to the publication of ANEEL;s Homologatory Resolution No. 3,216/2023, effective as of July/2023, which mainly includes the
tariff readjustment for the 23/24 cycle, as well as the partial recognition of the Periodic Tariff Review of some tendered contracts.
Eletronorte's O&M revenue from Contract 058/2001 increased by R$135 million. The increases at the other companies were as follows:
Furnas R$83 million, CGT Eletrosul R$32 million and Chesf R$13 million.
Construction Revenue
Construction
revenue for the periods is directly related to the investments made (appropriated and allocated) in transmission projects in progress.
Construction revenue totaled R$586 million, up by R$302 million YoY, mainly reflecting works at (a) Furnas, with an invested amount of
R$158 million in the renewed contract 062/2001; and (b) Eletronorte, in the amount of R$152 million in the 058/2001 contract.
Contractual Revenue
The contractual (financial) revenue is associated
with the application of inflationary indices to the balances of the contract assets of each concession. The accumulated IPCA from Jan-
Mar/2023 was 2.0%, and from Jan-Mar/2024 was 1.82 %. As for the IGP-M, the percentage changed from 0.60% to 0.29% in the same periods.
The impact on the Eletrobras companies was: (a)
Furnas: -R$ 100 million, particularly contract 062 (RBNI R$13 million and RBSE -R$ 133million); (b) Chesf: -R$ 72 million; (c) Eletronorte:
-R$ 42 million; and (d) CGT Eletrosul: -R$ 11 million. The negative variation observed in the RBSE values is due to the lower inflation
in the period compared and the reduction of its average base due to the amortization of the existing balance.
It should be noted that the IPCA in 4Q23 was
0.78% compared to 1.82% in 1Q24, which had a positive impact of R$211 million at Furnas, R$155 million at Chesf, R$95 million at Eletronorte
and R$52 million at CGT Eletrosul.
Such effect is due to the application of IFRS
rules and differs from regulatory revenue, which was adjusted in July 2023, according to Homologatory Resolution No. 3.216/23.
Table 13 – Transmission Operating Revenue (R$ mn)
| |
1Q24 |
1Q23 |
% |
4Q23 |
% |
| Transmission Revenues |
4,559 |
4,336 |
5 |
4,558 |
0 |
| Operation and maintenance revenue |
1,899 |
1,753 |
8 |
1,723 |
10 |
| Construction Revenue |
586 |
284 |
106 |
1,272 |
-54 |
| Contractual Revenue - Transmission |
2,074 |
2,299 |
-10 |
1,562 |
33 |
| Non-recurring items - Adjustments |
- |
- |
- |
- |
- |
Adjusted Transmission
Operating Revenue |
4,559 |
4,336 |
8 |
4,558 |
0 |
To check revenue by company, check the financial statements on the
IR website.
Regulatory Revenue
The YoY variation in the regulatory transmission
revenue was due to: (i) the RBSE re-profiling of approximately R$915 million, due to the entry of the new 23-24 cycle; (ii) the monetary
restatement by the IPCA (most contracts) or IGP-M, of around R$120 million; and (iii) the new investments, tariff revisions, adjustment
portions and others, of around R$191 million. It should be noted that ANEEL has extended the approval of the full RAP resulting from the
Period Tariff Review for concession contracts 057/2001, 058/2001, 061/2001 and 062/2001 to 2024.
It should also be noted that the main difference
between regulatory and IFRS revenues in 1Q24 is related to the increase in RBSE's RAP as a result of the re-profiling reported above.
Under IFRS, the increase in RAP due to the re-profiling did not result in revenue recognition, since the balance of the contractual asset
already provides for the increases in RAP, while under the regulatory method revenue is only recognized when the RAP is invoiced.
Table 14 – IFRS x Regulatory Revenue
(R$ mn)
| |
1Q24 |
1Q23 |
Regulatory Variation
(%) |
| IFRS |
Adjustments |
Regulatory |
IFRS |
Adjustments |
Regulatory |
| Furnas |
1,663 |
419 |
2,081 |
1,597 |
-315 |
1,282 |
62.4 |
| Chesf |
1,358 |
202 |
1,560 |
1,449 |
-160 |
1,289 |
21.0 |
| CGT Eletrosul |
560 |
-33 |
527 |
514 |
-77 |
437 |
20.7 |
| Eletronorte |
1,059 |
-37 |
1,022 |
923 |
-62 |
861 |
20.7 |
| Eliminations |
-80 |
-8 |
-88 |
-146 |
640 |
493 |
- |
| TOTAL |
4,559 |
543 |
5,102 |
4,336 |
25 |
4,361 |
17.0 |
Approved RAP
x Regulatory Revenue 1Q24
The graph below shows the reconciliation between
Approved RAP and regulatory revenue in 1Q24. Approved RAP corresponds to the RAP defined by Aneel for the availability of the facilities
under Eletrobras' responsibility for the 2023/2024 cycle, as well as the Approved Adjustment Portion (AP) established by Aneel through
Homologatory Resolution 3,216/2023, both proportioned for the quarter.
The discount on the variable portion is associated
with the unavailability of transmission facilities, as regulated by Module 4 of the transmission rules. The Anticipation Apportionment
is related to the difference arising from the collection deficit or surplus that occurs in the calculation carried out by the ONS, considered
in the Credit Notice issued by the ONS, being offset through the Adjustment Portion, and should be treated as a pass through.
The CDE/Proinfa amounts refer to the energy development
account and the incentive program for alternative sources of electricity, considered in the Credit Notices issued by the ONS. The CDE
Fund with PIS/Cofins taxes refers to the amounts not collected as a result of the discounts on tariffs, which are compensated through
the Adjustment Portion. It should be noted that these revenues should be treated as pass throughs, given that the transmission
companies have the role of collecting these sector charges.
Graph 9 - Conciliation of RAP and Transmission Revenue 1Q24 (R$ mn)
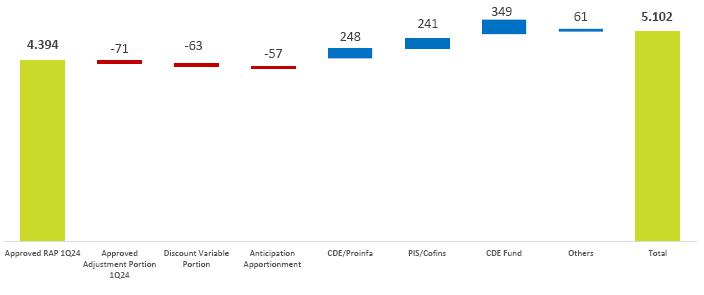
Table 15 – Other operating income (R$ mn)
| |
1Q24 |
1Q23 |
% |
4Q23 |
% |
| Other income |
79 |
101 |
-21 |
79 |
- |
| 2.3. | Operating Costs and Expenses |
Table 16 – Operating Costs and Expenses (R$ mn)
| |
1Q24 |
1Q23 |
% |
4Q23 |
% |
| Energy purchased for resale |
737 |
639 |
15 |
942 |
-22 |
| Charges on use of the electricity grid |
972 |
810 |
20 |
984 |
-1 |
| Fuel for electricity production |
506 |
442 |
14 |
602 |
-16 |
| Construction |
642 |
398 |
61 |
1,371 |
-53 |
| Personnel, Material, Services and Others |
1,627 |
1,812 |
-10 |
2,156 |
-25 |
| Depreciation and Amortization |
997 |
903 |
10 |
899 |
11 |
| Operating provisions |
196 |
716 |
-73 |
3,359 |
-94 |
| Costs and expenses |
5,676 |
5,720 |
-1 |
10,313 |
-45 |
| Non-recurring events |
|
|
|
|
|
| (-) Non-recurring PMSO events |
-331 |
-43 |
-23 |
-341 |
-90 |
| (-) Non-recurring provisions |
1432 |
-576 |
-125 |
-2,776 |
-105 |
(-) GSF cost allocated to Others in
PMSO - Furnas |
- |
- |
- |
49 |
- |
| Recurring Costs and Expenses |
5,786 |
5,101 |
13 |
7,245 |
-20 |
1 Effect of voluntary dismissal plans (PDVs) totaling R$33 million in the
period; 2 The amounts of non-recurring provisions include: (a) reversal of ECE of R$355 million; (b) provision for onerous contracts of
R$39 million; (c) reversal of estimated losses on investments of R$15 million; and (d) other provisions of R$474 million.
| 2.3.1. | Energy Purchased for Resale |
Energy purchased for resale totaled R$737 million
in 1Q24, up by R$ 98 million YoY, mainly due to: (a) an update by the IPCA in the contract prices by subsidiaries in the amount of around
R$26 million; (b) Eletronorte, up R$28 million, of which R$20 million refers to the consolidation of Teles Pires, with no counterpart
in 1Q23; and (c) Chesf, up R$17 million, as a result of additional 18 aMW in electricity purchased for resale compared to the previous
period.
| 2.3.2. | Charges on Use of Electricity Grid |
Charges on use of electricity grid totaled R$972
million in 1Q24, up R$162 million YoY. The variation in the Transmission System Usage Charge is justified by ANEEL Homologatory Resolutions
No. 3066/2022 (2022-2023 cycle) and No. 3217/2023 (2023-2024 cycle). The impacts were: Eletronorte, +R$115 million, of which R$96 million
refers to the consolidation of the Teles Pires plant, Chesf +R$33 million, Furnas +R$30 million and CGT Eletrosul -R$7 million reflecting
the sale of Candiota.
| 2.3.3. | Fuel for electricity production |
Costs associated with the use of fuel to produce
electricity totaled R$506 million in 1Q24, up R$64 million YoY, with the key drivers being : (a) Eletronorte with R$136 million net of
recovery of expenses, referring to the increase in cost and volume of natural gas of R$105 million due to dispatches Outside the Order
of Merit and Price (FOMP) requested by the National System Operator (ONS), an increase of R$23 million in ICMS tax reversal on sales
of Mauá 3 TPP due to ICMS exemption outside the state of Amazonas, and a reduction of R$63 million due to a 36.45% decrease in
the collection of ancillary natural gas expenses (ship or pay of transportation and margin) with a consequent reduction of R$70
million in the recovery of CCC expenses; (b) CGT Eletrosul saw a reduction of R$33 million reflecting the sale of the Candiota TPP and
(c) Furnas saw a reduction of R$40 million due to the lower dispatch of the Santa Cruz TPP in 1Q24.
Costs related to construction totaled R$642 million
in 1Q24, up R$244 million YoY, with the following standing out: (a) Furnas, up R$157 million due to contract 062-2001-RBNIs; (b) Eletronorte,
up R$152 million, primarily due to the renewed contract 058/2001; (c) CGT Eletrosul, R$25 million more investments in transmission, specifically
in reinforcements and improvements to meet ANEEL's regulatory demands. This was partially offset by (d) Chesf, with a R$ 90 million reduction.
| 2.3.5. | PMSO – Personnel, Material, Services and Other |
Personnel
Recurring personnel costs totaled R$945 million
in 1Q24, down 7% on the R$1,020 million of 1Q23, mainly reflecting the savings generated by the Voluntary Dismissal Plans (VDPs) totaling
R$284 million partially offset by the effects of the 2023-24 Collective Bargaining Agreement of 4.18% (R$35 million), new hires (R$44
million), R$82 million pro rata profit sharing, which in 2023 was not recognized in 1Q23, and miscellaneous increases (R$37 million).
It should be noted that the Personnel figure includes R$16 million related to compensatory bonuses for salary readjustment to align the
Company's practices with market standards.
Non-recurring effects: Voluntary Dismissal Plans
(VDPs) totaling R$ 33 million in the period.
Material
Material costs totaled R$46 million, up by R$1
million YoY, with no significant variations and no non-recurring effects in the quarter.
Services
Recurring service costs totaled R$439 million,
down R$28 million YoY, mainly reflecting: (a) R$58 million cost reduction at Furnas due to the reclassification of some benefits to the
Personnel account and a reduction in consultancy services; (b) R$12 million decrease at CGT reflecting the sale of Candiota; (c) R$8 million
decrease at Chesf; (d) R$11 million reduction at Eletronorte. This decline was partially offset by a R$32 million increase at the holding
company, with the emphasis on expenses of R$20 million for legal services, as well as R$13 million for auditing, consulting and IT
services. The services account had no non-recurring effects in the quarter.
Other
Other recurring costs and expenses totaled R$165
million in 1Q24, down R$158 million YoY, mainly reflecting: (a) a 94% reduction in retiree benefits, especially at Chesf, which were
reclassified as of 3Q23; (b) a 70% reduction in indemnities, losses and fines due to events that occurred in 1Q23 and did not occur in
1Q24, such as a R$13 million loss on the write-off of receivables at the Holding Company, R$24 million in losses on the deactivation
of non-reversible assets at Furnas and miscellaneous convictions of R$10 million; (c) in insurance there was a 24% reduction related
to the optimization of the corporate insurance structure with unified contracts for transportation insurance, D&O, operational risk,
among others, for the total amount of R$9 million.
Table 17 – PMSO 1Q24 (R$ mn)
PMSO
(R$ million) |
1Q24 |
| Eletrobras |
Furnas |
Chesf |
Eletronorte |
CGT Eletrosul |
Eletropar |
Total |
Eliminations |
Consolidated
IFRS |
| Personnel |
138 |
275 |
214 |
214 |
104 |
0,5 |
945 |
- |
945 |
| Voluntary Dismissal Plan (VDP) – Provision |
- |
- |
25 |
8 |
- |
- |
33 |
- |
33 |
| Material |
4 |
12 |
13 |
13 |
4 |
- |
46 |
- |
46 |
| Services |
115 |
115 |
75 |
96 |
37 |
0,7 |
439 |
- |
439 |
| Other |
27 |
39 |
41 |
48 |
9 |
0,2 |
165 |
- |
165 |
| PMSO |
283 |
440 |
368 |
379 |
154 |
1 |
1,627 |
- |
1,627 |
| Non-recurring |
|
|
|
|
|
|
|
|
|
|
Personnel: Incentive Plans
(PAE, PDC) |
- |
- |
-25 |
-8 |
- |
- |
-33 |
- |
-33 |
| Recurring PMSO |
283 |
440 |
343 |
372 |
154 |
1 |
1,594 |
- |
1,594 |
Table 18 – PMSO 1Q23 (R$ mn)
PMSO
(R$ million) |
1Q23 |
| Eletrobras |
Furnas |
Chesf |
Eletronorte |
CGT Eletrosul |
Eletropar |
Total |
Eliminations |
Consolidated
IFRS |
| Personnel |
95 |
274 |
193 |
288 |
130 |
0,4 |
981 |
- |
981 |
| Voluntary Dismissal Plan (VDP) – Provision |
4 |
- |
3 |
-17 |
- |
- |
-10 |
- |
-10 |
| Material |
- |
17 |
9 |
14 |
5 |
- |
45 |
- |
45 |
| Services |
83 |
172 |
84 |
107 |
49 |
0,7 |
495 |
- |
495 |
| Other |
58 |
96 |
43 |
93 |
17 |
- |
307 |
5 |
302 |
| PMSO |
240 |
559 |
332 |
484 |
202 |
1 |
1,812 |
5 |
1,812 |
| Non-recurring |
|
|
|
|
|
|
|
|
|
| Personnel: Incentive Plans (PAE, VDP); and Labor Claims (Furnas) |
-4 |
39 |
-3 |
17 |
- |
- |
49 |
- |
49 |
| Services: Consultancy costs associated with transformation |
-28 |
- |
- |
- |
- |
- |
-28 |
- |
-28 |
| Other: Indemnities, losses and damages (Furnas); and Legal costs (except labor costs) / CDE Inspection (Eletronorte) |
- |
-24 |
- |
-39 |
- |
- |
-63 |
- |
-63 |
| Recurring PMSO |
208 |
574 |
329 |
462 |
202 |
1 |
1,775 |
5 |
1,770 |
Table 19 – PMSO IFRS (R$ mn)
| |
1Q24 |
1Q23 |
4Q23 |
Total
(a) |
Non-recurring (b) |
Recurring
(c) = (a) - (b) |
Recurring |
% Chg. |
Recurring |
% Chg. |
| Personnel |
978 |
33 |
945 |
1,020 |
-7 |
1,005 |
-6 |
| Material |
46 |
- |
46 |
45 |
3 |
99 |
-54 |
| Services |
439 |
- |
439 |
467 |
-6 |
576 |
-24 |
| Others |
165 |
- |
165 |
239 |
-31 |
135 |
22 |
| Total |
1,627 |
33 |
1,594 |
1,770 |
-10 |
1,815 |
-12 |
For comparative purposes, the PMSO value
at 1Q23 was adjusted at "Personnel" reflecting the accounting standardization with reclassification of accounts at Furnas in
the amount of R$39 million.
Table 20 – Other Costs and Expenses (R$ mn)
| |
1Q24 |
1Q23 |
% |
4Q23 |
% |
| Indemnization, losses and fines |
30 |
99 |
-70 |
123 |
-76 |
| Insurance |
25 |
33 |
-24 |
31 |
-19 |
| Donations and contributions |
53 |
47 |
13 |
34 |
56 |
| Invested |
16 |
3 |
433 |
31 |
-48 |
| Rent |
8 |
94 |
-91 |
22 |
-64 |
| Taxes |
-28 |
5 |
-660 |
20 |
-240 |
| Recovery of expenses |
-40 |
-15 |
167 |
-121 |
-67 |
| Others |
101 |
120 |
-16 |
44 |
130 |
| Total |
165 |
386 |
-57 |
184 |
-10 |
Operating Provisions
Table 21 – Operating Provisions (R$ mn)
| |
1Q24 |
1Q23 |
% |
4Q23 |
% |
| Provision/Reversal for Litigation |
139 |
-550 |
-125 |
-380 |
-137 |
| Estimated losses on investments |
-15 |
- |
- |
254 |
-106 |
Provision for Implementation of Actions -
Compulsory Loan |
-9 |
-22 |
-57 |
22 |
-142 |
| ADA – Loans and Financing |
-4 |
-4 |
- |
-9 |
-51 |
| ADA - Consumers and resellers |
-132 |
-57 |
130 |
-383 |
-66 |
| Onerous contracts |
39 |
- |
- |
-862 |
-104 |
| Results of actuarial reports |
-128 |
-140 |
- |
- |
- |
| Other |
-84 |
58 |
-246 |
-2,002 |
-96 |
| Operating Provisions / Reversals |
-196 |
-716 |
-66 |
-3,359 |
-94 |
| Non-recurring items / Adjustments |
-143 |
576 |
-130 |
2,776 |
-106 |
| Provision/Reversal for Litigation |
-139 |
550 |
-125 |
380 |
-137 |
| Estimated losses on investments |
15 |
- |
- |
(254) |
-106 |
| Provision for Implementation of Actions - Compulsory Loan |
9 |
22 |
-59 |
(22) |
-141 |
| ADA – Loans and Financing |
4 |
4 |
- |
9 |
-56 |
| Onerous contracts |
-39 |
- |
- |
862 |
-105 |
| Provision for demobilization |
- |
- |
- |
35 |
- |
| RGR refund |
- |
- |
- |
69 |
- |
| Fair value measurement of assets available for sale |
- |
- |
- |
742 |
- |
| Impairment |
6 |
- |
- |
956 |
-99 |
| Adjusted Provisions/Reversals |
-367 |
-139 |
- |
-582 |
-42 |
Positive values in the table above mean a reversal of the provision.
| § | Provision for Litigation:
went from a provision of R$550 million in 1Q23 to a reversal of R$139 million in 1Q24, with the main factors being: (a) reversal at the
Parent Company of R$338 million in compulsory loan contingencies, due to an economically favorable result in the agreements, in the amount
of R$357 million; (b) reversal at Chesf of two civil lawsuits for R$131 million in dispute over land expropriated for the formation of
the Sobradinho HPP lake; and (c) a variation of R$141 million at Furnas, with emphasis on labor constitutions of R$23 million, civil constitutions
of R$35 million, regulatory constitutions of R$15 million and land constitutions of R$10 million. |
| § | Onerous contracts: R$39
million due to the reversal of onerousness in the Jirau Energia contract by
R$ 13 million and the revision of the calculations of onerous
contracts at CGT Eletrosul by R$ 24 million. |
| § | Estimated allowance for
doubtful accounts (ADA) - consumers and resellers: rose from a provision of R$57 million in 1Q23 to R$132 million in 1Q24, particularly
Chesf's provision of R$66 million on consumers and concessionaires in transmission and Eletronorte's provision of R$78 million related
to the warranties from Amazonas Energia to Breitner Energética. This amount includes guarantees for the months of Sep-Dec/23 and
Jan-Mar/24 of around R$11 million per month. |
| § | Result of actuarial reports:
provision of R$128 million relating to the cost of interest and the cost of current services defined in the reports for the 2024 financial
year, which are now recorded on an accrual basis when compared to the entries made previously at the end of the year. |
Table 22 – Equity Holdings (R$ mn)
| |
1Q24 |
1Q23 |
% |
4Q23 |
% |
|
| |
| Highlights Affiliates |
|
|
|
|
|
|
| Eletronuclear |
103 |
-31 |
-437 |
-386 |
-127 |
|
| CEB Lajeado |
- |
- |
- |
12 |
-100 |
|
| Cemar |
52 |
54 |
-4 |
81 |
-36 |
|
| CTEEP |
230 |
268 |
-14 |
358 |
-36 |
|
| Emae |
8 |
- |
- |
21 |
-63 |
|
| Lajeado |
- |
28 |
-100 |
35 |
-100 |
|
| Highlights SPEs |
|
|
|
|
|
|
| IE Madeira |
65 |
60 |
9 |
42 |
56 |
|
| BMTE |
55 |
44 |
24 |
51 |
8 |
|
| Chapecoense |
50 |
44 |
14 |
39 |
28 |
|
| ESBR Jirau |
36 |
12 |
206 |
13 |
178 |
|
| IE Garanhuns |
20 |
17 |
18 |
13 |
47 |
|
| Norte Energia |
-174 |
-61 |
185 |
-133 |
31 |
|
| Other Equivalents |
132 |
74 |
78 |
118 |
12 |
|
| TOTAL Equity Holdings |
576 |
509 |
13 |
264 |
118 |
|
The result was positively influenced by CTEEP results
of R$ 230 million and Eletronuclear results of R$ 103 million, offset by affiliated company Norte Energia, reflecting higher operating
costs and expenses, lower financial results and lower revenues.
| 2.5.1. | Adjusted IFRS EBITDA |
Adjusted IFRS EBITDA reached R$4,505 million, down 19% YoY. The drop
in generation revenues, added to the increase in operating costs, was partially offset by the positive effects of the increase in transmission
revenues and PMSO reduction.
Table 23 – Consolidated EBITDA (R$ mn)
| |
1Q24 |
1Q23 |
% |
4Q23 |
% |
|
| |
| Result for the Period |
331 |
406 |
-18 |
893 |
-63 |
|
| + Provision for Income Tax and Social Contribution |
305 |
448 |
-32 |
-3,265 |
-109 |
|
| + Financial Result |
2,988 |
3,133 |
-5 |
2,527 |
18 |
|
| + Amortization and Depreciation |
997 |
903 |
10 |
899 |
11 |
|
| EBITDA |
4,620 |
4,890 |
-6 |
1,055 |
338 |
|
| Revenue Adjustments |
- |
56 |
- |
- |
- |
|
| Cost and Expense Adjustments |
33 |
43 |
-23 |
292 |
-89 |
|
| Provision Adjustments |
-143 |
576 |
-125 |
2,776 |
-105 |
|
| Other Income and Expenses Adjustments |
-5 |
11 |
-145 |
-283 |
-98 |
|
| Adjusted EBITDA |
4,505 |
5,577 |
-19 |
3,840 |
17 |
|
| 2.5.2. | Adjusted Regulatory EBITDA |
In addition, for a more thorough analysis of
the Company's cash dynamics, it is recommended to evaluate the performance of the Adjusted Regulatory EBITDA.
In this case, the 3% increase in net revenue
was leveraged by a reduction in costs and expenses and an improvement in the result from equity holdings, which led to a 5% increase in
EBITDA when comparing 1Q23 with 1Q24.
Table 24 – Regulatory EBITDA (R$ mn)
| |
1Q24 |
1Q23 |
% |
4Q23 |
% |
| Net Revenue (1) |
9,268 |
8,956 |
3 |
10,275 |
-10 |
| - Energy resale, grid, fuel and construction |
-2,390 |
-2,070 |
15 |
-2,763 |
-13 |
| - Personnel, Material, Services and Others |
-1,695 |
-1,910 |
-11 |
-1,817 |
-7 |
| - Operating Provisions (1) |
-208 |
-27 |
679 |
-474 |
-56 |
| - Other income and expenses |
- |
- |
- |
173 |
- |
| + Equity Holdings |
446 |
223 |
100 |
249 |
79 |
| Adjusted Regulatory EBITDA |
5,422 |
5,173 |
5 |
5,642 |
-4 |
(1)
Excluding the effect of Amazonas Energia in the amount of R$432 million on revenue and operating provisions.
Table 25 – Financial Results (R$ mn)
| |
1Q24 |
1Q23 |
% |
4Q23 |
% |
| Financial Income |
675 |
1,071 |
-37 |
844 |
-20 |
| Income from interest, fines, commissions and fees |
32 |
145 |
-78 |
-15 |
-312 |
| Income from financial investments |
574 |
786 |
-27 |
755 |
-24 |
| Late payment surcharge on electricity |
47 |
57 |
-18 |
51 |
-9 |
| Other financial income |
74 |
150 |
-51 |
111 |
-34 |
| (-) Taxes on financial income |
-51 |
-67 |
-23 |
-58 |
-12 |
| Financial Expenses |
-2,470 |
-3,010 |
-18 |
-2,449 |
1 |
| Debt charges |
-1,619 |
-1,852 |
-13 |
-1,269 |
28 |
| CDE obligation charges |
-610 |
-553 |
10 |
-593 |
3 |
| River basin revitalization charges |
-85 |
-88 |
-4 |
-91 |
-6 |
| Financial discount for anticipation - ENBpar |
- |
-335 |
- |
- |
- |
| Other financial expenses |
-15 |
-181 |
-14 |
-496 |
-69 |
| Net Financial Items |
-1,192 |
-1,195 |
0 |
-922 |
29 |
| Monetary changes |
-347 |
-394 |
-12 |
-313 |
11 |
| Exchange rate variations |
-2 |
163 |
-101 |
-25 |
-90 |
| Change in fair value of hedged debt net of derivative |
-191 |
- |
- |
-278 |
-31 |
| Monetary updates - CDE |
-493 |
-604 |
-18 |
-217 |
127 |
| Monetary updates - river basins |
-87 |
-127 |
-32 |
-89 |
-2 |
| Change in derivative financial instrument not linked to debt protection |
-72 |
-233 |
-69 |
- |
- |
| Financial Results |
-2,988 |
-3,133 |
-5 |
-2,527 |
18 |
| Adjustments |
- |
687 |
- |
404 |
- |
| (-) Income from Distribution Companies + AIC |
- |
-35 |
- |
20 |
- |
| (-) Monetary restatement of compulsory loans |
209 |
378 |
- |
238 |
- |
| (-) Interest and exchange variation on ITAIPU sale to ENBPar |
- |
335 |
- |
- |
- |
| (-) Reversal of penalties for unavailability - CGT Eletrosul |
- |
8 |
- |
- |
- |
| (-) PIS/Cofins (IOE) |
- |
- |
- |
146 |
- |
| Adjusted Financial Result |
-2,779 |
-2,446 |
22 |
-2,123 |
41 |
In 1Q24, the adjusted financial result was negative
R$2,988 million, compared to negative R$2,466 million in 1Q23. The main YoY variations were:
| § | Lower debt charges, which
went down from R$1,852 million in 1Q23 to R$ 1,619 million in 1Q24 due to the IPCA variation of 2.1% 1Q24 x 1.4% 1Q23 coupled with CDI
reduction. |
| § | Monetary restatement (Selic)
on the contingency provision for compulsory loans declined from R$377 million in 1Q23 to R$ 207 million in 1Q24, due to the reduction
in the provision inventory and the variation of the Selic rate. |
| § | CDE obligation charges
and CDE monetary updates (IPCA financial expenses + charges on the outstanding balance of CDE obligations, the charge being 7.6%
per year) amounted to R$ 1.1 billion in 1Q24. These obligations were established by Law 14,182/21 (Privatization of Eletrobras), as
one of the conditions for obtaining the new concession
grants for power generation for another 30 years. The charges were calculated based on the data published in CNPE Resolution 015/2021:
(a) the present value of the obligation; (b) the future flow of payments; and (c) the payment term. |
| § | Hydrographic basin revitalization
charges (5.67% charge), of R$85 million in 1Q24, and Monetary updates - river basins of R$87 million. These obligations were
established by Law 14,182/21 (Privatization of Eletrobras), as one of the conditions for obtaining the new concession grants for power
generation, for another 30 years. The charges were calculated based on the data published in CNPE Resolution 015/2021: (a) the present
value of the obligation; (b) the future flow of payments; and (c) the payment term. |
| § | Variations in derivatives:
positive variation in derivatives in the amount of R$ 161 million mainly due to gains of R$ 72 million with derivatives at Eletronorte
in 1Q24, influenced by the variation in the quantity of energy, macroeconomic indices (dollar and Selic) and the aluminum price projection
on the London Metal Exchange - LME, which is used as a benchmark for payment of the premium provided for in the contract with Albras.
|
| § | Other financial expenses:
effect of R$ 27 million, mainly due to the increase in the items at Furnas for interest on arrears without the payment of COFINS in the
amount of approximately R$ 18 million and bank guarantees in the amount of approximately R$ 5 million. |
| § | Variation in the fair value
of protected debt (hedge) net of derivative: In 2Q23, Eletrobras entered into a derivative transaction called Cross Currency Swap,
aiming at hedging the issued bonds against exchange rate fluctuations, assuming a liability position in Reais and the change in value
of the liability linked to the variable interest curve in Reais (CDI). In 1Q24, there was a negative effect of R$191 million as a result
of the variation in the nominal value of the asset during the period, as well as a depreciation of the notional dollar against the real,
which did not occur in 1Q23. |
Table 26 – CDE Charges and Projects - Law 14,182/2021
(R$ mn)
| |
1Q24 |
| Furnas |
Chesf |
Eletronorte |
Total |
| Debt charges - CDE obligations |
-175 |
-255 |
-179 |
-610 |
| Debt charges - Revitalization of river basins |
-22 |
-34 |
-29 |
-85 |
| Passive monetary restatement - CDE obligations |
-142 |
-206 |
-145 |
-493 |
| Passive monetary restatement - Revitalization of river basins |
-23 |
-35 |
-29 |
-87 |
| Total CDE charges and Projects - Law 14,182/2021 |
-362 |
-530 |
-383 |
-1,275 |
| 2.7. | Current and Deferred Taxes |
Table 27 – Income Tax and Social Contribution (R$ mn)
| |
1Q24 |
1Q23 |
% |
4Q23 |
% |
| Current income tax and social contribution |
-22 |
-398 |
-95% |
-45 |
-52% |
| Deferred income tax and social contribution |
-283 |
-50 |
471% |
3.31 |
-109% |
| Income tax and social contribution Total |
-305 |
-448 |
-32% |
3.265 |
-109% |
| Adjustments |
- |
- |
- |
-2.907 |
- |
| IOC / Tax Savings - Furnas and Eletronorte ¹ |
- |
- |
- |
-453 |
- |
| Constitution of negative tax base - SAESA |
- |
- |
- |
-2.454 |
- |
| Adjusted income tax and social contribution |
-305 |
-448 |
-32% |
358 |
-185% |
¹ The PIS/Cofins related to the IOC issued by Furnas and
Eletronorte is included in the Financial Result.
Gross debt reached R$60.8 billion in 1Q24, in
line with 4Q23 and an increase of R$2.7 billion vs 1Q23. In 1Q24 we raised R$493 million in bank debt.
In 1Q24, considering the new funding/amortizations
and the 100 bps reduction in the basic interest rate (SELIC), the average term of the debt was reduced by 1.5 months and cost decreased
58 bps, resulting in an average cost of CDI + 0.9288% p.a. at the end of the period.
The net debt/adjusted regulatory EBITDA ratio
reached 2.0x in 1Q24. For covenant purposes the net debt/ EBITDA ratio is 2.06x in 1Q24 and 1.95x in 1Q23.
In April, we carried out Eletrobras’ first
joint and coordinated issuance with standardized instruments, which resulted in lower costs. We issued R$5.5 billion in debentures: R$3
billion in Eletrobras, R$1 billion in Chesf, R$1 billion in Eletronorte and R$500 million in CGT Eletrosul with rates of CDI +0.85% for
5 years, CDI + 1% for 7 years and IPCA +6.3423% for 7 years for CGT and Eletronorte. Of the total R$5.5 billion raised in Apr/24, around
R$3.4 billion was used to repay debts in 2024.
| 3.1. | Holding / Parent Company and
Consolidated |
Graph 10 - Loans and Financing Payable (R$ billion)
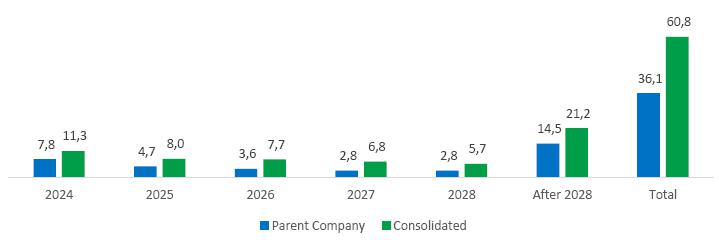
Table 28 – Net Debt (R$ mn)
| |
03/31/2024 |
12/31/2023 |
| (+) Gross Debt |
60,751 |
60,780 |
| (+) Derivatives (currency hedge) Net |
196 |
658 |
| (-) (Cash and Cash Equivalents + Current Securities) |
17,327 |
18,967 |
| (-) Financing receivable |
654 |
628 |
| (-) Net balance of Itaipu Financial Assets |
- |
80 |
| Net Debt |
42,966 |
41,763 |
Table 29 – Net Debt Breakdown
| Creditor |
Index |
Average cost (per year) |
Total Balance
(R$ thousand) |
Share of Total (%) |
| Debentures and other securities |
CDI |
CDI + 1.00% to 2.17%,
117.6% CDI |
12,952,641 |
21.32 |
| Debentures and other securities |
IPCA |
IPCA + 3.75% to 7.49% |
14,630,230 |
24.08 |
| BNDES |
IPCA, TJLP,
Fixed rate |
IPCA + 5.38% to 6.41%; TJLP to TJLP + 3% |
8,201,269 |
13.50 |
| Banco do Brasil |
CDI, IPCA,
TJLP, CDI |
TJLP + 2%, CDI + 1.65% to 2.25%, IPCA + 6.56% |
4,468,641 |
7.36 |
| Petrobras / Vibra Energia |
Selic |
Selic |
2,164,176 |
3.56 |
| Caixa Econômica Federal |
IPCA |
IPCA + 6.56% |
1,463,284 |
2.41 |
| Bradesco |
CDI, IPCA |
IPCA + 6.56%; CDI + 2% to 2.09% |
1,463,284 |
2.41 |
| Itaú |
IPCA, CDI |
IPCA + 6.56%; CDI + 1.60% to 2.28% |
1,291,430 |
2.13 |
| Banco do Nordeste do Brasil |
CDI, IPCA |
IPCA + 2.74% to 6.56%, 3% to 10%, TFC + 2% to 3% |
956,653 |
1.57 |
| Other creditors |
CDI, IPCA, TJLP, Fixed rate |
IPCA + 6.56%, CDI + 2% to 2.17%, 122.84% CDI, TJLP + 5%;
pre-fixed rate up to 10% |
6,264,594 |
10.31 |
| Foreign Currency - Bonds and other debts |
USD |
- |
6,687,432 |
11.01 |
| Foreign currency - other debts |
EUR |
2,00% to 4,50% |
207,691 |
0.34 |
| TOTAL |
|
|
60,751,325 |
100 |
*It should be noted that the Company has carried out currency hedge
operations for some of its foreign currency debts, which with their respective equivalent rates (post hedge) linked to the CDI are shown
below:
2025 Bonds - 97.41% of CDI
2030 Bonds - CDI + 1.70% p.a.
Citibank - CDI + 1.70% p.a.
** Exposure to BNDES only considers contracts of the BNDES direct
line.
| 4. | Loans and Financing (Receivables) |
| 4.1. | Holding / Parent Company and
Consolidated |
Graph 11 – Receivables (R$ billion)
Does not include ADA of R$3,989 million and current charge.
The RBSE
RAP estimate of the Economic Component for the 2023-2028 tariff cycle presented in the 4Q23 earnings release was defined based on the
information published by ANEEL in the 2018 Periodic RAP Review. It should be noted that this
portion of the revenue is under Public Consultation in CP ANEEL 12/2024, which aims to obtain subsidies regarding the RAP Review of the
Extended Transmission Concession Contracts under the terms of Law No. 12,783/2013, with a review date of July 1, 2023.
Based on the
preliminary data published in CP 12/2024, the preliminary net remuneration base (BRL) forecast for July/2027 is around R$ 6.8 billion,
which may change after the conclusion of the Public Consultation.
Once the result
of the 2023 Periodic RAP Review is approved, we will present a new table with updated values.
It is
worth noting that, in accordance with MME Ordinance No. 120/2016, the undepreciated values of the assets that make up the RBSE economic
component must constitute the companies' remuneration base, so the revenue from this portion does not have a pre-defined closing date.
Revenue will be recognized as long as there is an undepreciated asset base. It is worth noting that land and easements do not depreciate.
RBSE Financial Component
In April 2023, ANEEL issued Technical Note 085/2023,
which addresses the comments on the calculations presented as part of the payment of RBSE's financial component in Technical Note 085/2022-SGT/ANEEL
of June 2022, which in turn revisited the requests for reconsideration filed as part of payment of RBSE's financial component and re-profiling.
The document does not constitute a decision by ANEEL, and therefore has no practical effect as of the date of publication of this document,
since it depends on a decision by the ANEEL board, and therefore had no impact on Homologatory Resolution 3,216/23, which established
the RAPs for the 2023-2024 cycle. The Company continues to monitor and act on the issue so that the assumptions, methodologies and calculations
considered so far remain in force.
Table 30 – Investments (R$ mn)
| |
1Q24 |
1Q23 |
% |
4Q23 |
% |
| Generation Corporate |
483 |
476 |
1 |
1,238 |
-61 |
| Implementation / Expansion |
281 |
274 |
3 |
492 |
-43 |
| Maintenance |
202 |
202 |
- |
746 |
-73 |
| Transmission Corporate |
627 |
477 |
31 |
1,372 |
-54 |
| Expansion |
4 |
32 |
-88 |
80 |
-95 |
| Reinforcements and Improvements |
585 |
182 |
221 |
1,053 |
-44 |
| Maintenance |
38 |
263 |
-86 |
239 |
-84 |
| Infrastructure and Others |
87 |
67 |
30 |
295 |
-71 |
| SPEs1 |
5 |
101 |
-95 |
1,728 |
-100 |
| Generation - Contributions |
- |
29 |
- |
53 |
- |
| Generation - Acquisition |
- |
64 |
- |
1,098 |
- |
| Transmission - Contributions |
5 |
8 |
-38 |
- |
- |
| Transmission - Acquisition |
- |
- |
- |
577 |
- |
| Total |
1,202 |
1,121 |
7 |
4,632 |
-74 |
1
Capital contribution
Generation
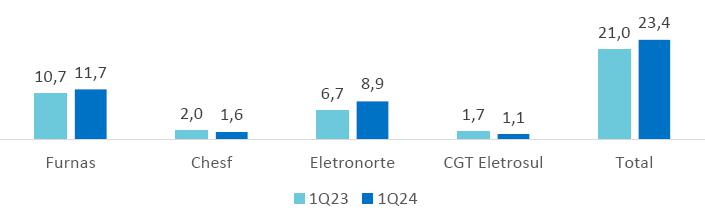
Investments in generation totaled R$483 million
in 1Q24, with the main projects being:
| § | Implementation and Expansion: Around
R$ 279 million of CGT Eletrosul's investment in the deployment of materials for the Coxilha Negra wind farm; R$ 2 million from Chesf for
the Casa Nova B wind farm; |
| § | Maintenance: Chesf with R$ 98 million,
highlighting equipment replacement at Paulo Afonso IV and Sobradinho totaling R$ 42 million; Eletronorte with R$ 46 million, highlighting
the Tucuruí and Mauá 3 TPP plants; and Furnas with R$ 18 million in maintenance and modernizations. |
Transmission
Investments in transmission totaled R$ 627 million
in 1Q24, with the following standing out:
| § | Chesf - R$188 million in reinforcements,
improvements and maintenance/other, with R$120 million in large-scale reinforcement and improvement projects; |
| § | Furnas - R$ 149 million in reinforcements,
improvements and maintenance/others, with R$ 52 million in small reinforcements and improvements and R$ 92 million in large reinforcements
and improvements; |
| § | Eletronorte - R$ 210 million in reinforcements, improvements and
maintenance, of which
R$ 115 million in reinforcements and major improvements in more than 40 projects; |
| § | CGT Eletrosul - R$77 million in various
transmission projects, of which R$24 million in reinforcements and small-scale improvements. |
Table 32 – ESG Metrics 1Q24
| Pilar |
Metric |
1Q24 |
1Q23 |
Variation |
Results Analysis |
| Prosperity |
Investment in Technology and Innovation |
R$ 120.6 million |
R$ 123.6 million |
-2.4% |
Slight variation, considering these are preliminary figures. |
| People |
Accident Frequency Rate - own employees (with time off) |
0.96 |
2.87 |
-66.6% |
The result reflects the new culture project
started in 2023, which has unfolded into several initiatives, including:
ü
Commitments for Life, where more than 90% of employees
in the operations and engineering areas have already been trained.
ü
The reporting and handling of incidents are more mature
and have resulted in action plans for the whole Company, which are monitored periodically.
|
| Women in the workforce (%) |
18.6% |
18.3% |
0.3p.p. |
A Diversity & Inclusion plan is currently being
drawn up. |
| Management positions held by women (%) |
25.8% |
24.2% |
1.6p.p. |
| Governance |
Investigation of complaints dealt within
the
term (%) |
99% |
98% |
1.0p.p. |
Slight variation, with an improvement of 0.4%, reaching 99% of complaints investigated. The consistency of the data shows the maturity of the process. It should be considered that the response time was reduced from 180 to 120 days between 2023 and 2024. |
Note: The figures presented are partial, preliminary
and didn’t go through assurance, and may be adjusted in accordance to the processes of calculating, verifying and updating the data.
Cash generated by operating activities reached R$3,467 million in 1Q24,
a 61% increase on the R$2,147 million recorded in 1Q23. Positive free cash flow totaled R$1,659 million in the quarter.
Cash generation in 1Q24 was used to: (a) service debt (R$3,017 million),
(b) make investments (R$1,809 million) and (c) pay litigation (R$953 million).
Table 32 – Cash Flow (R$ mn)
| |
1Q24 |
1Q23 |
% |
| Adjusted Regulatory EBITDA |
5,398 |
5,140 |
5 |
| Income Tax and Social Contribution |
-323 |
-602 |
-46 |
| Working Capital |
-829 |
-1,550 |
-47 |
| Privatization Charges |
-924 |
-850 |
9 |
| Dividends Received |
145 |
9 |
1530 |
| Operating Cash Flow |
3,467 |
2,147 |
61 |
| Investments |
-1,809 |
-1,456 |
24 |
| Free Cash Flow |
1,659 |
691 |
140 |
| Debt Service |
-3,017 |
-2,797 |
8 |
| Capital Investments |
- |
-148 |
- |
| Litigation |
-953 |
-504 |
89 |
| Net funds raised |
525 |
15 |
3496 |
| Receipt of loans and financial charges |
147 |
183 |
-20 |
| Dividends |
- |
-229 |
- |
| Net Cash |
-1,640 |
-2,788 |
-41 |
Results by company in Excel will be available soon at Eletrobras IR
website.
8.1.
Appendix 1 – Financial Statements
Table 33 – Balance Sheet (R$ thousand)
| |
P A R E N TC O M P A N Y |
|
C O N S O L I D A T E D |
| ACTIVE |
03/31/2024 |
|
12/31/2023 |
|
03/31/2024 |
|
12/31/2023 |
| CURRENT |
|
|
|
|
|
|
|
| Cash and cash equivalents |
5,548,216 |
|
5,698,457 |
|
11,492,219 |
|
13,046,371 |
| Restricted cash |
50,892 |
|
250,060 |
|
672,096 |
|
572,869 |
| Securities |
1,391,570 |
|
2,477,747 |
|
5,834,741 |
|
5,920,171 |
| Clients |
111 |
|
- |
|
4,979,270 |
|
5,210,482 |
| Transmission contract assets |
- |
|
- |
|
10,587,229 |
|
11,159,426 |
| Financing, loans and debentures |
1,174,347 |
|
1,099,798 |
|
477,296 |
|
367,741 |
| Remuneration for equity holdings |
1,666,615 |
|
2,358,819 |
|
831,182 |
|
871,558 |
| Taxes and Contributions |
463,728 |
|
893,865 |
|
1,066,325 |
|
1,274,969 |
| Income tax and social contribution |
348,745 |
|
554,421 |
|
2,821,984 |
|
2,932,258 |
| Right to compensation |
777,508 |
|
940,268 |
|
804,649 |
|
980,206 |
| Warehouse |
207 |
|
204 |
|
449,006 |
|
426,690 |
| Derivative financial instruments |
- |
|
- |
|
301,778 |
|
373,606 |
| Others |
428,026 |
|
414,679 |
|
1,755,696 |
|
1,698,824 |
| |
11,849,965 |
|
14,688,318 |
|
42,073,471 |
|
44,835,171 |
| |
|
|
|
|
|
|
|
| Assets held for sale |
221,972 |
|
221,972 |
|
3,156,164 |
|
3,187,141 |
| |
12,071,937 |
|
14,910,290 |
|
45,229,635 |
|
48,022,312 |
| |
|
|
|
|
|
|
|
| NON-CURRENT |
|
|
|
|
|
| LONG-TERM ASSETS |
|
|
|
|
|
|
|
| Restricted cash |
- |
|
- |
|
2,588,233 |
|
2,200,078 |
| Right to compensation |
1,184,203 |
|
1,332,167 |
|
1,231,700 |
|
1,385,479 |
| Financing, loans and debentures |
6,667,001 |
|
6,852,841 |
|
176,887 |
|
260,409 |
| Clients |
- |
|
- |
|
635,002 |
|
649,446 |
| Securities |
431,900 |
|
432,355 |
|
432,258 |
|
432,724 |
| Taxes and Contributions |
1,322,023 |
|
804,582 |
|
1,676,731 |
|
1,153,616 |
| Deferred income tax and social contribution |
- |
|
- |
|
6,211,483 |
|
6,725,087 |
| Bonds and linked deposits |
3,514,706 |
|
3,337,816 |
|
6,193,608 |
|
6,246,082 |
| Transmission contractual assets |
- |
|
- |
|
50,082,574 |
|
50,052,912 |
| Others |
1,432,315 |
|
1,495,993 |
|
1,140,904 |
|
1,053,164 |
| |
14,552,148 |
|
14,255,754 |
|
70,369,380 |
|
70,158,997 |
| |
|
|
|
|
|
|
|
| INVESTMENTS |
|
|
|
|
|
| Equity accounted |
142,927,008 |
|
141,814,345 |
|
32,524,208 |
|
32,100,302 |
| Held at fair value |
1,014,238 |
|
1,046,762 |
|
1,070,477 |
|
1,104,381 |
| |
143,941,246 |
|
142,861,107 |
|
33,594,685 |
|
33,204,683 |
| |
|
|
|
|
|
| FIXED ASSETS |
197,571 |
|
201,942 |
|
35,762,038 |
|
35,805,421 |
| |
|
|
|
|
|
| INTANGIBLE |
137,454 |
|
129,890 |
|
79,425,463 |
|
79,866,241 |
| |
|
|
|
|
|
| |
158,828,419 |
|
157,448,693 |
|
219,151,566 |
|
219,035,342 |
| |
|
|
|
|
|
|
|
| TOTAL ASSETS |
170,900,356 |
|
172,358,983 |
|
264,381,201 |
|
267,057,654 |
| |
|
|
|
|
|
|
|
| |
P A R E N T C O M P A N Y |
|
C O N S O L I D A T E D |
LIABILITIES AND
SHAREHOLDER’S EQUITY |
03/31/2024 |
|
31/12/2023 |
|
03/31/2024 |
|
31/12/2023 |
| |
|
|
| CURRENT |
|
|
|
|
|
|
|
| Loans, financing and debentures |
10,195,981 |
|
7,782,422 |
|
14,474,244 |
|
11,330,847 |
| Compulsory loans - Agreements |
1,545,937 |
|
896,746 |
|
1,545,937 |
|
896,746 |
| Compulsory loans |
1,291,258 |
|
1,257,291 |
|
1,291,258 |
|
1,257,291 |
| Suppliers |
104,543 |
|
155,989 |
|
1,852,650 |
|
2,963,867 |
| Taxes and Contributions |
55,502 |
|
241,541 |
|
654,686 |
|
992,887 |
| Income tax and social contribution |
- |
|
- |
|
56,673 |
|
29,675 |
| Onerous contracts |
- |
|
- |
|
191,170 |
|
120,660 |
| Shareholder remuneration |
1,101,700 |
|
1,110,416 |
|
1,111,080 |
|
1,154,836 |
| Personnel obligations |
210,298 |
|
213,767 |
|
1,437,354 |
|
1,634,933 |
| Post-employment benefits |
- |
|
- |
|
283,467 |
|
292,990 |
| Provisions for disputes |
1,869,249 |
|
1,993,061 |
|
2,118,619 |
|
2,290,873 |
| Sector charges |
- |
|
- |
|
854,834 |
|
765,619 |
| Obligations under Law 14,182/2021 |
- |
|
- |
|
2,178,746 |
|
2,161,176 |
| Leasing |
10,889 |
|
10,959 |
|
37,927 |
|
44,020 |
| Others |
38,453 |
|
89,312 |
|
475,986 |
|
948,907 |
| |
16,423,810 |
|
13,751,504 |
|
28,564,631 |
|
26,885,327 |
| |
|
|
|
|
|
|
|
| Liabilities associated with assets held for sale |
- |
|
- |
|
228,933 |
|
274,464 |
| |
16,423,810 |
|
13,751,504 |
|
28,793,564 |
|
27,159,791 |
| |
|
|
|
|
|
|
|
| NON-CURRENT |
|
|
|
|
|
|
|
| Loans, financing and debentures |
25,417,012 |
|
28,354,875 |
|
46,277,080 |
|
49,449,443 |
| Provisions for disputes |
14,605,796 |
|
15,598,552 |
|
23,367,962 |
|
24,250,819 |
| Post-employment benefits |
875,996 |
|
859,753 |
|
5,379,939 |
|
5,293,808 |
| Obligations under Law 14,182/2021 |
- |
|
- |
|
37,691,392 |
|
37,358,230 |
| Onerous contracts |
- |
|
- |
|
841,340 |
|
950,468 |
| Leasing |
22,285 |
|
24,972 |
|
167,723 |
|
172,727 |
| Concessions payable - Use of public assets |
- |
|
- |
|
569,139 |
|
566,172 |
| Advances for future capital increases |
100,828 |
|
98,252 |
|
100,828 |
|
98,252 |
| Derivative financial instruments |
193,302 |
|
645,302 |
|
195,602 |
|
657,514 |
| Sector charges |
- |
|
- |
|
412,801 |
|
432,341 |
| Taxes and Contributions |
- |
|
- |
|
531,889 |
|
574,781 |
| Deferred income tax and social contribution |
429,775 |
|
440,834 |
|
5,474,108 |
|
5,721,830 |
| Others |
249,280 |
|
251,567 |
|
1,862,656 |
|
1,906,834 |
| |
41,894,274 |
|
46,274,107 |
|
122,872,459 |
|
127,433,219 |
| |
|
|
|
|
|
|
|
| |
|
|
|
|
|
|
|
| SHAREHOLDERS’ EQUITY |
|
|
|
|
|
|
|
| Share capital |
70,099,826 |
|
70,099,826 |
|
70,099,826 |
|
70,099,826 |
| Share issue costs |
-108,186 |
|
-108,186 |
|
-108,186 |
|
-108,186 |
| Capital Reserves and Granted Equity Instruments |
13,896,728 |
|
13,889,339 |
|
13,896,728 |
|
13,889,339 |
| Treasury shares |
-2,114,256 |
|
-2,114,256 |
|
-2,114,256 |
|
-2,114,256 |
| Profit reserves |
37,536,595 |
|
37,536,595 |
|
37,536,595 |
|
37,536,595 |
| Proposed additional dividend |
216,114 |
|
216,114 |
|
216,114 |
|
216,114 |
| Accumulated profit |
336,132 |
|
- |
|
336,132 |
|
- |
| Accumulated other comprehensive income (loss) |
-7,280,681 |
|
-7,186,060 |
|
-7,280,681 |
|
-7,186,060 |
| Controlling shareholders |
112,582,272 |
|
112,333,372 |
|
112,582,272 |
|
112,333,372 |
| |
|
|
|
|
|
|
|
| Non-controlling shareholders |
- |
|
- |
|
132,906 |
|
131,272 |
| |
|
|
|
|
|
|
|
| TOTAL SHAREHOLDERS' EQUITY |
112,582,272 |
|
112,333,372 |
|
112,715,178 |
|
112,464,644 |
| |
|
|
|
|
|
|
|
| TOTAL LIABILITIES AND SHAREHOLDERS' EQUITY |
170,900,356 |
|
172,358,983 |
|
264,381,201 |
|
267,057,654 |
Table 34 - Income Statement (R$ Thousand)
| |
P A R E N T C O M P A N Y |
|
C O N S O L I D A T E D |
| |
03/31/2024 |
|
31/12/2023 |
|
03/31/2024 |
|
03/31/2024 |
| CONTINUING OPERATIONS |
|
|
|
|
|
|
|
| |
|
|
|
|
|
|
|
| Net operating revenue |
14,662 |
|
13,294 |
|
8,718,271 |
|
9,209,833 |
| |
|
|
|
|
|
|
|
| Operating costs |
-32 |
|
-25 |
|
-4,499,682 |
|
-4,014,975 |
| |
|
|
|
|
|
|
|
| GROSS PROFIT |
14,630 |
|
13,269 |
|
4,218,589 |
|
5,194,858 |
| |
|
|
|
|
|
|
|
| Operating expenses |
-107,137 |
|
-277,469 |
|
-1,175,912 |
|
-1,705,350 |
| |
|
|
|
|
|
|
|
| OPERATING RESULT BEFORE FINANCIAL RESULT |
-92,507 |
|
-264,200 |
|
3,042,677 |
|
3,489,508 |
| |
|
|
|
|
|
|
|
| FINANCIAL RESULT |
|
|
|
|
|
|
|
| |
|
|
|
|
|
|
|
| Income from interest, fines, commissions and fees |
247,318 |
|
260,951 |
|
32,234 |
|
145,499 |
| Income from financial investments |
212,567 |
|
291,690 |
|
573,675 |
|
785,665 |
| Late payment surcharge on electricity |
- |
|
- |
|
48,816 |
|
57,028 |
| Other financial income |
67,282 |
|
125,571 |
|
73,628 |
|
149,812 |
| (-) Taxes on financial income |
-28,173 |
|
-38,584 |
|
-51,447 |
|
-66,637 |
| Financial income |
498,994 |
|
639,628 |
|
674,906 |
|
1,071,367 |
| |
|
|
|
|
|
|
|
| Debt charges |
-754,978 |
|
-634,071 |
|
-1,619,496 |
|
-1,851,848 |
| CDE obligation charges |
- |
|
- |
|
-609,710 |
|
-553,101 |
| River basin revitalization charges |
- |
|
- |
|
-85,047 |
|
-88,245 |
| Early financing discount -ENBpar |
- |
|
-335,377 |
|
- |
|
-335,377 |
| Other financial expenses |
-54,746 |
|
-67,019 |
|
-156,034 |
|
-180,945 |
| Financial expenses |
-809,724 |
|
-1,036,467 |
|
-2,470,287 |
|
-3,009,516 |
| |
|
|
|
|
|
|
|
| Monetary updates – CDE |
- |
|
- |
|
-493,374 |
|
-603,745 |
| Monetary updates - river basins |
- |
|
- |
|
-86,773 |
|
-127,405 |
| Monetary updates |
-330,108 |
|
-343,182 |
|
-346,776 |
|
-393,556 |
| Exchange rate variations |
896 |
|
150,742 |
|
-2,444 |
|
162,950 |
| Change in fair value of hedged debt net of derivative |
-174,969 |
|
- |
|
-191,053 |
|
- |
| Change in derivative financial instrument not linked to debt protection |
- |
|
- |
|
-71,976 |
|
-232,916 |
| Financial items, net |
-504,181 |
|
-192,440 |
|
-1,192,396 |
|
-1,194,672 |
| |
|
|
|
|
|
|
|
| |
-814,911 |
|
-589,279 |
|
-2,987,777 |
|
-3,132,821 |
| |
|
|
|
|
|
|
|
| PROFIT BEFORE EQUITY HOLDINGS |
-907,418 |
|
-853,479 |
|
54,900 |
|
356,687 |
| |
|
|
|
|
|
|
|
| Equity income |
1,235,115 |
|
1,354,188 |
|
575,962 |
|
508,826 |
| |
|
|
|
|
|
|
|
| Other income and expenses |
354 |
|
-12,699 |
|
4,767 |
|
-11,457 |
| |
|
|
|
|
|
|
|
| OPERATING PROFIT BEFORE TAX |
328,051 |
|
488,010 |
|
635,629 |
|
854,056 |
| |
|
|
|
|
|
|
|
| Current income tax and social contribution |
- |
|
608 |
|
-21,602 |
|
-398,413 |
| Deferred income tax and social contribution |
- |
|
- |
|
-283,493 |
|
-49,680 |
| |
|
|
|
|
|
|
|
| NET INCOME FOR THE YEAR |
328,051 |
|
488,618 |
|
330,534 |
|
405,963 |
| |
|
|
|
|
|
|
|
| Portion Attributed to Controlling Shareholders |
328,051 |
|
488,618 |
|
328,051 |
|
488,618 |
| Portion attributable to non-controlling shareholders |
- |
|
- |
|
2,483 |
|
-82,655 |
| |
|
|
|
|
|
|
|
| EARNINGS PER SHARE |
|
|
|
|
|
|
|
| |
|
|
|
|
|
|
|
| Earnings per share - basic (ON) |
R$0.14 |
|
R$0.21 |
|
R$0.14 |
|
R$0.21 |
| Earnings per share - basic (PN) |
R$0.15 |
|
R$0.23 |
|
R$0.15 |
|
R$0.23 |
| Earnings per share - diluted (ON) |
R$0.14 |
|
R$0.21 |
|
R$0.14 |
|
R$0.21 |
| Earnings per share - diluted (PN) |
R$0.15 |
|
R$0.23 |
|
R$0.15 |
|
R$0.23 |
Table 35 - Cash Flow Statement (R$ Thousand)
| |
P A R E N T C O M P A N Y |
|
C O N S O L I D A T E D |
| |
03/31/2024 |
|
31/03/2023 |
|
03/31/2024 |
|
31/03/2023 |
| |
|
|
|
| OPERATING ACTIVITIES |
|
|
|
|
|
|
|
| |
|
|
|
|
|
|
|
| Profit for the year before income tax and social contribution |
328,051 |
|
488,010 |
|
635,629 |
|
854,056 |
| |
|
|
|
|
|
|
|
| Adjustments to reconcile profit with cash generated by operations: |
|
|
|
|
|
|
|
| Depreciation and amortization |
4,377 |
|
3,217 |
|
996,711 |
|
903,383 |
| Net exchange and monetary variations |
329,212 |
|
192,440 |
|
929,367 |
|
961,756 |
| Financial charges |
295,093 |
|
416,806 |
|
1,713,710 |
|
1,897,406 |
| Equity income |
-1,235,115 |
|
-1,354,188 |
|
-575,962 |
|
-508,826 |
| Other income and expenses |
-354 |
|
12,699 |
|
-4,767 |
|
11,457 |
| Transmission revenues |
- |
|
- |
|
-4,558,572 |
|
-4,335,936 |
| Construction cost - transmission |
- |
|
- |
|
641,806 |
|
398,199 |
| Operating provisions (reversals) |
-180,627 |
|
53,934 |
|
195,661 |
|
715,734 |
| Result of hedged debt and derivatives |
174,969 |
|
- |
|
263,029 |
|
232,916 |
| Other |
2,269 |
|
23,421 |
|
117,444 |
|
333,348 |
| |
-610,176 |
|
-651,671 |
|
-281,573 |
|
589,437 |
| |
|
|
|
|
|
|
|
| (Additions)/decreases in operating assets |
|
|
|
|
|
|
|
| Clients |
-111 |
|
20 |
|
245,656 |
|
-166,707 |
| Right to compensation |
-42,549 |
|
236,021 |
|
-23,938 |
|
164,469 |
| Others |
-36,976 |
|
262,110 |
|
-541,798 |
|
121,765 |
| |
-79,636 |
|
498,151 |
|
-320,080 |
|
119,527 |
| Increases/(decreases) in operating liabilities |
|
|
|
|
|
|
|
| Suppliers |
-51,446 |
|
-69,746 |
|
-1,111,217 |
|
-1,000,137 |
| Personnel obligations |
-3,469 |
|
-1,672 |
|
-197,579 |
|
-525,209 |
| Sector charges |
- |
|
- |
|
69,675 |
|
-2,537 |
| Others |
-239,185 |
|
-338,954 |
|
-321,710 |
|
-285,236 |
| |
-294,100 |
|
-410,372 |
|
-1,560,831 |
|
-1,813,119 |
| |
|
|
|
|
|
|
|
| Payment of financial charges |
-902,194 |
|
-292,140 |
|
-1,535,742 |
|
-1,001,820 |
| Receipt of RAP revenue |
- |
|
- |
|
5,101,107 |
|
3,928,970 |
| Receipt of remuneration from equity holdings |
822,193 |
|
8,890 |
|
144,873 |
|
8,890 |
| Payment of disputes |
-111,603 |
|
-452,591 |
|
-243,504 |
|
-503,587 |
| Bonds and linked deposits |
-175,340 |
|
-110,249 |
|
-206,260 |
|
-344,706 |
| Payment of income tax and social contribution |
-25,874 |
|
-140,274 |
|
-322,543 |
|
-601,886 |
| Supplementary pension payments |
-5,452 |
|
-3,976 |
|
-124,997 |
|
-189,697 |
| |
|
|
|
|
|
|
|
| Net cash provided by (used in) operating activities |
-1,054,131 |
|
-1,066,222 |
|
1,286,079 |
|
1,046,065 |
| |
|
|
|
|
|
|
|
| FINANCING ACTIVITIES |
|
|
|
|
|
|
|
| Loans and financing obtained and debentures obtained |
- |
|
- |
|
524,896 |
|
14,604 |
| Payment of loans and financing and debentures - principal |
-892,198 |
|
-664,101 |
|
-1,150,846 |
|
-1,794,963 |
| Payment of remuneration to shareholders |
-424 |
|
-3,070 |
|
-424 |
|
-3,070 |
| Payment to dissenting shareholders - incorporation of shares |
- |
|
-212 |
|
- |
|
-226,057 |
| Share buybacks |
- |
|
-147,683 |
|
- |
|
-147,683 |
| Payment of CDE obligations and revitalization of basins – principal |
- |
|
- |
|
-846,890 |
|
-850,113 |
| Lease payments - principal |
-4,851 |
|
- |
|
-16,088 |
|
-190,934 |
| Others |
- |
|
- |
|
- |
|
- |
| |
|
|
|
|
|
|
|
| Net cash (used in) financing activities |
-897,472 |
|
-815,065 |
|
-1,489,352 |
|
-3,198,216 |
| |
|
|
|
|
|
|
|
| INVESTMENT ACTIVITIES |
|
|
|
|
|
|
|
| |
|
|
|
|
|
|
|
| Grant of advance for future capital increase |
-5,113 |
|
- |
|
-5,113 |
|
- |
| Receipt of loans and financing |
436,887 |
|
376,307 |
|
304,308 |
|
183,353 |
| Receipt of financial charges |
290,979 |
|
193,777 |
|
53,935 |
|
55,780 |
| Acquisition of fixed assets |
-2 |
|
-2,856 |
|
-661,972 |
|
-688,470 |
| Acquisition of intangible assets |
-7,566 |
|
-8,977 |
|
-58,634 |
|
-21,374 |
| Net financial investments (securities) |
1,086,178 |
|
1,957,082 |
|
297,073 |
|
3,947,534 |
| Transmission infrastructure - contractual asset |
- |
|
- |
|
-642,555 |
|
-398,199 |
| Capital acquisition/contribution of equity holdings |
- |
|
-2,108 |
|
- |
|
-71,759 |
| Disposal of equity holdings |
- |
|
- |
|
1,208 |
|
- |
| Others |
- |
|
- |
|
- |
|
83,660 |
| |
|
|
|
|
|
|
|
| Net cash provided by (used in) investing activities |
1,801,362 |
|
2,513,224 |
|
-1,350,879 |
|
3,030,895 |
| |
|
|
|
|
|
|
|
| Increase (decrease) in cash and cash equivalents |
-150,241 |
|
631,937 |
|
-1,554,152 |
|
878,744 |
| |
|
|
|
|
|
|
|
| Cash and cash equivalents at the beginning of the period |
5,698,457 |
|
4,927,871 |
|
13,046,371 |
|
10,739,126 |
| Cash and cash equivalents at the end of the period |
5,548,216 |
|
5,559,808 |
|
11,492,219 |
|
11,617,870 |
| |
-150,241 |
|
631,937 |
|
-1,554,152 |
|
878,744 |
8.2.
Appendix 2 – Compulsory
Loan
In the context of the compulsory loan on electricity
(ECE) lawsuits, which discuss the monetary update of book credits, the Company has been taking steps to mitigate the risks involved and
has created the Compulsory Loan Department, with the aim of strengthening strategic action in legal defenses and seeking court settlements
with discounts and full settlement of the respective lawsuits.
As a result of these negotiations, Eletrobras
reduced its inventory of such loans by R$1.137 billion to R$16.027 billion in 1Q24, mainly as a result of the agreements reached, which
resulted in a R$441 million reduction in the provision, with a direct positive effect on the bottom line, offset by the net constitution
of provision in the amount of R$85 million as a result of unfavorable decisions in specific lawsuits. Eletrobras is taking legal action
to reverse these unfavorable decisions.
In the financial results, monetary update declined
to R$207 million in 1Q24 from R$377 million in 1Q23 due to the reduction in the provision inventory, as mentioned above.
Since 3Q22, when negotiations on the compulsory
loan began, and the inventory of provisions for lawsuits involving book-credits for the compulsory loans was R$25.8 billion, there has
been a reduction of R$9.8 billion in this inventory, despite the accumulated monetary update of
R$1.7 billion between the periods, which is in line with the Company's strategy of reducing legal liabilities. The legal agreements reached
led to the elimination of off-balance sheet risk of
R$6.5 billion, of which R$698 million in possible and R$3.8 billion in remote.
Graph 12 –
Total Inventory Compulsory Loan Provision (R$ bn)
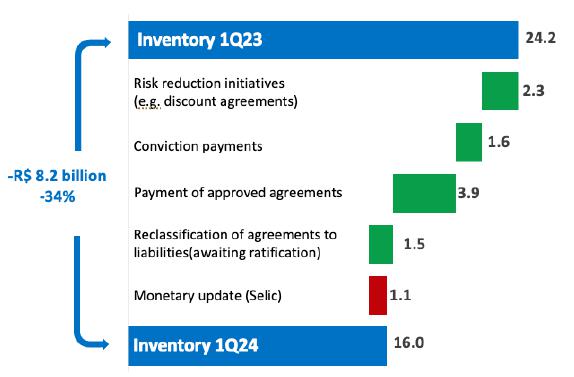
* Considering that Eletrobras has already entered into legal agreements
with Creditors that are only awaiting ratification for due payment, the amounts have been reclassified to liabilities.
8.3.
Appendix 3 – Reconciliation
IFRS X Regulatory
Table 36 - Reconciliation IFRS vs. Regulatory (R$ Thousand)
| |
CVM result - corporate |
|
Regulatory result |
|
Differences |
|
CVM result - corporate |
|
Regulatory result |
|
Differences |
| |
03/31/2024 |
|
03/31/2024 |
|
|
03/31/2023 |
' |
03/31/2023 |
|
| |
|
|
|
|
|
|
|
|
|
|
|
| OPERATING REVENUES |
|
|
|
|
|
|
|
|
|
|
|
| |
|
|
|
|
|
|
|
|
|
|
|
| Generation |
|
|
|
|
|
|
|
|
|
|
|
| |
|
|
|
|
|
|
|
|
|
|
|
| Power supply for distribution companies |
3,683,460 |
|
4,115,207 |
|
-431,747 |
|
4,020,713 |
|
4,020,713 |
|
- |
| Power supply for end consumers |
761,385 |
|
761,385 |
|
- |
|
1,074,252 |
|
1,074,252 |
|
- |
| CCEE revenue (short term market) |
701,165 |
|
701,165 |
|
- |
|
435,315 |
|
435,315 |
|
- |
| Operation and maintenance revenue |
787,242 |
|
787,242 |
|
- |
|
1,029,945 |
|
1,029,945 |
|
- |
| Revenue from construction of Power Plants |
- |
|
- |
|
- |
|
- |
|
- |
|
- |
| Rate of return updates - Generation |
- |
|
- |
|
- |
|
- |
|
- |
|
- |
| Itaipu transfer |
- |
|
- |
|
- |
|
- |
|
- |
|
- |
| |
|
|
|
|
|
|
|
|
|
|
|
| Transmission |
|
|
|
|
|
|
|
|
|
|
|
| |
|
|
|
|
|
|
|
|
|
|
|
| Operation and maintenance revenue - Renewed Lines |
- |
|
- |
|
- |
|
- |
|
- |
|
- |
| Operation and maintenance revenue |
1,898,661 |
|
1,898,661 |
|
- |
|
1,753,280 |
|
1,873,044 |
|
-119,764 |
| Financial - Return on Investment - RBSE |
- |
|
- |
|
- |
|
- |
|
- |
|
- |
| Construction revenue |
585,683 |
|
- |
|
585,683 |
|
283,861 |
|
- |
|
283,861 |
| Contract revenue – Transmission |
2,074,228 |
|
- |
|
2,074,228 |
|
2,298,795 |
|
- |
|
2,298,795 |
| Transmission System Availability (Rap) |
- |
|
3,211,041 |
|
-3,211,041 |
|
- |
|
2,153,164 |
|
-2,153,164 |
| |
|
|
|
|
|
|
|
|
|
|
|
| Other income |
79,370 |
|
78,444 |
|
926 |
|
101,063 |
|
101,063 |
|
- |
| |
|
|
|
|
|
|
|
|
|
|
|
| Deductions |
|
|
|
|
|
|
|
|
|
|
|
| |
|
|
|
|
|
|
|
|
|
|
|
| (-) Sector charges |
-648,914 |
|
-648,914 |
|
- |
|
-618,998 |
|
-618,998 |
|
- |
| (-) ICMS |
-236,462 |
|
-236,462 |
|
- |
|
-255,765 |
|
-255,765 |
|
- |
| (-) PASEP and COFINS |
-966,503 |
|
-966,503 |
|
- |
|
-910,092 |
|
-910,092 |
|
- |
| (-) Other Deductions |
-1,044 |
|
-1,044 |
|
- |
|
-2,536 |
|
-2,536 |
|
- |
| |
|
|
|
|
|
|
|
|
|
|
|
| Net operating revenue |
8,718,271 |
|
9,700,222 |
|
-981,951 |
|
9,209,833 |
|
8,900,105 |
|
309,728 |
| |
|
|
|
|
|
|
|
|
|
|
|
| OPERATING COSTS |
|
|
|
|
|
|
|
|
|
|
|
| |
|
|
|
|
|
|
|
|
|
|
|
| Personnel, Material and Services |
-666,689 |
|
-666,491 |
|
-198 |
|
-844,063 |
|
-844,063 |
|
- |
| Energy purchased for resale |
-737,337 |
|
-912,873 |
|
175,536 |
|
-638,505 |
|
-817,814 |
|
179,309 |
| Charges for use of the electricity grid |
-971,645 |
|
-971,645 |
|
- |
|
-810,081 |
|
-810,081 |
|
- |
| Fuel for electricity production |
-505,536 |
|
-505,536 |
|
- |
|
-442,021 |
|
-442,021 |
|
- |
| Construction |
-641,806 |
|
- |
|
-641,806 |
|
-398,199 |
|
- |
|
-398,199 |
| Depreciation |
-446,749 |
|
-917,786 |
|
471,037 |
|
-450,154 |
|
-920,741 |
|
470,587 |
| Amortization |
-490,085 |
|
-501,932 |
|
11,847 |
|
-401,121 |
|
-403,364 |
|
2,243 |
| Operating provisions/reversals |
- |
|
- |
|
- |
|
- |
|
- |
|
- |
| Other costs |
-39,835 |
|
-39,890 |
|
55 |
|
-30,831 |
|
-92,157 |
|
61,326 |
| Operating costs |
-4,499,682 |
|
-4,516,153 |
|
16,471 |
|
-4,014,975 |
|
-4,330,241 |
|
315,266 |
| |
|
|
|
|
|
|
|
|
|
|
|
| GROSS PROFIT |
4,218,589 |
|
5,184,069 |
|
-965,480 |
|
5,194,858 |
|
4,569,864 |
|
624,994 |
| |
|
|
|
|
|
|
|
|
|
|
|
| OPERATING EXPENSES |
|
|
|
|
|
|
|
|
|
|
|
| |
|
|
|
|
|
|
|
|
|
|
|
| Personnel, Material and Services |
-762,970 |
|
-765,657 |
|
2,687 |
|
-676,516 |
|
-676,516 |
|
- |
| Voluntary Dismissal Program |
-32,736 |
|
-32,736 |
|
- |
|
10,010 |
|
10,010 |
|
- |
| Remuneration and compensation |
- |
|
- |
|
- |
|
- |
|
- |
|
- |
| Depreciation |
-50,702 |
|
-49,514 |
|
-1,188 |
|
-44,567 |
|
-25,023 |
|
-19,544 |
| Amortization |
-9,175 |
|
-9,175 |
|
- |
|
-7,541 |
|
-5,406 |
|
-2,135 |
| Donations and contributions |
-52,523 |
|
-52,523 |
|
- |
|
-46,521 |
|
-46,521 |
|
- |
| Operating provisions/reversals |
-195,661 |
|
-496,657 |
|
300,996 |
|
-715,734 |
|
-742,551 |
|
26,817 |
| Other expenses |
-72,145 |
|
-170,295 |
|
98,150 |
|
-224,481 |
|
-163,590 |
|
-60,891 |
| Operating expenses |
-1,175,912 |
|
-1,576,557 |
|
400,645 |
|
-1,705,350 |
|
-1,649,597 |
|
-55,753 |
| |
|
|
|
|
|
|
|
|
|
|
|
| OPERATING RESULT BEFORE FINANCIAL RESULT |
3,042,677 |
|
3,607,512 |
|
-564,835 |
|
3,489,508 |
|
2,920,267 |
|
569,241 |
| |
|
|
|
|
|
|
|
|
|
|
|
| FINANCIAL RESULT |
-2,987,777 |
|
-2,917,462 |
|
-70,315 |
|
-3,132,821 |
|
-2,991,347 |
|
-141,474 |
| |
|
|
|
|
|
|
|
|
|
|
|
| PROFIT BEFORE EQUITY HOLDINGS |
54,900 |
|
690,050 |
|
-635,150 |
|
356,687 |
|
-71,080 |
|
427,767 |
| |
|
|
|
|
|
|
|
|
|
|
|
| Equity income |
575,962 |
|
446,085 |
|
129,877 |
|
508,826 |
|
222,877 |
|
285,949 |
| |
|
|
|
|
|
|
|
|
|
|
|
| Other income and expenses |
4,767 |
|
4,767 |
|
- |
|
-11,457 |
|
-11,457 |
|
- |
| |
|
|
|
|
|
|
|
|
|
|
|
| OPERATING PROFIT BEFORE TAX |
635,629 |
|
1,140,902 |
|
-505,273 |
|
854,056 |
|
140,340 |
|
713,716 |
| |
|
|
|
|
|
|
|
|
|
|
|
| Current income tax and social contribution |
-21,602 |
|
-21,602 |
|
- |
|
-398,413 |
|
-398,413 |
|
- |
| Deferred income tax and social contribution |
-283,493 |
|
-348,598 |
|
-65,105 |
|
-49,680 |
|
-3,831 |
|
-45,849 |
| |
|
|
|
|
|
|
|
|
|
|
|
| NET INCOME FOR THE PERIOD |
330,534 |
|
770,702 |
|
-440,168 |
|
405,963 |
|
-261,904 |
|
667,867 |

SIGNATURE
Pursuant to the requirements of the
Securities Exchange Act of 1934, the registrant has duly caused this report to be signed on its behalf by the undersigned, thereunto
duly authorized.
Date: May 8, 2024
| CENTRAIS ELÉTRICAS BRASILEIRAS S.A. - ELETROBRÁS |
| |
|
|
| By: |
/S/ Eduardo Haiama
|
|
| |
Eduardo Haiama
Vice-President of Finance and Investor Relations |
|
FORWARD-LOOKING STATEMENTS
This press release may contain forward-looking statements.
These statements are statements that are not historical facts, and are based on management's current view and estimates offuture
economic circumstances, industry conditions, company performance and financial results. The words "anticipates", "believes",
"estimates", "expects", "plans" and similar expressions, as they relate to the company, are intended
to identify forward-looking statements. Statements regarding the declaration or payment of dividends, the implementation of principal
operating and financing strategies and capital expenditure plans, the direction of future operations and the factors or trends
affecting financial condition, liquidity or results of operations are examples of forward-looking statements. Such statements reflect
the current views of management and are subject to a number of risks and uncertainties. There is no guarantee that the expected
events, trends or results will actually occur. The statements are based on many assumptions and factors, including general economic
and market conditions, industry conditions, and operating factors. Any changes in such assumptions or factors could cause actual
results to differ materially from current expectations.
Centrais Eletricas Brasi... (NYSE:EBR)
Historical Stock Chart
From Apr 2024 to May 2024

Centrais Eletricas Brasi... (NYSE:EBR)
Historical Stock Chart
From May 2023 to May 2024
