Brown & Brown, Inc. Second Quarter Results Achieve New Records
for Revenues and Income DAYTONA BEACH, Fla. and TAMPA, Fla., July
18 /PRNewswire-FirstCall/ -- Brown & Brown, Inc. (NYSE:BRO)
announced net income for the second quarter of 2005 of $37,033,000,
or $0.53 per share, an increase of 15.2% from the $32,153,000, or
$0.46 per share, reported for the quarter ended June 30, 2004.
Total revenue for the quarter ended June 30, 2005 was $195,931,000,
compared with 2004 second-quarter revenue of $157,942,000, an
increase of 24.1%. Total revenue for the first half of 2005 was
$398,305,000, compared with six months ended June 30, 2004 revenue
of $323,507,000, up 23.1%. Net income for the first six months of
2005 was $80,051,000, versus $68,501,000 during the comparable 2004
period, an increase of 16.9%. Net income per share for the six
months ended June 30, 2005 was $1.15, versus the $0.99 per share
posted during the same 2004 period, an increase of 16.2%. J. Hyatt
Brown, Chairman and CEO, noted, "We continue to be quite pleased
with the results generated by our outstanding team of insurance
professionals. These results are even more impressive given the
softening and compression of insurance premium rates in virtually
all parts of the country. In some regions, such as Florida, this
decline in rates is being slightly offset by an increase in
business exposure units, created by an improving economy. We
anticipate that we will continue to meet the challenge of these
market changes as they arise." President and Chief Operating
Officer Jim W. Henderson added, "We completed two small
transactions in the second quarter that increased our annualized
acquired revenue to approximately $94 million for the first six
months of 2005. We continue to be pleased with the number and
quality of acquisition prospects in the pipeline. As the market
continues to soften, it requires us to be even more vigilant in
evaluating the long-term sustainability of the margins and earning
power of each acquisition candidate." Brown & Brown, Inc. and
its subsidiaries offer a broad range of insurance and reinsurance
products and services, as well as risk management, third-party
administration and managed health care programs. Providing service
to business, public entity, individual, trade and professional
association clients nationwide, the Company is ranked by Business
Insurance magazine as the United States' eighth largest independent
insurance intermediary. The Company's Web address is
http://www.bbinsurance.com/ . This press release may contain
certain statements relating to future results which are
forward-looking statements, including those relating to continuing
our revenue, earnings and operating growth, as well as identifying
and consummating attractive acquisition opportunities. These
statements are not historical facts, but instead represent only the
Company's current belief regarding future events, many of which, by
their nature, are inherently uncertain and outside of the Company's
control. It is possible that the Company's actual results,
financial condition and achievements may differ, possibly
materially, from the anticipated results, financial condition and
achievements contemplated by these forward-looking statements.
Further information concerning the Company and its business,
including factors that potentially could materially affect the
Company's financial results and condition, as well as its other
achievements, are contained in the Company's filings with the
Securities and Exchange Commission. Some factors include: general
economic conditions around the country; downward commercial
property and casualty premium pressures; the competitive
environment; the integration of the Company's operations with those
of businesses or assets the Company has acquired or may acquire in
the future and the failure to realize the expected benefits of such
integration; the potential occurrence of a disaster that affects
certain areas of the states of Arizona, California, Florida,
Georgia, New Jersey, New York, Pennsylvania and/or Washington,
where significant portions of the Company's business are
concentrated; the actual costs of resolution of contingent
liabilities; those factors relevant to Brown & Brown's
consummation and integration of announced acquisitions, including
any matters analyzed in the due diligence process, material adverse
changes in the customers of the companies whose operations are
acquired, and material adverse changes in the business and
financial condition of either or both companies and their
respective customers; and the cost and impact on the Company of
previously disclosed litigation initiated against the Company and
regulatory inquiries regarding industry and Company practices with
respect to compensation received from insurance carriers. All
forward-looking statements made during any conference call or web
cast are made only as of the date of such conference call and web
cast, and we do not undertake any obligation to publicly update or
correct any forward-looking statements to reflect events or
circumstances that subsequently occur or of which we hereafter
become aware. Brown & Brown, Inc. CONSOLIDATED STATEMENTS OF
INCOME (in thousands, except per share data) (unaudited) For the
For the Three Months Ended Six Months Ended June 30 June 30 2005
2004 2005 2004 REVENUES Commissions and fees $192,738 $156,749
$393,053 $321,063 Investment income 1,524 333 2,489 1,021 Other
income, net 1,669 860 2,763 1,423 Total revenues 195,931 157,942
398,305 323,507 EXPENSES Employee compensation and benefits 94,100
76,270 184,484 152,552 Non-cash stock grant compensation 788 665
1,679 1,510 Other operating expenses 25,980 19,983 53,122 41,379
Amortization 8,357 5,483 15,892 10,300 Depreciation 2,527 2,269
4,894 4,423 Interest 3,711 743 7,253 1,454 Total expenses 135,463
105,413 267,324 211,618 Income before income taxes 60,468 52,529
130,981 111,889 Income taxes 23,435 20,376 50,930 43,388 Net income
$37,033 $32,153 $80,051 $68,501 Net income per share: Basic $0.54
$0.47 $1.16 $1.00 Diluted $0.53 $0.46 $1.15 $0.99 Weighted average
number of shares outstanding: Basic 69,156 68,790 69,159 68,736
Diluted 69,738 69,370 69,724 69,283 Dividends declared per share
$0.08 $0.07 $0.16 $0.14 Brown & Brown, Inc. INTERNAL GROWTH
SCHEDULE Core Commissions and Fees(1) Three Months Ended June 30,
2005 (in thousands) (unaudited) Quarter Quarter Total Total Less
Internal Ended Ended Net Net Acquisition Net 6/30/05 6/30/04 Change
Growth % Revenues Growth % Florida Retail $40,989 $35,928 $5,061
14.1 % $1,827 9.0 % National Retail 51,541 47,225 4,316 9.1 % 4,452
(0.3)% Western Retail 25,830 28,802 (2,972) (10.3)% 113 (10.7)%
Total Retail 118,360 111,955 6,405 5.7 % 6,392 0.0 % Professional
Programs 9,515 10,087 (572) (5.7)% -- (5.7)% Special Programs
20,335 14,659 5,676 38.7 % 3,768 13.0 % Total Programs 29,850
24,746 5,104 20.6 % 3,768 5.4 % Brokerage 34,077 8,322 25,755 309.5
% 24,117 19.7 % TPA Services 6,449 6,086 363 6.0 % -- 6.0 % Total
Core Commissions and Fees (1) $188,736 $151,109 $37,627 24.9 %
$34,277 2.2 % Reconciliation of Internal Growth Schedule to Total
Commissions and Fees Included in the Consolidated Statements of
Income for the Three Months Ended June 2005 and 2004 (in thousands)
(unaudited) Quarter Quarter Ended Ended 6/30/05 6/30/04 Total core
commissions and fees(1) $188,736 $151,109 Contingent commissions
4,002 3,522 Divested business -- 2,118 Total commission & fees
$192,738 $156,749 (1) Total core commissions and fees are our total
commissions and fees less (i) contingent commissions (revenue
derived from special revenue- sharing commissions from insurance
companies based upon the volume and the growth and/or profitability
of the business placed with such companies during the prior year),
and (ii) divested business (commissions and fees generated from
offices, books of business or niches sold by the Company or
terminated). Brown & Brown, Inc. CONSOLIDATED BALANCE SHEETS
(in thousands, except per share data) (unaudited) June 30, December
31, 2005 2004 ASSETS Current assets: Cash and cash equivalents
$42,940 $188,106 Restricted cash and investments 236,504 147,483
Short-term investments 2,831 3,163 Premiums, commissions and fees
receivable 217,209 172,395 Other current assets 24,280 28,819 Total
current assets 523,764 539,966 Fixed assets, net 38,489 33,438
Goodwill 523,610 360,843 Amortizable intangible assets, net 363,543
293,009 Investments 7,940 9,328 Other assets 10,090 12,933 Total
assets $1,467,436 $1,249,517 LIABILITIES AND SHAREHOLDERS' EQUITY
Current liabilities: Premiums payable to insurance companies
$370,431 $242,414 Premium deposits and credits due customers 24,002
32,273 Accounts payable 20,744 16,257 Accrued expenses 52,994
58,031 Current portion of long-term debt 49,699 16,135 Total
current liabilities 517,870 365,110 Long-term debt 220,246 227,063
Deferred income taxes, net 25,555 24,859 Other liabilities 9,078
8,160 Shareholders' equity: Common stock, par value $0.10 per
share; authorized 280,000 shares; issued and outstanding 69,143 at
2005 and 69,159 at 2004 6,914 6,916 Additional paid-in capital
189,371 187,280 Retained earnings 494,649 425,662 Accumulated other
comprehensive income 3,753 4,467 Total shareholders' equity 694,687
624,325 Total liabilities and shareholders' equity $1,467,436
$1,249,517 DATASOURCE: Brown & Brown, Inc. CONTACT: Cory T.
Walker, Chief Financial Officer of Brown & Brown, Inc.,
+1-386-239-7250 Web site: http://www.bbinsurance.com/
Copyright
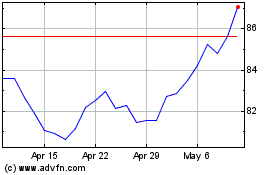
Brown and Brown (NYSE:BRO)
Historical Stock Chart
From May 2024 to Jun 2024

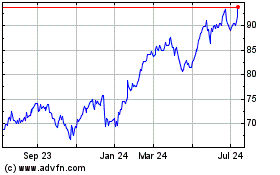
Brown and Brown (NYSE:BRO)
Historical Stock Chart
From Jun 2023 to Jun 2024
