Chubb Beats, Trims Outlook - Analyst Blog
October 21 2011 - 10:57AM
Zacks
Despite high cat losses from Hurricane Irene along with a slew
of other storms, the property and casualty insurer, Chubb
Corp. (CB) managed to report better than the Zacks
estimates.
The EPS of 88 cents for the third quarter was 6 cents ahead of
the Zacks Consensus estimate of 82 cents, led by higher premium
written, favorable reserve release and a lower share count.
Earnings however were very low compared to $1.69 per share in the
last year quarter, a period which was marked by benign cat
activity.
Combined ratio (a measure of insurer’s profitability, lower the
better), deteriorated to 102.6%, compared to 86.2% in the prior
year quarter. Adjusting for cat losses, combined ratio was 88.2% in
2011, compared with 84.1% last year.
Significant damage done by Hurricane Irene in the northeast
U.S., where Chubb has a substantial business exposure, along with a
slew of other storms, led to losses of $420 million, seven times
higher than $58 million recorded in the prior year quarter.
Property and casualty investment income after tax was up 1% year
over year to $321 million led by an increase in average invested
assets and a favorable effect of currency fluctuations, partially
offset by a decline in investment yield.
Management expects a flat property and casualty investment
income after taxes for FY11, due to a decline of about 3% in net
investment income in the fourth quarter which will be brought about
by a decrease in invested assets, as well as lower reinvestment
rates.
Adjusted book value per share, a measure of net worth, was
$51.11 compared to $49.05 at 2010 year end and $47.25 a year
ago.
Segment Update
At Chubb’s Commercial Insurance (CCI), net
written premiums climbed 9% year over year to $1.2 billion during
the reported quarter led by rate increase and strong retention
levels. The combined ratio was 101.1% versus 89.1% in the prior
year quarter. Excluding the 11.2% impact of catastrophes, the
segment’s second quarter combined ratio stood at 89.9%, worse than
87.1% last quarter.
Chubb's Specialty Insurance (CSI) net written
premiums inched down 1% year over year to $665 million led by lower
premium written in D&O lines, Surety lines partly offset by an
increase in business in professional liability lines. CSI's
combined ratio was 88.3% as against 83.3% in third quarter
2010.
Chubb’s Personal Insurance (CPI) net written
premiums grew 5% year over year to $1.0 billion. This represented
the seventh consecutive quarter of growth, with particularly strong
premium increases outside the U.S.
Reduced FY11 Outlook
Given the high level of catastrophe losses incurred in the third
quarter and management’s outlook for the fourth quarter, FY11
operating income per share guidance was pulled down to a range of
$5.10 to $5.20 from the previous range of $5.55 to $5.85.
Despite reduced profitability in the quarter, we hold a
favorable outlook on the company over the longer term. We respect
the company for its ability to maintain shareholders’ return by
deploying its excess capital for stock buybacks and dividend
payments in a weak market environment of the past several
years.
The recent record high catastrophe losses, low investment yields
and a prolonged soft property and casualty market are all set to
turn the underwriting cycle toward a hard insurance market. Any
such turn in the industrial cycle is going to greatly benefit the
high quality insurer, which boasts an industry leading specialty
franchise.
Property and Casualty industry conditions are affecting the
carriers alike. Chubb’s close competitor, The Travelers
Companies. (TRV) also reported third quarter earnings miss
on the back of high cat losses. We expect similar results from
other insurers such as XL Group Plc (XL),
The Allstate Corp. (ALL), W.R. Berkley
Corp. (WRB).
ALLSTATE CORP (ALL): Free Stock Analysis Report
CHUBB CORP (CB): Free Stock Analysis Report
TRAVELERS COS (TRV): Free Stock Analysis Report
BERKLEY (WR) CP (WRB): Free Stock Analysis Report
XL GROUP PLC (XL): Free Stock Analysis Report
Zacks Investment Research
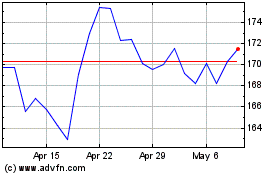
Allstate (NYSE:ALL)
Historical Stock Chart
From Jun 2024 to Jul 2024

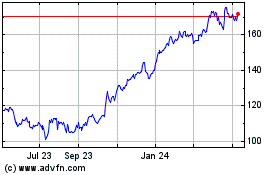
Allstate (NYSE:ALL)
Historical Stock Chart
From Jul 2023 to Jul 2024
