Revenues for the Year Up 39% to $22.3M; Q4 Revenues Up 30% YOY to
$6.6M TEL-AVIV, Israel, February 6 /PRNewswire-FirstCall/ -- RADCOM
Ltd. (RADCOM) (NASDAQ:RDCM) today announced financial results for
the fourth quarter and full year ended December 31, 2005. Financial
Results Revenues for the fourth quarter of 2005 were $6,578,000, an
increase of 30% compared to $5,078,000 for the fourth quarter of
2004, representing the Company's fourth consecutive quarter of 30%
or more year-over-year growth. Net income for the fourth quarter of
2005 was $798,000, or $0.05 per ordinary share (basic and diluted),
representing the Company's fourth consecutive profitable quarter.
This compared to a net loss of $243,000, or $0.02 per ordinary
share (basic and diluted) for the fourth quarter of 2004. Revenues
for the year ended December 31, 2005 increased by 39% to
$22,340,000 compared to $16,055,000 in 2004. Net income for 2005
was $1,527,000, or $0.10 per ordinary share (basic and diluted),
completing four profitable quarters for the year. This compared to
a net loss of $1,678,000, or $0.12 per ordinary share (basic and
diluted) recorded in 2004. Comments of Management Commenting on the
results, Arnon Toussia-Cohen, President and CEO of RADCOM, said,
"The fourth quarter was a strong end to a great year. After
returning to profitability in Q1 our momentum continued to build,
enabling us to deliver four straight profitable quarters with 39%
year-over-year revenue growth and positive cash flow. Taken as a
whole, we are growing faster than the telecom monitoring market,
reflecting the growing recognition by 3G and VoIP service providers
that RADCOM solutions are strategic for achieving profitable, high
quality services. "During the year, we focused on the U.S. sales
effort and succeeded in penetrating both Tier-1 and Tier 2 players.
We also stepped up our activities in China to position RADCOM to
benefit from its emerging 3G marketplace. In 2006, our focus will
be to expand on this base, build our European sales and capitalize
on our open-platform technology advantage through strategic
cooperations with many types of applications providers." The
following statement is forward-looking in nature, and actual
results may differ materially. See below under "Risks Regarding
Forward Looking Statements". Normal seasonality of the Company's
business usually results in a first quarter with revenues lower
than those of the preceding fourth quarter. However, the Company
projects that its revenues for the first quarter of 2006 will be
$6.3 million to $6.8 million. A teleconference to discuss the
results will be held today, February 6th, at 9:00 a.m. Eastern
Time. To participate, please call +1-888-428-4470 from the U.S., or
+1-612-332-0720 from international locations, approximately five
minutes before the call is scheduled to begin. A replay of the call
will be available from 11:00 AM Eastern Time on February 6th until
midnight February 20th. To access the replay, please call
+1-800-475-6701 from the U.S., or +1-320-365-3844 from
international locations, and use the access code 813009. The
conference call can also be accessed online at
http://www.radcom.com/. RADCOM develops, manufactures, markets and
supports innovative network test and service monitoring solutions
for communications service providers and equipment vendors. The
company specializes in Next Generation Cellular as well as Voice,
Data and Video over IP networks. Its solutions are used in the
development and installation of network equipment and in the
maintenance of operational networks. The company's products
facilitate fault management, network service performance monitoring
and analysis, troubleshooting and pre-mediation. For more
information, please visit http://www.radcom.com/. Risks Regarding
Forward Looking Statements Certain statements made herein that use
the words ``estimate', ``project', ``intend', ``expect", 'believe``
and similar expressions are intended to identify forward-looking
statements within the meaning of the Private Securities Litigation
Reform Act of 1995. These forward-looking statements involve known
and unknown risks and uncertainties which could cause the actual
results, performance or achievements of the Company to be
materially different from those which may be expressed or implied
by such statements, including, among others, changes in general
economic and business conditions and specifically, decline in
demand to the Company's products, inability to timely develop and
introduce new technologies, products and applications and loss of
market share and pressure on prices resulting from competition. For
additional information regarding these and other risks and
uncertainties associated with the Company's business, reference is
made to the Company's reports filed from time to time with the
Securities and Exchange Commission. The Company does not undertake
to update forward-looking statements. (Financial tables follow)
RADCOM REPORTS/3 RADCOM Ltd. Consolidated Statements of Operations
(1000's of U.S. dollars, except per share data) Three months ended
Twelve months ended December 31, December 31, 2005 2004 2005 2004
(audited) (unaudited) (unaudited) (unaudited) Sales 6,578 5,078
22,340 16,055 Cost of sales 2,197 1,612 7,398 5,127 Gross profit
4,381 3,466 14,942 10,928 Research and development, gross 1,525
1,376 5,815 5,232 Less - royalty- bearing participation 401 420
1,735 1,722 Research and development, net 1,124 956 4,080 3,510
Sales and marketing 2,081 1,884 7,881 6,983 General and
administrative 453 899 1,689 2,191 Total operating expense s 3,658
3,739 13,650 12,684 Operating income (loss) 723 (273) 1,292 (1,756)
Financing income, net 75 30 235 78 Net income (loss) 798 (243)
1,527 (1,678) Basic net income (loss) per ordinary share 0.05
(0.02) 0.10 (0.12) Diluted net income (loss) per ordinary share
0.05 (0.02) 0.10 (0.12) Weighted average number of ordinary shares
used in computing basic net income (loss) per ordinary share
14,879,074 14,417,980 14,696,090 13,453,509 Weighted average number
of ordinary shares used in computing diluted net income (loss) per
ordinary share 15,894,937 14,417,980 15,561,585 13,453,509
(Additional table to follow) RADCOM REPORTS/4 RADCOM Ltd.
Consolidated Balance Sheets (1000's of U.S. dollars) As of As of
December December 31, 2005 31, 2004 (unaudited) (unaudited) Current
Assets Cash and cash equivalents 10,520 6,558 Marketable securities
- 1,992 Trade receivables, net 7,856 5,341 Inventories 1,938 2,400
Other current assets 380 880 Total Current Assets 20,694 17,171
Assets held for severance benefits 1,863 1,784 Property and
equipment, net 1,233 1,174 Total Assets 23,790 20,129 Liabilities
and Shareholders' Equity Current Liabilities Trade payables 2,148
2,027 Current deferred revenue 1,545 889 Other payables and accrued
expenses 4,014 4,204 Total Current Liabilities 7,707 7,120
Long-Term Liabilities Long-term deferred revenue 1,161 583
Liability for employees' severance pay benefits 2,437 2,402 Total
Long-Term Liabilities 3,598 2,985 Total Liabilities 11,305 10,105
Shareholders' Equity Share capital 107 101 Additional paid-in
capital 44,613 43,698 Accumulated other comprehensive loss - (13)
Accumulated deficit (32,235) (33,762) Total Shareholders' Equity
12,485 10,024 Total Liabilities and Shareholders' Equity 23,790
20,129 Contact: David Zigdon CFO +972-3-6455004 DATASOURCE: RADCOM
LTD CONTACT: David Zigdon, CFO, Tel: +972-3-6455004,
Copyright
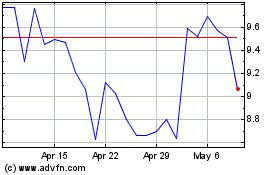
Radcom (NASDAQ:RDCM)
Historical Stock Chart
From Jun 2024 to Jul 2024

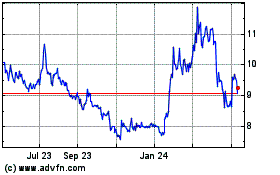
Radcom (NASDAQ:RDCM)
Historical Stock Chart
From Jul 2023 to Jul 2024
