Raises Annual Guidance to $114
Million
PCTEL, Inc. (NASDAQ:PCTI), a leader in simplifying wireless and
site solutions for private and public networks, announced its 2014
first quarter results.
First Quarter Highlights
- $23.7 million in revenue for the
quarter, a decrease of six percent from the same period last
year.
- Gross profit margin of 41 percent in
the quarter, compared to 38 percent in the same period last
year.
- GAAP operating margin from
continuing operations of negative two (2) percent for the
quarter, compared to operating margin of negative five (5)
percent for the same period last year.
- GAAP net loss from continuing
operations of $(146,000) for the quarter, or $(0.01) per diluted
share, compared to net income of $2.0 million from continuing
operations, or $0.11 per diluted share for the same period last
year. Net income for the first quarter last year included a
one-time gain from a legal settlement net of expenses of $0.11 per
diluted share.
- Non-GAAP operating profit and net
income are measures the company uses to reflect the results of its
core earnings. The Company’s reporting of Non-GAAP net income
excludes expenses for restructuring, gain or loss on sale of
assets, stock based compensation, amortization and impairment of
intangible assets and goodwill related to the Company’s
acquisitions, and non-cash related income tax expense.
- Non-GAAP operating margin from
continuing operations of five percent in the quarter, compared
to six percent in the same period last year.
- Non-GAAP net income from continuing
operations of $914,000 or $0.05 per diluted share in the
quarter, as compared to $1.2 million or $0.06 per diluted share
in the same period last year.
- $56.2 million of cash, short-term
investments at March 31, 2014, a decrease of approximately
$(1.7) million from the preceding quarter. During the quarter the
company used cash to pay $2.4 million in annual accrued expenses
from 2013 and $739,000 in dividends.
"Our in-building engineering services and scanning receiver
revenue continue to grow as does our Site Solutions product sales,”
said Marty Singer, PCTEL’s Chairman and CEO. “Core antenna sales
were soft for seasonal reasons but we expect a strong rebound this
quarter in that product area. That coupled with new business makes
us comfortable with the high end of our previous revenue guidance
of $112 - $114 million for our full year 2014. Finally, we had an
extremely active quarter with respect to new product releases that
will benefit the company this year,” added Singer.
CONFERENCE CALL / WEBCAST
PCTEL’s management team will discuss the Company’s results today
at 5:15 PM ET. The call can be accessed by dialing (877) 734-5369
(U.S. / Canada) or (706) 679-6397 (International), conference ID:
28238948. The call will also be webcast at
http://investor.pctel.com/events.cfm.
REPLAY: A replay will be available for two weeks after the call
on either the website listed above or by calling (855) 859-2056
(U.S./Canada), or International (404) 537-3406, conference ID:
28238948.
About PCTEL
PCTEL, Inc. (NASDAQ: PCTI), develops antenna, scanning receiver,
and engineered site solutions and services for public and private
networks. PCTEL RF Solutions enables superior utilization of
wireless spectrum for cellular and WiFi networks. The RF Solutions
services team specializes in the design, testing, and optimization
of in-building, small cell, and traditional wireless networks.
PCTEL RF Solutions develops and supports specialized network test
equipment for LTE FDD, TD-LTE, WCDMA, GSM, CDMA, EV-DO, TD-SCDMA,
and WiFi networks. The company's SeeGull® scanning receivers and
SeeHawk® visualization tool measure and analyze wireless signals
for efficient cellular network planning, deployment, and
optimization. Its IBflex™ simplifies in-building wireless network
testing and SeeWave™ identifies and locates interference sources
that impair network throughput.
PCTEL Connected Solutions™ simplifies network and site
deployment for wireless data and communications applications for
private and public networks, public safety, and government
customers. PCTEL Connected Solutions develops and delivers
high-value YAGI, Land Mobile Radio, WiFi, GPS, Subway, and
broadband antennas (parabolic and flat panel) through its MAXRAD®,
Bluewave™, and Wi-Sys™ product lines. PCTEL also sells specialized
towers, enclosures, and cable assemblies for custom engineered site
solutions. PCTEL delivers site solutions composed of PCTEL and
third party sourced material to allow customers to cost effectively
deploy and upgrade networks. The company's vertical markets include
SCADA, Health Care, Smart Grid, Positive Train Control, Precision
Agriculture, Indoor Wireless, Telemetry, Off-loading, and Wireless
Backhaul. PCTEL's products are sold worldwide through direct and
indirect channels. For more information, please visit the company's
web sites www.pctel.com, www.antenna.com, or
www.rfsolutions.pctel.com.
PCTEL Safe Harbor Statement
This press release contains “forward-looking statements” as
defined in the Private Securities Litigation Reform Act of 1995.
Specifically, the statements regarding the growth of PCTEL’s
in-building engineering services and scanning receiver sales, the
performance of the Connected Solutions business and the anticipated
success of our new antenna and scanning receiver products, are
forward-looking statements within the meaning of the safe harbor.
These statements are based on management’s current expectations and
actual results may differ materially from those projected as a
result of certain risks and uncertainties, including the ability to
successfully grow the wireless products business and the ability to
implement new technologies and obtain protection for the related
intellectual property. These and other risks and uncertainties are
detailed in PCTEL's Securities and Exchange Commission filings.
These forward-looking statements are made only as of the date
hereof, and PCTEL disclaims any obligation to update or revise the
information contained in any forward-looking statement, whether as
a result of new information, future events or otherwise.
PCTEL, INC. CONDENSED CONSOLIDATED BALANCE
SHEETS (in thousands, except share data)
(unaudited) March 31, December
31, 2014 2013 ASSETS Cash and cash
equivalents $16,475 $21,790 Short-term investment securities 39,694
36,105 Accounts receivable, net of allowance for doubtful accounts
of $120 and $130 at March 31, 2014 and December 31, 2013,
respectively 17,541 18,603 Inventories, net 15,961 14,535 Deferred
tax assets, net 1,629 1,629 Prepaid expenses and other assets 1,664
3,166 Total current assets 92,964 95,828 Property and
equipment, net 14,892 14,971 Goodwill 161 161 Intangible assets,
net 4,031 4,604 Deferred tax assets, net 11,915 11,827 Other
noncurrent assets 39 41
TOTAL ASSETS $124,002
$127,432 LIABILITIES AND STOCKHOLDERS’ EQUITY
Accounts payable $4,244 $4,440 Accrued liabilities 7,248
7,803 Total current liabilities 11,492 12,243 Other
long-term liabilities 1,226 3,137 Total liabilities
12,718 15,380 Stockholders’ equity: Common stock, $0.001 par
value, 100,000,000 shares authorized, 18,620,085 and 18,566,119
shares issued and outstanding at March 31, 2014 and December 31,
2013, respectively 19 19 Additional paid-in capital 143,742 143,572
Accumulated deficit (32,635) (31,748) Accumulated other
comprehensive income 158 209 Total stockholders’ equity of PCTEL,
Inc. 111,284 112,052
TOTAL LIABILITIES AND EQUITY
$124,002 $127,432
PCTEL, INC. CONDENSED CONSOLIDATED STATEMENTS OF
OPERATIONS (in thousands, except per share data)
(unaudited) Three Months Ended March 31,
2014 2013 REVENUES $23,656 $25,073
COST OF REVENUES 14,074 15,475
GROSS PROFIT 9,582
9,598
OPERATING EXPENSES: Research and development 3,242
2,550 Sales and marketing 2,956 3,020 General and administrative
3,232 4,632 Amortization of intangible assets 574 604 Restructuring
charges 0 101 Total operating expenses 10,004 10,907
OPERATING
LOSS (422) (1,309) Other income, net 197 4,332
INCOME (LOSS)
BEFORE INCOME TAXES (225) 3,023 Expense (benefit) for income
taxes (79) 1,070
NET INCOME (LOSS) FROM CONTINUING
OPERATIONS (146) 1,953
LOSS FROM DISCONTINUED OPERATIONS,
NET OF TAX BENEFIT 0 (88)
NET INCOME (LOSS) ($146)
$1,865
Earnings (Loss) per Share from Continuing
Operations: Basic ($0.01) $0.11 Diluted ($0.01) $0.11
Earnings (Loss) per Share from Discontinued Operations:
Basic $0.00 ($0.00) Diluted $0.00 ($0.01)
Earnings (Loss)
per Share: Basic ($0.01) $0.11 Diluted ($0.01) $0.10
Weighed Average Shares: Basic 18,176 17,684 Diluted 18,176
17,911 Cash dividend per share $0.040 $0.035
PCTEL, INC. P&L INFORMATION BY SEGMENT - Continuing
Operations (in thousands)
Three Months Ended March
31, 2014 Connected Solutions RF Solutions Consolidating Total
REVENUES $15,997 $7,722 ($63) $23,656
GROSS PROFIT 5,116 4,459 7 9,582
OPERATING INCOME (LOSS) $1,170 $1,014 ($2,606)
($422) Three Months Ended March 31, 2013 Connected
Solutions RF Solutions Consolidating Total
REVENUES
$19,356 $5,772 ($55) $25,073
GROSS
PROFIT 6,011 3,581 6 9,598
OPERATING INCOME (LOSS) $1,687 $1,042 ($4,038) ($1,309)
Reconciliation
GAAP To non-GAAP Results Of Continuing Operations
(unaudited)
(in thousands except per share information)
Reconciliation of
GAAP operating income to non-GAAP operating income (a) from
Continuing Operations
Three Months Ended March 31,
2014
2013
Operating Loss ($422) ($1,309) (a) Add: Amortization
of intangible assets 574 604 TelWorx restructuring: -Restructuring
charges 0 101 TelWorx investigation: -General & Administrative
235 1,391 Stock Compensation: -Cost of Goods Sold 86 85
-Engineering 173 145 -Sales & Marketing 147 106 -General &
Administrative 345 286 1,560 2,718 Non-GAAP Operating
Income $1,138 $1,409 % of revenue 4.8% 5.6%
Reconciliation of
GAAP net income to non-GAAP net income (b) from Continuing
Operations
Three Months Ended March 31,
2014
2013
Net Income (Loss) from Continuing Operations ($146) $1,953
Adjustments: (a) Non-GAAP adjustment to operating income
1,560 2,718 Other income related to the TelWorx settlement and
TelWorx SEC investigation (220) (4,330) (b) Income Taxes (280) 816
1,060 (796) Non-GAAP Net Income from Continuing
Operations $914 $1,157
Non-GAAP Earning per Share:
Basic $0.05 $0.07 Diluted $0.05 $0.06
Weighed Average
Shares: Basic 18,176 17,684 Diluted 18,379 17,911
This schedule reconciles the Company's
GAAP operating income and GAAP net income to its non-GAAP operating
income and non-GAAP net income. The Company believes that
presentation of this schedule provides meaningful supplemental
information to both management and investors that is indicative of
the Company's core operating results and facilitates comparison of
operating results across reporting periods. The Company uses these
non-GAAP measures when evaluating its financial results as well as
for internal planning and forecasting purposes. These non-GAAP
measures should not be viewed as a substitute for the Company's
GAAP results.
(a) These adjustments reflect stock based
compensation expense, amortization of intangible assets,
restructuring charges, and general and administrative expenses
associated with the TelWorx investigation.
(b) These adjustments include the items
described in footnote (a) as well as other income for the TelWorx
legal settlement and insurance claims related to the TelWorx
investigation, and non-cash income tax expense.
Reconciliation
GAAP To non-GAAP SEGMENT INFORMATION (unaudited) (a) - Continuing
Operations
(in thousands except per share information)
Three
Months Ended March 31, 2014 Connected Solutions RF Solutions
Consolidating Total
Operating Income (Loss)
$1,170 $1,014 ($2,606) ($422) Add: Amortization of
intangible assets 370 204 0 574 TelWorx investigation: -General
& Administrative 0 0 235 235 Stock Compensation: -Cost of Goods
Sold 45 40 0 85 -Engineering 80 93 0 173 -Sales & Marketing 128
19 0 147 -General & Administrative 87 30 229 346 710 386 464
1,560
Non-GAAP Operating Income
(Loss) $1,880 $1,400 ($2,142) $1,138 Three Months
Ended March 31, 2013 Connected Solutions RF Solutions Consolidating
Total
Operating Income (Loss) $1,687 $1,042
($4,038) ($1,309) Add: Amortization of intangible assets 394
210 0 604 Restructuring charges 101 0 0 101 TelWorx investigation:
-General & Administrative 0 0 1,391 1,391 Stock Compensation:
-Cost of Goods Sold 27 58 0 85 -Engineering 55 90 0 145 -Sales
& Marketing 78 28 0 106 -General & Administrative 66 15 205
286 721 401 1,596 2,718
Non-GAAP
Operating Income (Loss) $2,408 $1,443 ($2,442) $1,409
This schedule reconciles the Company's
GAAP operating income by segment to its non-GAAP operating income
and non-GAAP net income. The Company believes that presentation of
this schedule provides meaningful supplemental information to both
management and investors that is indicative of the Company's core
operating results and facilitates comparison of operating results
across reporting periods. The Company uses these non-GAAP measures
when evaluating its financial results as well as for internal
planning and forecasting purposes. These non-GAAP measures should
not be viewed as a substitute for the Company's GAAP results.
(a) These adjustments reflect stock based
compensation expense, amortization of intangible assets,
restructuring charges, and general and administrative expenses
associated with the TelWorx investigation.
PCTEL, Inc.John SchoenCFO(630) 372-6800orJack SellerPublic
Relations(630) 372-6800Jack.seller@pctel.com
PCTEL (NASDAQ:PCTI)
Historical Stock Chart
From Jan 2025 to Feb 2025

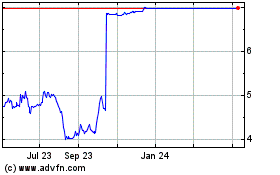
PCTEL (NASDAQ:PCTI)
Historical Stock Chart
From Feb 2024 to Feb 2025
