false 0001302028 0001302028 2024-08-07 2024-08-07
UNITED STATES
SECURITIES AND EXCHANGE COMMISSION
WASHINGTON, D.C. 20549
FORM 8-K
CURRENT REPORT
Pursuant to Section 13 or 15(d)
of the Securities Exchange Act of 1934
Date of report (Date of the earliest event reported) August 7, 2024
MANITEX INTERNATIONAL, INC.
(Exact Name of Registrant as Specified in Its Charter)
|
|
|
|
|
| Michigan |
|
001-32401 |
|
42-1628978 |
| (State or Other Jurisdiction of Incorporation) |
|
(Commission File Number) |
|
(IRS Employer Identification No.) |
9725 Industrial Drive, Bridgeview, Illinois 60455
(Address of Principal Executive Offices) (Zip Code)
(708) 430-7500
(Registrant’s Telephone Number, Including Area Code)
Check the appropriate box below if the Form 8-K filing is intended to simultaneously satisfy the filing obligation of the registrant under any of the following provisions:
| ☐ |
Written communications pursuant to Rule 425 under the Securities Act (17 CFR 230.425) |
| ☐ |
Soliciting material pursuant to Rule 14a-12 under the Exchange Act (17 CFR 240.14a-12) |
| ☐ |
Pre-commencement communications pursuant to Rule 14d-2(b) under the Exchange Act (17 CFR 240.14d-2(b)) |
| ☐ |
Pre-commencement communications pursuant to Rule 13e-4(c) under the Exchange Act (17 CFR 240.13e-4(c)) |
Indicate by check mark whether the registrant is an emerging growth company as defined in Rule 405 of the Securities Act of 1933 (§230.405 of this chapter) or Rule 12b-2 of the Securities Exchange Act of 1934 (§240.12b-2 of this chapter).
Emerging growth company ☐
If an emerging growth company, indicate by check mark if the registrant has elected not to use the extended transition period for complying with any new or revised financial accounting standards provided pursuant to Section 13(a) of the Exchange Act. ☐
Securities registered pursuant to Section 12(b) of the Act:
|
|
|
|
|
| Title of each class |
|
Trading Symbol(s) |
|
Name of each exchange on which registered |
| Common Stock, no par value |
|
MNTX |
|
The NASDAQ Stock Market LLC |
| Item 2.02 |
Results of Operations and Financial Condition. |
On August 7, 2024, Manitex International, Inc. (the “Company”) issued a press release announcing its unaudited financial results for the second quarter ended June 30, 2024 (the “Press Release”). The full text of the Press Release is being furnished as Exhibit 99.1 to this Current Report. The Company’s conference call and webcast will take place today August 7, 2024 at 9:00 am eastern time to discuss the second quarter 2024 results. The exhibit can be accessed from the Investor Relations section of the Company’s website at www.ManitexInternational.com.
The information in this Current Report (including Exhibit 99.1) is being furnished and shall not be deemed “filed” for the purposes of Section 18 of the Securities Exchange Act of 1934, as amended (the “Exchange Act”), or otherwise subject to the liabilities of that Section. The information in this Current Report shall not be incorporated by reference into any registration statement or other document pursuant to the Securities Act of 1933, as amended or the Exchange Act, except as shall be expressly set forth by specific reference in such filing.
The Company references certain non-GAAP financial measures. A reconciliation of these non-GAAP financial measures to the comparable GAAP financial measures is contained in the attached Press Release. Disclosures regarding definitions of these financial measures used by the Company and why the Company’s management believes these financial measures provide useful information to investors is also included in the Press Release.
| Item 9.01 |
Financial Statements and Exhibits. |
(a) Financial Statements of Businesses Acquired.
Not applicable.
(b) Pro Forma Financial Information.
Not applicable.
(c) Shell Company Transactions.
Not applicable.
(d) Exhibits.
SIGNATURE
Pursuant to the requirements of the Securities Exchange Act of 1934, the Company has duly caused this report to be signed on its behalf by the undersigned thereunder duly authorized.
|
|
|
| MANITEX INTERNATIONAL, INC. |
|
|
| By: |
|
/s/ Joseph Doolan |
| Name: |
|
Joseph Doolan |
| Title: |
|
Chief Financial Officer |
Date: August 7, 2024
Exhibit 99.1

MANITEX INTERNATIONAL REPORTS
SECOND QUARTER 2024 RESULTS
Bridgeview, IL, August 7, 2024 – Manitex International, Inc. (Nasdaq: MNTX) (“Manitex” or the “Company”), a
leading international provider of truck cranes, specialized industrial equipment, and construction equipment rental solutions to infrastructure and construction markets, today reported financial results for the three months ended June 30, 2024.
SECOND QUARTER 2024 RESULTS
(all
comparisons versus the prior year period unless otherwise noted)
| |
• |
|
Net revenue of $76.2 million, +3.7% |
| |
• |
|
Gross profit of $17.2 million, +14.9%; gross margin of 22.5%, +220 basis points |
| |
• |
|
Net Income of $1.5 million; Adjusted Net Income of $2.2 million, or $0.11 per diluted share
|
| |
• |
|
Adjusted EBITDA of $8.1 million, +19.0%; Adjusted EBITDA margin of 10.6%, +137 basis points
|
| |
• |
|
Net Debt decrease of $2.4 million from 1Q24; Net leverage of 2.5x as of June 30, 2024
|
| |
• |
|
Reiterated full-year 2024 adjusted EBITDA guidance; Adjusted full-year
2024 revenue guidance |
MANAGEMENT COMMENTARY
“Our second quarter results highlight our continued progress under our Elevating Excellence strategy, as we produced further margin
expansion, generated strong adjusted EBITDA growth, and reduced net leverage” stated Michael Coffey, Chief Executive Officer of Manitex. “Our second quarter performance was driven by strong growth in our rental operations, cost reductions
which are gaining momentum, and ongoing process improvements, resulting in nearly 20% year-over-year growth in adjusted EBITDA.”
“While we continue to see some apprehension from our dealers and customers, likely driven by the stubbornly high interest rates, macro
uncertainty, and upcoming elections, which is weighing on order patterns and our backlog, we remain confident in the long-term drivers of our business,” noted Coffey. “The need to invest in infrastructure, enhance the durability of the
electric grid, and mine critical materials to support the energy transition has not changed, and these factors will drive our business in the coming years. In the meantime, we will continue to focus on our commercial growth initiatives, and we made
important progress during the second quarter, including growing momentum in our dealer network expansion strategy and increased new product adoption.”
“The continued progress under our operational excellence initiatives was once again clearly evident during the second quarter based on
our 220 basis points of gross margin expansion,” continued Coffey. “During the second quarter, we made additional progress on our supply chain initiatives, resulting in lower materials costs, and further improved our manufacturing
velocity. These actions contributed to an adjusted EBITDA margin of 10.6% in the second quarter, an improvement of nearly 140 basis points from the prior-year period, despite some mixed headwinds.”
“We remain committed to our disciplined capital allocation strategy, with a near-term priority on reducing our debt levels and net
leverage,” stated Joseph Doolan, Chief Financial Officer of Manitex. “We finished
the second quarter with net debt of
$83.9 million, down over $2 million from the end of the first quarter, and our ratio of net debt to trailing twelve-month adjusted EBITDA was 2.5x, down from 2.9x at the end of 2023. At June 30, 2024 we had approximately $33 million
of cash and availability under our credit facilities, which provides us with ample financial flexibility to support our growth initiatives.”
“We are extremely proud of the progress we’ve made under Elevating Excellence, and we remain laser- focused on continuing to drive
critical change under this program in the coming years in an effort to drive shareholder value,” noted Coffey. “It is this disciplined focus on our strategic priorities that has enabled us to deliver strong adjusted EBITDA growth and
margin expansion during 2024, despite the slowing in order trends we have experienced in recent quarters. As a result of the recent order trends, we are lowering our full-year 2024 revenue guidance to a range of $290 million to
$300 million. However, we continue to expect our 2024 adjusted EBITDA to be in a range of $30 million to $34 million, demonstrating our strong execution against our operational excellence priorities.”
SECOND QUARTER 2024 PERFORMANCE
Manitex
reported net revenue of $76.2 million for the second quarter 2024, up 3.7% from net revenue of $73.5 million for the same period last year owing to growth in both the Lifting Equipment and Rental segments.
Lifting Equipment Segment revenue was $67.9 million during the second quarter 2024, an increase of 2.4%, versus the prior-year period.
The revenue increase was a result of the continued improvements in manufacturing velocity.
Rental Equipment Segment revenue was
$8.4 million in the second quarter 2024, an increase of 15.0% versus the prior year, driven by strong end-market demand and investments in rental fleet growth.
Total gross profit was $17.2 million in the second quarter, an increase of 14.9% from the prior-year period due to increased
manufacturing throughput, lower material costs driven by supply chain initiatives, and increased contribution from the Rental segment. As a result of these factors, gross profit margin increased 220 basis points to 22.5% during the second quarter
2024.
SG&A expense was $11.1 million for the second quarter, up modestly from $10.8 million for the comparable period last
year. R&D costs of $0.9 million were up modestly from $0.8 million from last year.
Operating income was $5.1 million
for the second quarter 2024, compared to $3.3 million for the same period last year. Second quarter operating margin was 6.7%, an improvement from 4.5% in the prior year period. The year-over-year improvement in operating income and operating
margin was driven by the improved gross margin performance.
The Company delivered net income of $1.5 million, or $0.07 per diluted
share, for the second quarter 2024, compared to a net income of $0.4 million, or $0.02 per diluted share, for the same period last year.
Adjusted EBITDA was $8.1 million for the second quarter 2024, or 10.6% of sales, up 19.0% from adjusted EBITDA of $6.8 million, or
9.3% of sales, for the same period last year. See Non-GAAP reconciliations in the appendix of this release.
As of June 30, 2024, total
backlog was $116 million, down from $170 million at the end of the fourth quarter 2023.
BALANCE SHEET AND LIQUIDITY
As of June 30, 2024, total debt was $89.2 million. Cash and cash equivalents as of June 30, 2024, were $5.3 million, resulting in net
debt of $83.9 million. Net leverage was 2.5x at the end of the second quarter 2024, down from 2.9x at the end of fourth quarter 2023. As of June 30, 2024, Manitex had total cash and availability of approximately $33 million.
2024 FINANCIAL GUIDANCE
The following
forward-looking guidance reflects the management’s current expectations and beliefs as of August 7, 2024, and is subject to change.
|
|
|
|
|
|
|
|
|
| |
|
Full-Year
2023 Actual |
|
Full-Year
2024 |
|
|
|
Prior Full-Year
2024 |
| Total Revenue ($MM) |
|
$291.4 |
|
$290 to $300 |
|
|
|
$300 to $310 |
| Total Adjusted EBITDA ($MM) |
|
$29.6 |
|
$30 to $34 |
|
|
|
$30 to $34 |
| Total Adjusted EBITDA Margin |
|
10.1% |
|
10.8%* |
|
|
|
10.5%* |
| * |
Assumes mid-point of the guidance range. |
SECOND QUARTER 2024 RESULTS CONFERENCE CALL
Manitex will host a conference call today at 9:00 AM ET to discuss the Company’s second quarter 2024 results.
A webcast of the conference call and accompanying presentation materials will be available in the Investor Relations section of the Manitex
website at
https://www.manitexinternational.com/eve
ntspresentations.aspx, and a replay of the webcast will be available at the same time shortly after the
webcast is complete.
To participate in the live teleconference:
|
|
|
|
|
| Domestic Live: |
|
(800) 717-1738 |
|
|
| International Live: |
|
(646) 307-1865 |
|
|
To listen to a replay of the teleconference, which will be available through August 21, 2024:
|
|
|
|
|
| Domestic Replay: |
|
(844) 512-2921 |
|
|
| International Replay: |
|
(412) 317-6671 |
|
|
| Passcode: |
|
1123676 |
|
|
NON-GAAP FINANCIAL MEASURES AND OTHER ITEMS
In this press release, we refer to various non-GAAP (U.S. generally accepted accounting principles) financial measures which management uses to
evaluate operating performance, to establish internal budgets and targets, and to compare the Company’s financial performance against such budgets and
targets. These non-GAAP measures, as defined by the Company, may not be comparable to similarly titled measures being disclosed by other companies. While adjusted financial measures are not intended to replace any presentation
included in our condensed consolidated financial statements under generally accepted accounting principles (GAAP) and should not be considered an alternative to operating performance or an alternative to cash flow as a measure of liquidity, we
believe these measures are useful to investors in assessing our operating results, capital expenditures and working capital requirements and the ongoing performance of its underlying businesses. A reconciliation of Adjusted GAAP financial measures
is included with this press release. All per share amounts are on a fully diluted basis. The quarterly amounts described below are unaudited, are reported in thousands of U.S. dollars, and are as of the dates indicated.
ABOUT MANITEX INTERNATIONAL
Manitex
International is a leading provider of mobile truck cranes, industrial lifting solutions, aerial work platforms, construction equipment and rental solutions that serve general construction, crane companies, and heavy industry. The company engineers
and manufactures its products in North America and Europe, distributing through independent dealers worldwide. Our brands include Manitex, PM, Oil & Steel, Valla, and Rabern Rentals.
FORWARD-LOOKING STATEMENTS
Safe Harbor
Statement under the U.S. Private Securities Litigation Reform Act of 1995: This release contains statements that are forward-looking in nature which express the beliefs and expectations of management including statements regarding the Company’s
expected results of operations or liquidity; statements concerning projections, predictions, expectations, estimates or forecasts as to our business, financial and operational results and future economic performance; and statements of
management’s goals and objectives and other similar expressions concerning matters that are not historical facts. In some cases, you can identify forward-looking statements by terminology such as “anticipate,” “estimate,”
“plan,” “project,” “continuing,” “ongoing,” “expect,” “we believe,” “we intend,” “may,” “will,” “should,” “could,” and similar expressions.
Such statements are based on current plans, estimates and expectations and involve a number of known and unknown risks, uncertainties and other factors that could cause the Company’s future results, performance or achievements to differ
significantly from the results, performance or achievements expressed or implied by such forward-looking statements. These factors and additional information are discussed in the Company’s filings with the Securities and Exchange Commission and
statements in this release should be evaluated in light of these important factors. Although we believe that these statements are based upon reasonable assumptions, we cannot guarantee future results. Forward-looking statements speak only as of the
date on which they are made, and the Company undertakes no obligation to update publicly or revise any forward-looking statement, whether as a result of new information, future developments or otherwise.
IR CONTACT
Paul Bartolai or Noel Ryan
MNTX@val-adv.com
MANITEX INTERNATIONAL, INC. AND SUBSIDIARIES
CONSOLIDATED BALANCE SHEETS
(In thousands,
except share and per share data)
(Unaudited)
|
|
|
|
|
|
|
|
|
| |
|
June 30, 2024 |
|
|
December 31, 2023 |
|
| ASSETS |
|
|
|
|
|
|
|
|
| Current assets |
|
|
|
|
|
|
|
|
| Cash |
|
$ |
5,097 |
|
|
$ |
9,269 |
|
| Cash – restricted |
|
|
206 |
|
|
|
212 |
|
| Trade receivables (net) |
|
|
51,695 |
|
|
|
49,118 |
|
| Other receivables |
|
|
1,715 |
|
|
|
553 |
|
| Inventory (net) |
|
|
82,268 |
|
|
|
82,337 |
|
| Prepaid expenses and other current assets |
|
|
3,659 |
|
|
|
4,084 |
|
|
|
|
|
|
|
|
|
|
| Total current assets |
|
|
144,640 |
|
|
|
145,573 |
|
|
|
|
|
|
|
|
|
|
| Total fixed assets, net of accumulated depreciation of $33,035 and $29,751 at June 30, 2024
and December 31, 2023, respectively |
|
|
52,194 |
|
|
|
49,560 |
|
| Operating lease assets |
|
|
7,832 |
|
|
|
7,416 |
|
| Intangible assets (net) |
|
|
10,511 |
|
|
|
12,225 |
|
| Goodwill |
|
|
36,854 |
|
|
|
37,354 |
|
| Deferred tax assets |
|
|
3,220 |
|
|
|
3,603 |
|
|
|
|
|
|
|
|
|
|
| Total assets |
|
$ |
255,251 |
|
|
$ |
255,731 |
|
|
|
|
|
|
|
|
|
|
| LIABILITIES AND EQUITY |
|
|
|
|
|
|
|
|
| Current liabilities |
|
|
|
|
|
|
|
|
| Accounts payable |
|
$ |
49,987 |
|
|
$ |
47,644 |
|
| Accrued expenses |
|
|
14,346 |
|
|
|
14,503 |
|
| Related party payables (net) |
|
|
548 |
|
|
|
27 |
|
| Revolving term credit facilities |
|
|
2,106 |
|
|
|
2,185 |
|
| Notes payable (net) |
|
|
21,153 |
|
|
|
23,343 |
|
| Current portion of finance lease obligations |
|
|
651 |
|
|
|
605 |
|
| Current portion of operating lease obligations |
|
|
2,210 |
|
|
|
2,100 |
|
| Customer deposits |
|
|
2,021 |
|
|
|
2,384 |
|
|
|
|
|
|
|
|
|
|
| Total current liabilities |
|
|
93,022 |
|
|
|
92,791 |
|
|
|
|
|
|
|
|
|
|
| Long-term liabilities |
|
|
|
|
|
|
|
|
| Revolving term credit facilities (net) |
|
|
48,817 |
|
|
|
49,781 |
|
| Notes payable (net) |
|
|
14,064 |
|
|
|
16,249 |
|
| Finance lease obligations (net of current portion) |
|
|
2,444 |
|
|
|
2,777 |
|
| Operating lease obligations (net of current portion) |
|
|
5,622 |
|
|
|
5,315 |
|
| Deferred tax liability |
|
|
4,719 |
|
|
|
4,145 |
|
| Other long-term liabilities |
|
|
3,334 |
|
|
|
4,989 |
|
|
|
|
|
|
|
|
|
|
| Total long-term liabilities |
|
|
79,000 |
|
|
|
83,256 |
|
|
|
|
|
|
|
|
|
|
| Total liabilities |
|
|
172,022 |
|
|
|
176,047 |
|
|
|
|
|
|
|
|
|
|
| Commitments and contingencies |
|
|
|
|
|
|
|
|
| Equity |
|
|
|
|
|
|
|
|
| Preferred stock—Authorized 150,000 shares, no shares issued or outstanding at June 30,
2024 and December 31, 2023 |
|
|
— |
|
|
|
— |
|
| Common stock—no par value 25,000,000 shares authorized, 20,390,299 and 20,258,194 shares
issued and outstanding at June 30, 2024 and December 31, 2023, respectively |
|
|
135,226 |
|
|
|
134,328 |
|
| Additional paid-in capital |
|
|
5,454 |
|
|
|
5,440 |
|
| Retained deficit |
|
|
(62,209 |
) |
|
|
(65,982 |
) |
| Accumulated other comprehensive loss |
|
|
(5,686 |
) |
|
|
(4,169 |
) |
|
|
|
|
|
|
|
|
|
| Equity attributable to shareholders of Manitex International |
|
|
72,785 |
|
|
|
69,617 |
|
| Equity attributed to noncontrolling interest |
|
|
10,444 |
|
|
|
10,067 |
|
|
|
|
|
|
|
|
|
|
| Total equity |
|
|
83,229 |
|
|
|
79,684 |
|
|
|
|
|
|
|
|
|
|
| Total liabilities and equity |
|
$ |
255,251 |
|
|
$ |
255,731 |
|
|
|
|
|
|
|
|
|
|
MANITEX INTERNATIONAL, INC.
CONSOLIDATED STATEMENTS OF OPERATIONS
(In thousands,
except for share and per share amounts)
(Unaudited)
|
|
|
|
|
|
|
|
|
|
|
|
|
|
|
|
|
| |
|
Three Months Ended
June 30, |
|
|
Six Months Ended
June 30, |
|
| |
|
2024 |
|
|
2023 |
|
|
2024 |
|
|
2023 |
|
| Net revenues |
|
$ |
76,235 |
|
|
$ |
73,534 |
|
|
$ |
149,578 |
|
|
$ |
141,405 |
|
| Cost of sales |
|
|
59,074 |
|
|
|
58,599 |
|
|
|
115,534 |
|
|
|
112,060 |
|
|
|
|
|
|
|
|
|
|
|
|
|
|
|
|
|
|
| Gross profit |
|
|
17,161 |
|
|
|
14,935 |
|
|
|
34,044 |
|
|
|
29,345 |
|
| Operating expenses |
|
|
|
|
|
|
|
|
|
|
|
|
|
|
|
|
| Research and development costs |
|
|
929 |
|
|
|
837 |
|
|
|
1,783 |
|
|
|
1,651 |
|
| Selling, general and administrative expenses |
|
|
11,125 |
|
|
|
10,766 |
|
|
|
22,244 |
|
|
|
21,797 |
|
|
|
|
|
|
|
|
|
|
|
|
|
|
|
|
|
|
| Total operating expenses |
|
|
12,054 |
|
|
|
11,603 |
|
|
|
24,027 |
|
|
|
23,448 |
|
|
|
|
|
|
|
|
|
|
|
|
|
|
|
|
|
|
| Operating income |
|
|
5,107 |
|
|
|
3,332 |
|
|
|
10,017 |
|
|
|
5,897 |
|
| Other income (expense) |
|
|
|
|
|
|
|
|
|
|
|
|
|
|
|
|
| Interest expense |
|
|
(1,931 |
) |
|
|
(1,896 |
) |
|
|
(3,803 |
) |
|
|
(3,661 |
) |
| Interest income |
|
|
91 |
|
|
|
— |
|
|
|
170 |
|
|
|
— |
|
| Foreign currency transaction loss |
|
|
(353 |
) |
|
|
(718 |
) |
|
|
(829 |
) |
|
|
(773 |
) |
| Other income (expense) |
|
|
(17 |
) |
|
|
21 |
|
|
|
17 |
|
|
|
(737 |
) |
|
|
|
|
|
|
|
|
|
|
|
|
|
|
|
|
|
| Total other expense |
|
|
(2,210 |
) |
|
|
(2,593 |
) |
|
|
(4,445 |
) |
|
|
(5,171 |
) |
|
|
|
|
|
|
|
|
|
|
|
|
|
|
|
|
|
| Income before income taxes |
|
|
2,897 |
|
|
|
739 |
|
|
|
5,572 |
|
|
|
726 |
|
| Income tax expense |
|
|
1,178 |
|
|
|
207 |
|
|
|
1,422 |
|
|
|
220 |
|
|
|
|
|
|
|
|
|
|
|
|
|
|
|
|
|
|
| Net income |
|
|
1,719 |
|
|
|
532 |
|
|
|
4,150 |
|
|
|
506 |
|
|
|
|
|
|
|
|
|
|
|
|
|
|
|
|
|
|
| Net income attributable to noncontrolling interest |
|
|
229 |
|
|
|
128 |
|
|
|
377 |
|
|
|
49 |
|
|
|
|
|
|
|
|
|
|
|
|
|
|
|
|
|
|
| Net income attributable to shareholders of Manitex International, Inc. |
|
$ |
1,490 |
|
|
$ |
404 |
|
|
$ |
3,773 |
|
|
$ |
457 |
|
|
|
|
|
|
|
|
|
|
|
|
|
|
|
|
|
|
| Income per share |
|
|
|
|
|
|
|
|
|
|
|
|
|
|
|
|
| Basic |
|
$ |
0.07 |
|
|
$ |
0.02 |
|
|
$ |
0.19 |
|
|
$ |
0.02 |
|
| Diluted |
|
$ |
0.07 |
|
|
$ |
0.02 |
|
|
$ |
0.19 |
|
|
$ |
0.02 |
|
| Weighted average common shares outstanding |
|
|
|
|
|
|
|
|
|
|
|
|
|
|
|
|
| Basic |
|
|
20,368,668 |
|
|
|
20,206,919 |
|
|
|
20,326,794 |
|
|
|
20,164,486 |
|
| Diluted |
|
|
20,392,756 |
|
|
|
20,209,959 |
|
|
|
20,378,199 |
|
|
|
20,166,968 |
|
Net Sales and Gross Margin
|
|
|
|
|
|
|
|
|
|
|
|
|
|
|
|
|
|
|
|
|
|
|
|
|
| |
|
Three Months Ended |
|
| |
|
June 30, 2024 |
|
|
March 31, 2024 |
|
|
June 30, 2023 |
|
| |
|
As
Reported |
|
|
As
Adjusted |
|
|
As
Reported |
|
|
As
Adjusted |
|
|
As
Reported |
|
|
As
Adjusted |
|
| Net sales |
|
$ |
76,235 |
|
|
$ |
76,235 |
|
|
$ |
73,343 |
|
|
$ |
73,343 |
|
|
$ |
73,534 |
|
|
$ |
73,534 |
|
| % change Vs Q1 2024 |
|
|
3.9 |
% |
|
|
3.9 |
% |
|
|
|
|
|
|
|
|
|
|
|
|
|
|
|
|
| % change Vs Q2 2023 |
|
|
3.7 |
% |
|
|
3.7 |
% |
|
|
|
|
|
|
|
|
|
|
|
|
|
|
|
|
|
|
|
|
|
|
|
| Gross margin |
|
|
17,161 |
|
|
|
17,161 |
|
|
|
16,883 |
|
|
|
16,883 |
|
|
|
14,935 |
|
|
|
14,935 |
|
| Gross margin % of net sales |
|
|
22.5 |
% |
|
|
22.5 |
% |
|
|
23.0 |
% |
|
|
23.0 |
% |
|
|
20.3 |
% |
|
|
20.3 |
% |
Backlog
|
|
|
|
|
|
|
|
|
|
|
|
|
|
|
|
|
|
|
|
|
| |
|
June 30, |
|
|
Mar 31, |
|
|
Dec 31, |
|
|
Sept 30, |
|
|
June 30, |
|
| |
|
2024 |
|
|
2024 |
|
|
2023 |
|
|
2023 |
|
|
2023 |
|
| Backlog from continuing operations |
|
|
115,811 |
|
|
|
154,182 |
|
|
|
170,286 |
|
|
|
196,872 |
|
|
|
223,236 |
|
| Change Versus Current Period |
|
|
|
|
|
|
(24.9 |
%) |
|
|
(32.0 |
%) |
|
|
(41.2 |
%) |
|
|
(48.1 |
%) |
Backlog is defined as orders for equipment which have not yet shipped as well as orders by foreign
subsidiaries for international deliveries. The disclosure of backlog aids in the analysis the Company’s customers’ demand for product, as well as the ability of the Company to meet that demand.
Backlog is not necessarily indicative of sales to be recognized in a specified future period.
Reconciliation of Net Income Attributable to Shareholders of Manitex International, Inc. to Adjusted Net Income
|
|
|
|
|
|
|
|
|
|
|
|
|
| |
|
Three Months Ended |
|
| |
|
June 30, 2024 |
|
|
March 31, 2024 |
|
|
June 30, 2023 |
|
| Net income attributable to shareholders of Manitex International, Inc. |
|
$ |
1,490 |
|
|
$ |
2,283 |
|
|
$ |
404 |
|
| Adjustments, including net tax impact |
|
|
713 |
|
|
|
1,127 |
|
|
|
1,307 |
|
| Adjusted net income attributable to shareholders of Manitex International, Inc. |
|
$ |
2,203 |
|
|
$ |
3,410 |
|
|
$ |
1,711 |
|
| Weighted diluted shares outstanding |
|
|
20,392,756 |
|
|
|
20,363,642 |
|
|
|
20,209,959 |
|
| Diluted earnings per share as reported |
|
$ |
0.07 |
|
|
$ |
0.11 |
|
|
$ |
0.02 |
|
| Total EPS effect |
|
$ |
0.04 |
|
|
$ |
0.06 |
|
|
$ |
0.06 |
|
| Adjusted diluted earnings per share |
|
$ |
0.11 |
|
|
$ |
0.17 |
|
|
$ |
0.08 |
|
Reconciliation of Net Income to Adjusted EBITDA
|
|
|
|
|
|
|
|
|
|
|
|
|
| |
|
Three Months Ended |
|
| |
|
June 30, 2024 |
|
|
March 31, 2024 |
|
|
June 30, 2023 |
|
| Net Income |
|
$ |
1,719 |
|
|
$ |
2,431 |
|
|
$ |
532 |
|
| Interest expense |
|
|
1,840 |
|
|
|
1,793 |
|
|
|
1,896 |
|
| Tax expense |
|
|
1,178 |
|
|
|
244 |
|
|
|
207 |
|
| Depreciation and amortization expense |
|
|
2,651 |
|
|
|
2,794 |
|
|
|
2,869 |
|
|
|
|
|
|
|
|
|
|
|
|
|
|
| EBITDA |
|
$ |
7,388 |
|
|
$ |
7,262 |
|
|
$ |
5,504 |
|
|
|
|
|
| Adjustments: |
|
|
|
|
|
|
|
|
|
|
|
|
| Stock compensation |
|
$ |
360 |
|
|
$ |
633 |
|
|
$ |
589 |
|
| FX |
|
|
353 |
|
|
|
476 |
|
|
|
718 |
|
| Severance / restructuring costs |
|
|
— |
|
|
|
(51 |
) |
|
|
— |
|
| Other |
|
|
— |
|
|
|
69 |
|
|
|
— |
|
|
|
|
|
|
|
|
|
|
|
|
|
|
| Total Adjustments |
|
$ |
713 |
|
|
$ |
1,127 |
|
|
$ |
1,307 |
|
|
|
|
|
|
|
|
|
|
|
|
|
|
| Adjusted EBITDA |
|
$ |
8,101 |
|
|
$ |
8,389 |
|
|
$ |
6,811 |
|
|
|
|
|
|
|
|
|
|
|
|
|
|
| Adjusted EBITDA as % of sales |
|
|
10.6 |
% |
|
|
11.4 |
% |
|
|
9.3 |
% |
Net Debt
|
|
|
|
|
|
|
|
|
|
|
|
|
| |
|
June 30, 2024 |
|
|
March 31, 2024 |
|
|
June 30, 2023 |
|
| Total cash & cash equivalents |
|
$ |
5,303 |
|
|
$ |
5,054 |
|
|
$ |
7,302 |
|
|
|
|
|
| Notes payable - short term |
|
$ |
21,153 |
|
|
$ |
22,658 |
|
|
$ |
23,857 |
|
| Current portion of finance leases |
|
|
651 |
|
|
|
632 |
|
|
|
555 |
|
| Notes payable - long term |
|
|
14,064 |
|
|
|
17,004 |
|
|
|
21,585 |
|
| Finance lease obligations - LT |
|
|
2,444 |
|
|
|
2,609 |
|
|
|
3,093 |
|
| Revolver, net |
|
|
50,923 |
|
|
|
48,531 |
|
|
|
45,982 |
|
|
|
|
|
|
|
|
|
|
|
|
|
|
| Total debt |
|
$ |
89,235 |
|
|
$ |
91,434 |
|
|
$ |
95,072 |
|
|
|
|
|
|
|
|
|
|
|
|
|
|
| Net debt |
|
$ |
83,932 |
|
|
$ |
86,380 |
|
|
$ |
87,770 |
|
|
|
|
|
|
|
|
|
|
|
|
|
|
Net debt is calculated using the Consolidated Balance Sheet amounts for current and long-term portion of
long-term debt, capital lease obligations, notes payable, and revolving credit facilities minus cash and cash equivalents.

Exhibit 99.2 Second Quarter 2024 Results Conference Call August 7, 2024
Safe Harbor Statement Safe Harbor Statement under the U.S. Private
Securities Litigation Reform Act of 1995: This presentation contains statements that are forward-looking in nature which express the beliefs and expectations of management including statements regarding the Company’s expected results of
operations or liquidity; statements concerning projections, predictions, expectations, estimates or forecasts as to our business, financial and operational results and future economic performance; and statements of management’s goals and
objectives and other similar expressions concerning matters that are not historical facts. In some cases, you can identify forward-looking statements by terminology such as “anticipate,” “estimate,” “plan,”
“project,” “continuing,” “ongoing,” “expect,” “we believe,” “we intend,” “may,” “will,” “should,” “could,” and similar
expressions. Such statements are based on current plans, estimates and expectations and involve a number of known and unknown risks, uncertainties and other factors that could cause the Company's future results, performance or achievements to differ
significantly from the results, performance or achievements expressed or implied by such forward-looking statements. These factors and additional information are discussed in the Company's filings with the Securities and Exchange Commission and
statements in this presentation should be evaluated in light of these important factors. Although we believe that these statements are based upon reasonable assumptions, we cannot guarantee future results. Forward-looking statements speak only as of
the date on which they are made, and the Company undertakes no obligation to update publicly or revise any forward-looking statement, whether as a result of new information, future developments or otherwise. 2 2
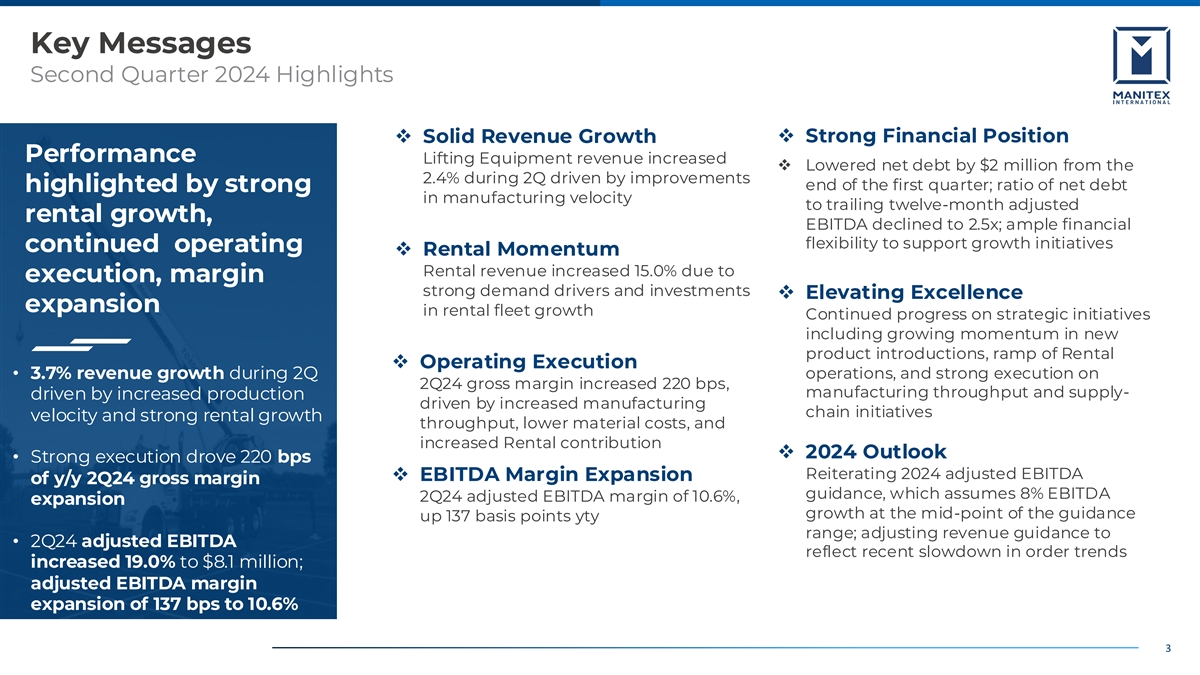
Key Messages Second Quarter 2024 Highlights ❖ Strong Financial
Position ❖ Solid Revenue Growth Performance Lifting Equipment revenue increased ❖ Lowered net debt by $2 million from the 2.4% during 2Q driven by improvements end of the first quarter; ratio of net debt highlighted by strong in
manufacturing velocity to trailing twelve-month adjusted rental growth, EBITDA declined to 2.5x; ample financial flexibility to support growth initiatives continued operating ❖ Rental Momentum Rental revenue increased 15.0% due to execution,
margin strong demand drivers and investments ❖ Elevating Excellence expansion in rental fleet growth Continued progress on strategic initiatives including growing momentum in new product introductions, ramp of Rental ❖ Operating
Execution • 3.7% revenue growth during 2Q operations, and strong execution on 2Q24 gross margin increased 220 bps, manufacturing throughput and supply- driven by increased production driven by increased manufacturing chain initiatives velocity
and strong rental growth throughput, lower material costs, and increased Rental contribution ❖ 2024 Outlook • Strong execution drove 220 bps Reiterating 2024 adjusted EBITDA ❖ EBITDA Margin Expansion of y/y 2Q24 gross margin
guidance, which assumes 8% EBITDA 2Q24 adjusted EBITDA margin of 10.6%, expansion growth at the mid-point of the guidance up 137 basis points yty range; adjusting revenue guidance to • 2Q24 adjusted EBITDA reflect recent slowdown in order
trends increased 19.0% to $8.1 million; adjusted EBITDA margin expansion of 137 bps to 10.6% 3
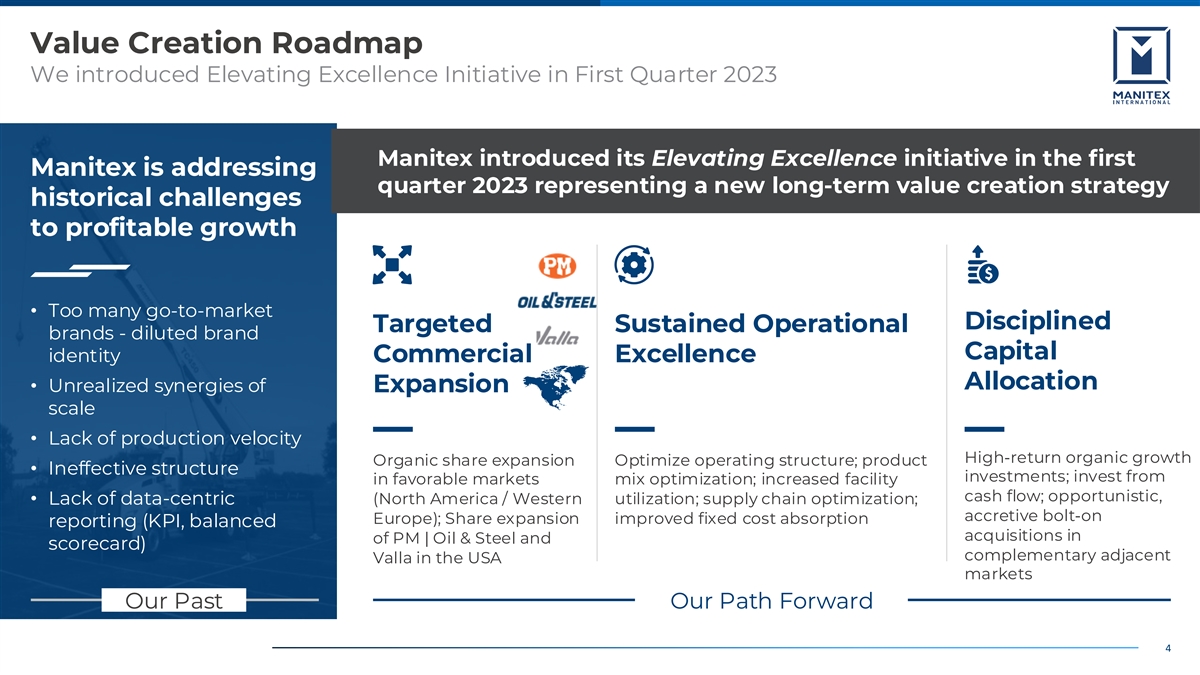
Value Creation Roadmap We introduced Elevating Excellence Initiative in
First Quarter 2023 Manitex introduced its Elevating Excellence initiative in the first Manitex is addressing quarter 2023 representing a new long-term value creation strategy historical challenges to profitable growth • Too many go-to-market
Disciplined Targeted Sustained Operational brands - diluted brand Capital identity Commercial Excellence Allocation • Unrealized synergies of Expansion scale • Lack of production velocity High-return organic growth Organic share
expansion Optimize operating structure; product • Ineffective structure investments; invest from in favorable markets mix optimization; increased facility cash flow; opportunistic, • Lack of data-centric (North America / Western
utilization; supply chain optimization; accretive bolt-on Europe); Share expansion improved fixed cost absorption reporting (KPI, balanced acquisitions in of PM | Oil & Steel and scorecard) complementary adjacent Valla in the USA markets Our
Past Our Path Forward 4
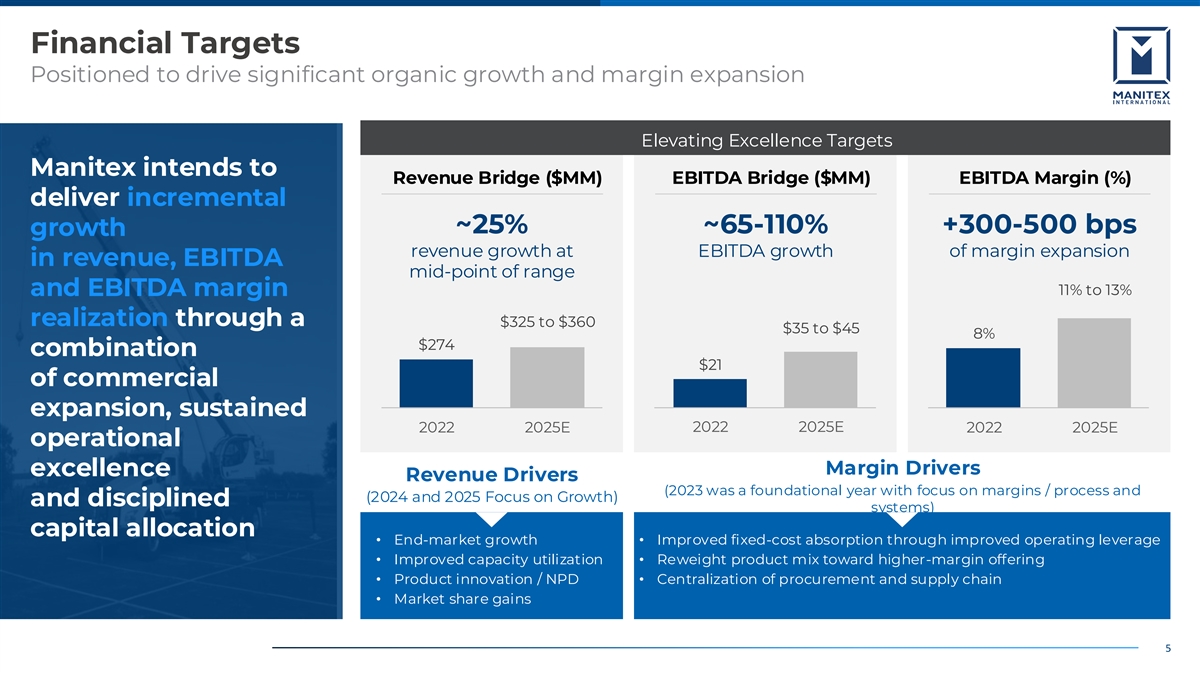
Financial Targets Positioned to drive significant organic growth and
margin expansion Elevating Excellence Targets Manitex intends to Revenue Bridge ($MM) EBITDA Bridge ($MM) EBITDA Margin (%) deliver incremental ~25% ~65-110% +300-500 bps growth revenue growth at EBITDA growth of margin expansion in revenue, EBITDA
mid-point of range 11% to 13% and EBITDA margin realization through a $325 to $360 $35 to $45 8% $274 combination $21 of commercial expansion, sustained 2022 2025E 2022 2025E 2022 2025E operational Margin Drivers excellence Revenue Drivers (2023 was
a foundational year with focus on margins / process and (2024 and 2025 Focus on Growth) and disciplined systems) capital allocation • End-market growth• Improved fixed-cost absorption through improved operating leverage • Improved
capacity utilization• Reweight product mix toward higher-margin offering • Product innovation / NPD• Centralization of procurement and supply chain • Market share gains 5
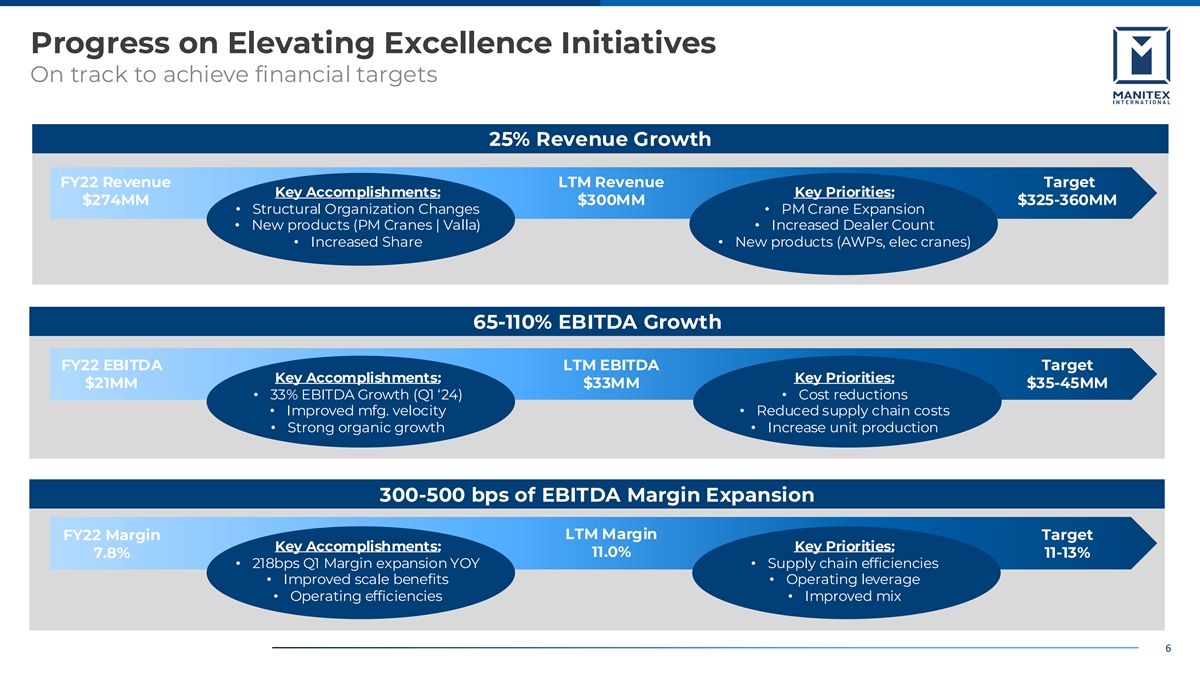
Progress on Elevating Excellence Initiatives On track to achieve
financial targets 25% Revenue Growth FY22 Revenue LTM Revenue Target Key Accomplishments: Key Priorities: $274MM $300MM $325-360MM • Structural Organization Changes• PM Crane Expansion • New products (PM Cranes | Valla)•
Increased Dealer Count • Increased Share• New products (AWPs, elec cranes) 65-110% EBITDA Growth FY22 EBITDA LTM EBITDA Target Key Accomplishments: Key Priorities: $21MM $33MM $35-45MM • 33% EBITDA Growth (Q1 ‘24)• Cost
reductions • Improved mfg. velocity• Reduced supply chain costs • Strong organic growth• Increase unit production 300-500 bps of EBITDA Margin Expansion LTM Margin FY22 Margin Target Key Accomplishments: Key Priorities: 11.0%
11-13% 7.8% • 218bps Q1 Margin expansion YOY• Supply chain efficiencies • Improved scale benefits• Operating leverage • Operating efficiencies• Improved mix 6
Second Quarter 2024 Results
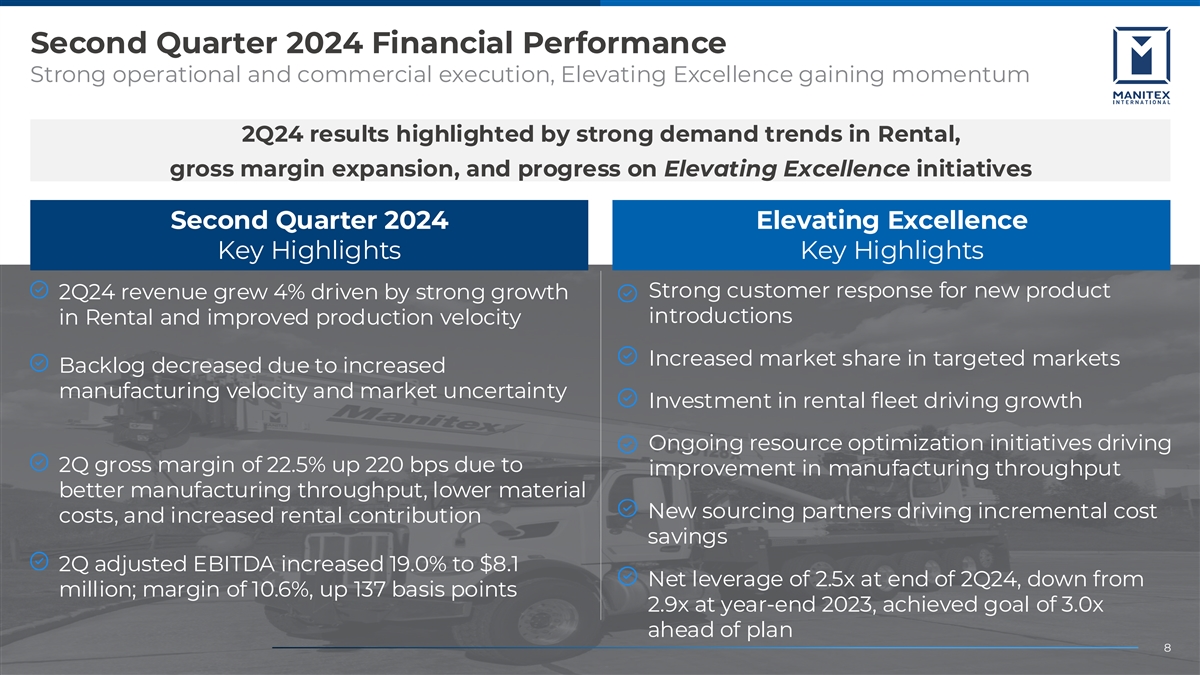
Second Quarter 2024 Financial Performance Strong operational and
commercial execution, Elevating Excellence gaining momentum 2Q24 results highlighted by strong demand trends in Rental, gross margin expansion, and progress on Elevating Excellence initiatives Second Quarter 2024 Elevating Excellence Key Highlights
Key Highlights Strong customer response for new product 2Q24 revenue grew 4% driven by strong growth introductions in Rental and improved production velocity Increased market share in targeted markets Backlog decreased due to increased manufacturing
velocity and market uncertainty Investment in rental fleet driving growth Ongoing resource optimization initiatives driving 2Q gross margin of 22.5% up 220 bps due to improvement in manufacturing throughput better manufacturing throughput, lower
material New sourcing partners driving incremental cost costs, and increased rental contribution savings 2Q adjusted EBITDA increased 19.0% to $8.1 Net leverage of 2.5x at end of 2Q24, down from million; margin of 10.6%, up 137 basis points 2.9x at
year-end 2023, achieved goal of 3.0x ahead of plan 8 8
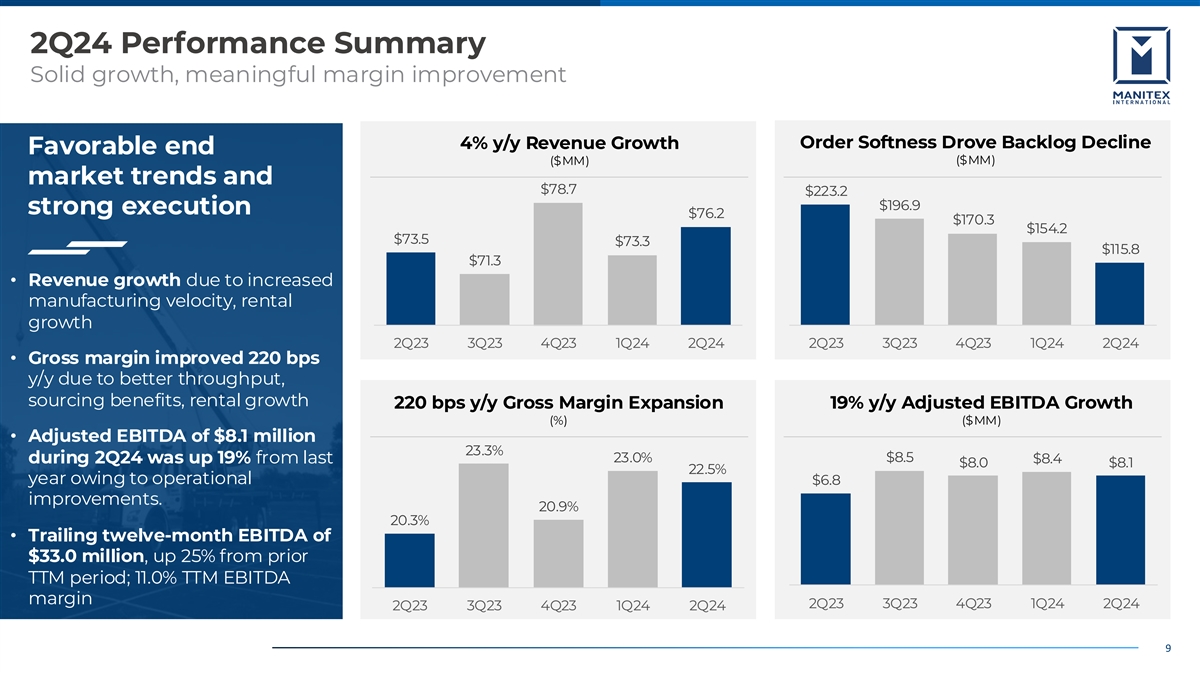
2Q24 Performance Summary Solid growth, meaningful margin improvement 4%
y/y Revenue Growth Order Softness Drove Backlog Decline Favorable end ($MM) ($MM) market trends and $78.7 $223.2 $196.9 strong execution $76.2 $170.3 $154.2 $73.5 $73.3 $115.8 $71.3 • Revenue growth due to increased manufacturing velocity,
rental growth 2Q23 3Q23 4Q23 1Q24 2Q24 2Q23 3Q23 4Q23 1Q24 2Q24 • Gross margin improved 220 bps y/y due to better throughput, sourcing benefits, rental growth 220 bps y/y Gross Margin Expansion 19% y/y Adjusted EBITDA Growth (%) ($MM) •
Adjusted EBITDA of $8.1 million 23.3% 23.0% $8.5 during 2Q24 was up 19% from last $8.4 $8.0 $8.1 22.5% year owing to operational $6.8 improvements. 20.9% 20.3% • Trailing twelve-month EBITDA of $33.0 million, up 25% from prior TTM period;
11.0% TTM EBITDA margin 2Q23 3Q23 4Q23 1Q24 2Q24 2Q23 3Q23 4Q23 1Q24 2Q24 9
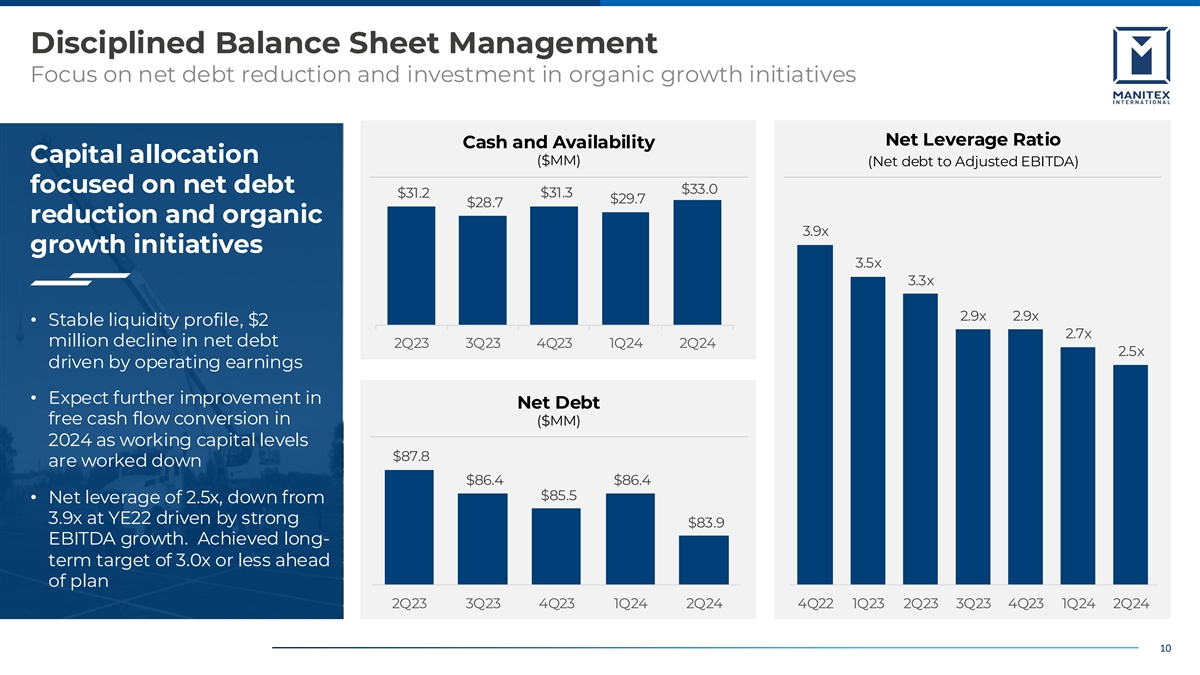
Disciplined Balance Sheet Management Focus on net debt reduction and
investment in organic growth initiatives Net Leverage Ratio Cash and Availability Capital allocation ($MM) (Net debt to Adjusted EBITDA) focused on net debt $33.0 $31.2 $31.3 $29.7 $28.7 reduction and organic 3.9x growth initiatives 3.5x 3.3x 2.9x
2.9x • Stable liquidity profile, $2 2.7x million decline in net debt 2Q23 3Q23 4Q23 1Q24 2Q24 2.5x driven by operating earnings • Expect further improvement in Net Debt free cash flow conversion in ($MM) 2024 as working capital levels
$87.8 are worked down $86.4 $86.4 $85.5 • Net leverage of 2.5x, down from 3.9x at YE22 driven by strong $83.9 EBITDA growth. Achieved long- term target of 3.0x or less ahead of plan 2Q23 3Q23 4Q23 1Q24 2Q24 4Q22 1Q23 2Q23 3Q23 4Q23 1Q24 2Q24
10
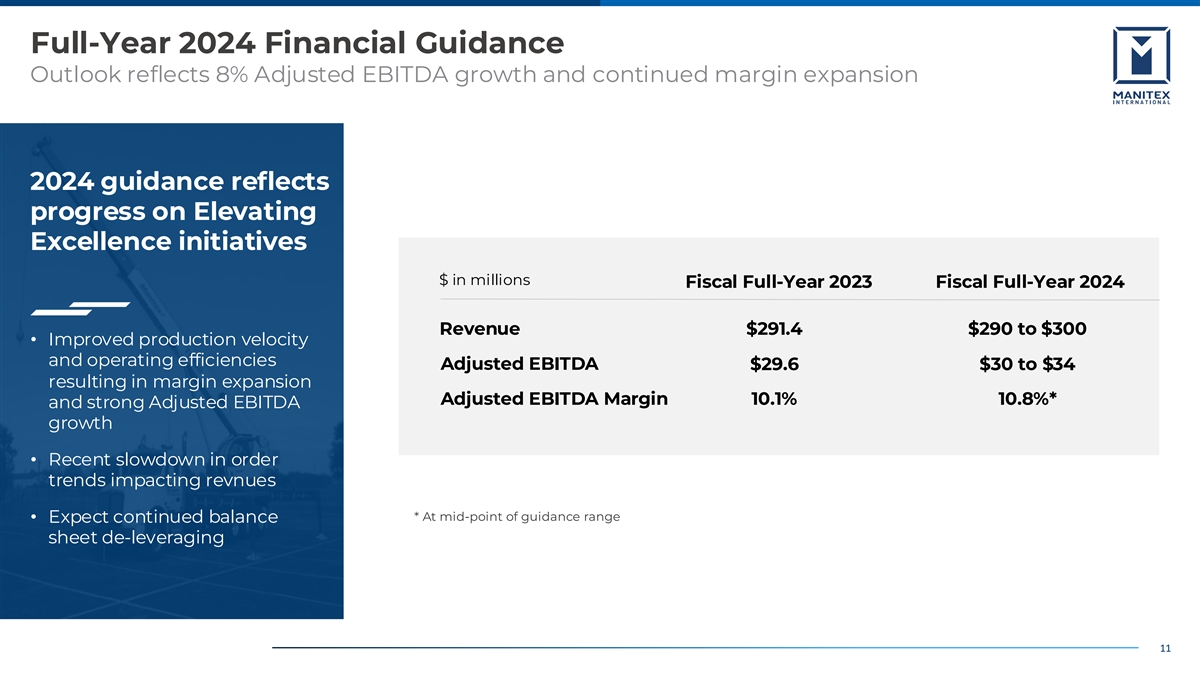
Full-Year 2024 Financial Guidance Outlook reflects 8% Adjusted EBITDA
growth and continued margin expansion 2024 guidance reflects progress on Elevating Excellence initiatives $ in millions Fiscal Full-Year 2023 Fiscal Full-Year 2024 Revenue $291.4 $290 to $300 • Improved production velocity and operating
efficiencies Adjusted EBITDA $29.6 $30 to $34 resulting in margin expansion Adjusted EBITDA Margin 10.1% 10.8%* and strong Adjusted EBITDA growth • Recent slowdown in order trends impacting revnues * At mid-point of guidance range •
Expect continued balance sheet de-leveraging 11
Appendix
Statement on Non-GAAP Financial Measures NON-GAAP FINANCIAL MEASURES
AND OTHER ITEMS In this presentation, we refer to various non-GAAP (U.S. generally accepted accounting principles) financial measures which management uses to evaluate operating performance, to establish internal budgets and targets, and to compare
the Company's financial performance against such budgets and targets. These non-GAAP measures, as defined by the Company, may not be comparable to similarly titled measures being disclosed by other companies. While adjusted financial measures are
not intended to replace any presentation included in our consolidated financial statements under generally accepted accounting principles (GAAP) and should not be considered an alternative to operating performance or an alternative to cash flow as a
measure of liquidity, we believe these measures are useful to investors in assessing our operating results, capital expenditure and working capital requirements and the ongoing performance of its underlying businesses. A reconciliation of Adjusted
GAAP financial measures is included with this presentation. All per share amounts are on a fully diluted basis. The quarterly amounts described below are unaudited, are reported in thousands of U.S. dollars, and are as of the dates indicated.
13
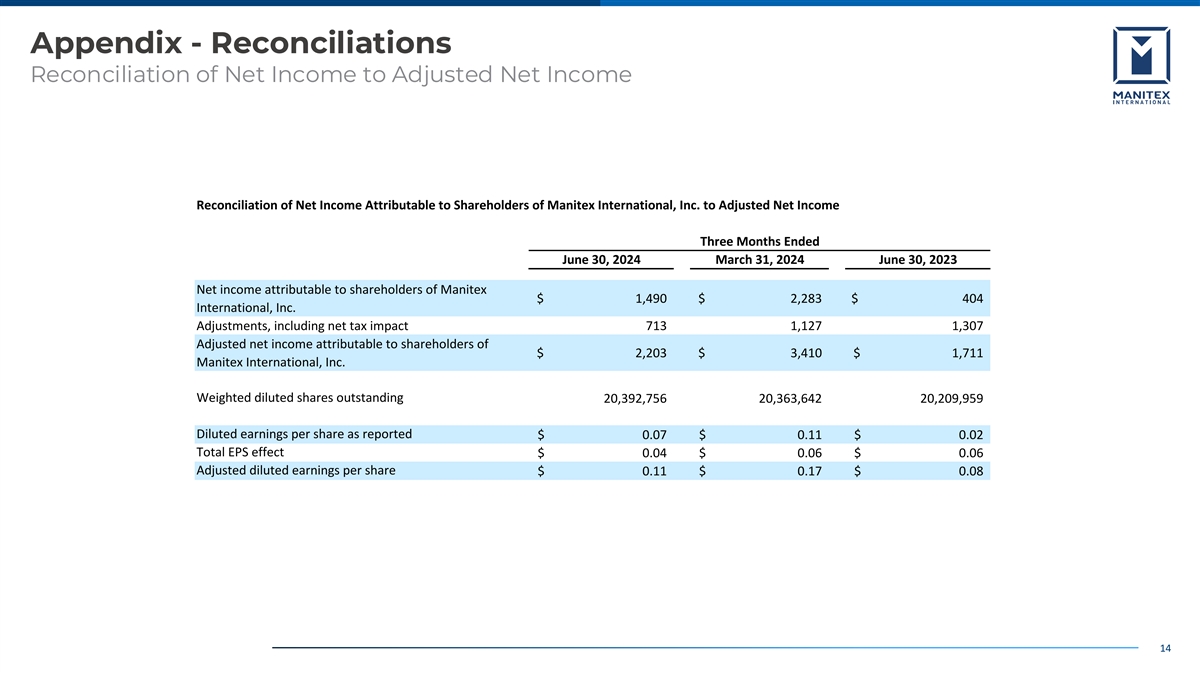
Appendix - Reconciliations Reconciliation of Net Income to Adjusted Net
Income Reconciliation of Net Income Attributable to Shareholders of Manitex International, Inc. to Adjusted Net Income Three Months Ended June 30, 2024 March 31, 2024 June 30, 2023 Net income attributable to shareholders of Manitex $ 1,490 $ 2,283 $
404 International, Inc. Adjustments, including net tax impact 713 1,127 1,307 Adjusted net income attributable to shareholders of $ 2 ,203 $ 3 ,410 $ 1,711 Manitex International, Inc. Weighted diluted shares outstanding 20,392,756 20,363,642
20,209,959 Diluted earnings per share as reported $ 0.07 $ 0 .11 $ 0.02 Total EPS effect $ 0.04 $ 0.06 $ 0 .06 Adjusted diluted earnings per share $ 0.11 $ 0 .17 $ 0 .08 14
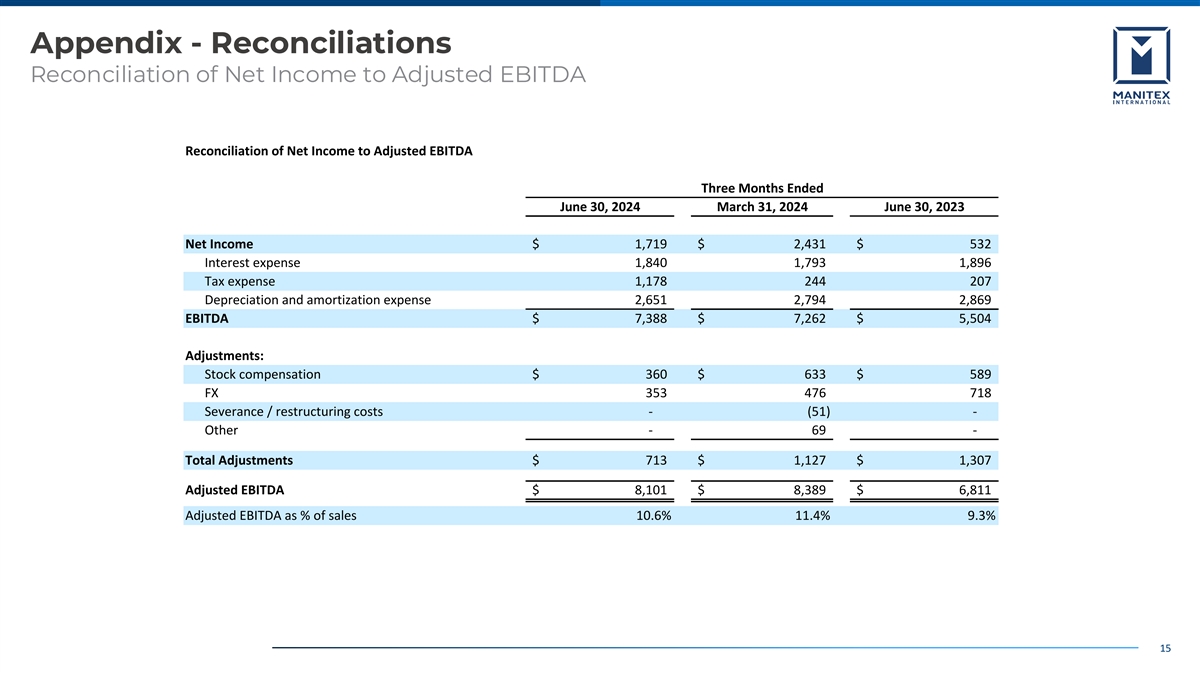
Appendix - Reconciliations Reconciliation of Net Income to Adjusted
EBITDA Reconciliation of Net Income to Adjusted EBITDA Three Months Ended June 30, 2024 March 31, 2024 June 30, 2023 Net Income $ 1,719 $ 2,431 $ 532 Interest expense 1,840 1,793 1,896 Tax expense 1,178 244 207 Depreciation and amortization expense
2,651 2,794 2,869 EBITDA $ 7,388 $ 7,262 $ 5,504 Adjustments: Stock compensation $ 360 $ 633 $ 589 FX 353 476 718 Severance / restructuring costs - (5 1) - Other - 69 - Total Adjustments $ 713 $ 1,127 $ 1,307 Adjusted EBITDA $ 8,101 $ 8,389 $ 6,811
Adjusted EBITDA as % of sales 10.6% 11.4% 9.3% 15
v3.24.2.u1
| X |
- DefinitionBoolean flag that is true when the XBRL content amends previously-filed or accepted submission.
| Name: |
dei_AmendmentFlag |
| Namespace Prefix: |
dei_ |
| Data Type: |
xbrli:booleanItemType |
| Balance Type: |
na |
| Period Type: |
duration |
|
| X |
- DefinitionFor the EDGAR submission types of Form 8-K: the date of the report, the date of the earliest event reported; for the EDGAR submission types of Form N-1A: the filing date; for all other submission types: the end of the reporting or transition period. The format of the date is YYYY-MM-DD.
| Name: |
dei_DocumentPeriodEndDate |
| Namespace Prefix: |
dei_ |
| Data Type: |
xbrli:dateItemType |
| Balance Type: |
na |
| Period Type: |
duration |
|
| X |
- DefinitionThe type of document being provided (such as 10-K, 10-Q, 485BPOS, etc). The document type is limited to the same value as the supporting SEC submission type, or the word 'Other'.
| Name: |
dei_DocumentType |
| Namespace Prefix: |
dei_ |
| Data Type: |
dei:submissionTypeItemType |
| Balance Type: |
na |
| Period Type: |
duration |
|
| X |
- DefinitionAddress Line 1 such as Attn, Building Name, Street Name
| Name: |
dei_EntityAddressAddressLine1 |
| Namespace Prefix: |
dei_ |
| Data Type: |
xbrli:normalizedStringItemType |
| Balance Type: |
na |
| Period Type: |
duration |
|
| X |
- Definition
+ References
+ Details
| Name: |
dei_EntityAddressCityOrTown |
| Namespace Prefix: |
dei_ |
| Data Type: |
xbrli:normalizedStringItemType |
| Balance Type: |
na |
| Period Type: |
duration |
|
| X |
- DefinitionCode for the postal or zip code
| Name: |
dei_EntityAddressPostalZipCode |
| Namespace Prefix: |
dei_ |
| Data Type: |
xbrli:normalizedStringItemType |
| Balance Type: |
na |
| Period Type: |
duration |
|
| X |
- DefinitionName of the state or province.
| Name: |
dei_EntityAddressStateOrProvince |
| Namespace Prefix: |
dei_ |
| Data Type: |
dei:stateOrProvinceItemType |
| Balance Type: |
na |
| Period Type: |
duration |
|
| X |
- DefinitionA unique 10-digit SEC-issued value to identify entities that have filed disclosures with the SEC. It is commonly abbreviated as CIK. Reference 1: http://www.xbrl.org/2003/role/presentationRef
-Publisher SEC
-Name Exchange Act
-Number 240
-Section 12
-Subsection b-2
| Name: |
dei_EntityCentralIndexKey |
| Namespace Prefix: |
dei_ |
| Data Type: |
dei:centralIndexKeyItemType |
| Balance Type: |
na |
| Period Type: |
duration |
|
| X |
- DefinitionIndicate if registrant meets the emerging growth company criteria. Reference 1: http://www.xbrl.org/2003/role/presentationRef
-Publisher SEC
-Name Exchange Act
-Number 240
-Section 12
-Subsection b-2
| Name: |
dei_EntityEmergingGrowthCompany |
| Namespace Prefix: |
dei_ |
| Data Type: |
xbrli:booleanItemType |
| Balance Type: |
na |
| Period Type: |
duration |
|
| X |
- DefinitionCommission file number. The field allows up to 17 characters. The prefix may contain 1-3 digits, the sequence number may contain 1-8 digits, the optional suffix may contain 1-4 characters, and the fields are separated with a hyphen.
| Name: |
dei_EntityFileNumber |
| Namespace Prefix: |
dei_ |
| Data Type: |
dei:fileNumberItemType |
| Balance Type: |
na |
| Period Type: |
duration |
|
| X |
- DefinitionTwo-character EDGAR code representing the state or country of incorporation.
| Name: |
dei_EntityIncorporationStateCountryCode |
| Namespace Prefix: |
dei_ |
| Data Type: |
dei:edgarStateCountryItemType |
| Balance Type: |
na |
| Period Type: |
duration |
|
| X |
- DefinitionThe exact name of the entity filing the report as specified in its charter, which is required by forms filed with the SEC. Reference 1: http://www.xbrl.org/2003/role/presentationRef
-Publisher SEC
-Name Exchange Act
-Number 240
-Section 12
-Subsection b-2
| Name: |
dei_EntityRegistrantName |
| Namespace Prefix: |
dei_ |
| Data Type: |
xbrli:normalizedStringItemType |
| Balance Type: |
na |
| Period Type: |
duration |
|
| X |
- DefinitionThe Tax Identification Number (TIN), also known as an Employer Identification Number (EIN), is a unique 9-digit value assigned by the IRS. Reference 1: http://www.xbrl.org/2003/role/presentationRef
-Publisher SEC
-Name Exchange Act
-Number 240
-Section 12
-Subsection b-2
| Name: |
dei_EntityTaxIdentificationNumber |
| Namespace Prefix: |
dei_ |
| Data Type: |
dei:employerIdItemType |
| Balance Type: |
na |
| Period Type: |
duration |
|
| X |
- DefinitionLocal phone number for entity.
| Name: |
dei_LocalPhoneNumber |
| Namespace Prefix: |
dei_ |
| Data Type: |
xbrli:normalizedStringItemType |
| Balance Type: |
na |
| Period Type: |
duration |
|
| X |
- DefinitionBoolean flag that is true when the Form 8-K filing is intended to satisfy the filing obligation of the registrant as pre-commencement communications pursuant to Rule 13e-4(c) under the Exchange Act. Reference 1: http://www.xbrl.org/2003/role/presentationRef
-Publisher SEC
-Name Exchange Act
-Number 240
-Section 13e
-Subsection 4c
| Name: |
dei_PreCommencementIssuerTenderOffer |
| Namespace Prefix: |
dei_ |
| Data Type: |
xbrli:booleanItemType |
| Balance Type: |
na |
| Period Type: |
duration |
|
| X |
- DefinitionBoolean flag that is true when the Form 8-K filing is intended to satisfy the filing obligation of the registrant as pre-commencement communications pursuant to Rule 14d-2(b) under the Exchange Act. Reference 1: http://www.xbrl.org/2003/role/presentationRef
-Publisher SEC
-Name Exchange Act
-Number 240
-Section 14d
-Subsection 2b
| Name: |
dei_PreCommencementTenderOffer |
| Namespace Prefix: |
dei_ |
| Data Type: |
xbrli:booleanItemType |
| Balance Type: |
na |
| Period Type: |
duration |
|
| X |
- DefinitionTitle of a 12(b) registered security. Reference 1: http://www.xbrl.org/2003/role/presentationRef
-Publisher SEC
-Name Exchange Act
-Number 240
-Section 12
-Subsection b
| Name: |
dei_Security12bTitle |
| Namespace Prefix: |
dei_ |
| Data Type: |
dei:securityTitleItemType |
| Balance Type: |
na |
| Period Type: |
duration |
|
| X |
- DefinitionName of the Exchange on which a security is registered. Reference 1: http://www.xbrl.org/2003/role/presentationRef
-Publisher SEC
-Name Exchange Act
-Number 240
-Section 12
-Subsection d1-1
| Name: |
dei_SecurityExchangeName |
| Namespace Prefix: |
dei_ |
| Data Type: |
dei:edgarExchangeCodeItemType |
| Balance Type: |
na |
| Period Type: |
duration |
|
| X |
- DefinitionBoolean flag that is true when the Form 8-K filing is intended to satisfy the filing obligation of the registrant as soliciting material pursuant to Rule 14a-12 under the Exchange Act. Reference 1: http://www.xbrl.org/2003/role/presentationRef
-Publisher SEC
-Name Exchange Act
-Section 14a
-Number 240
-Subsection 12
| Name: |
dei_SolicitingMaterial |
| Namespace Prefix: |
dei_ |
| Data Type: |
xbrli:booleanItemType |
| Balance Type: |
na |
| Period Type: |
duration |
|
| X |
- DefinitionTrading symbol of an instrument as listed on an exchange.
| Name: |
dei_TradingSymbol |
| Namespace Prefix: |
dei_ |
| Data Type: |
dei:tradingSymbolItemType |
| Balance Type: |
na |
| Period Type: |
duration |
|
| X |
- DefinitionBoolean flag that is true when the Form 8-K filing is intended to satisfy the filing obligation of the registrant as written communications pursuant to Rule 425 under the Securities Act. Reference 1: http://www.xbrl.org/2003/role/presentationRef
-Publisher SEC
-Name Securities Act
-Number 230
-Section 425
| Name: |
dei_WrittenCommunications |
| Namespace Prefix: |
dei_ |
| Data Type: |
xbrli:booleanItemType |
| Balance Type: |
na |
| Period Type: |
duration |
|
Manitex (NASDAQ:MNTX)
Historical Stock Chart
From Jul 2024 to Aug 2024

Manitex (NASDAQ:MNTX)
Historical Stock Chart
From Aug 2023 to Aug 2024
