- Second Quarter sales increase 24% to a record $502.5 million
CLEVELAND, July 25 /PRNewswire-FirstCall/ -- Lincoln Electric
Holdings, Inc. (NASDAQ:LECO) today reported that 2006
second-quarter net income increased 33% to $42.6 million, or 99
cents per diluted share, on record sales of $502.5 million, an
increase of 24%, 20% excluding the April 29, 2005 acquisition of
J.W. Harris. This compares with 2005 same-quarter net income of
$32.1 million, or 77 cents per diluted share, on net sales of
$405.9 million. Net income for the 2006 second quarter includes
charges of $1.3 million ($1.3 million after-tax, or 3 cents per
diluted share) related to European rationalization actions. Net
income for the 2005 second quarter includes a favorable tax benefit
of $1.8 million (5 cents per diluted share) related to a change in
Ohio tax law. "We had another excellent quarter," said John M.
Stropki, Chairman and Chief Executive Officer. "Our solid
performance reflects a strong global business environment and
effective execution from our management team and employees which
resulted in another record quarter for both sales and
profitability. In addition, we are pleased with the improved
operating leverage driven by significant increases in volume and
ongoing cost control. "Our growth continues to be broad-based and
we are focused on our core strategies of new product introductions
and geographical market expansion, customer service excellence and
cost control." Sales for the Company's North American operations
were $335.7 million in the quarter versus $265.4 million in the
comparable quarter last year, an increase of 27%, 22% excluding the
2005 acquisition of J.W. Harris. Export sales in the quarter
increased 62% to $39.6 million from $24.4 million last year. Sales
at Lincoln subsidiaries outside North America increased to $166.8
million in the second quarter, compared with $140.5 million in the
year-ago quarter. In local currencies, international subsidiaries'
sales increased 17%. Net income for the first half of 2006
increased 46% to $79.4 million, or $1.85 per diluted share. This
compares with net income of $54.4 million in the same period last
year, or $1.30 per diluted share. Net income for the first half of
2006 and 2005 includes charges of $2.3 million ($2.3 million
after-tax, or 6 cents per diluted share) and $1.3 million ($0.8
million after- tax, or 2 cents per diluted share), respectively,
related to European rationalization actions. In addition, net
income for the 2005 comparable period includes a favorable tax
benefit of $1.8 million (5 cents per diluted share) related to a
change in Ohio tax law. Sales in the first half of 2006 increased
26%, 20% excluding the 2005 acquisition of J.W. Harris, to $970.9
million from $768.8 million in the 2005 comparable period. The
Company's North American operations had sales of $655.9 million in
2006, compared with $496.9 million for the same period in 2005, an
increase of 32%, 23% excluding the 2005 acquisition of J.W. Harris.
Export sales increased 50% to $70.2 million, compared with $46.7
million in the comparable 2005 period. Lincoln operations outside
of North America had sales of $315.0 million, a 16% increase over
prior year sales of $271.9 million. In local currencies, sales for
the Company's non-U.S. operations increased 17%. Cash flow from
operations decreased 7% to $57.3 million for the first half of
2006, compared with $61.8 million in 2005. During 2006 the Company
paid $16.1 million in dividends. The Board of Directors also
declared a quarterly cash dividend of 19 cents, which was paid on
July 15, 2006 to holders of record as of June 30, 2006. Lincoln
Electric is the world leader in the design, development and
manufacture of arc welding products, robotic arc-welding systems,
plasma and oxyfuel cutting equipment and has a leading global
position in the brazing and soldering alloys market. Headquartered
in Cleveland, Ohio, Lincoln has 33 manufacturing locations,
including operations, manufacturing alliances and joint ventures in
19 countries and a worldwide network of distributors and sales
offices covering more than 160 countries. For more information
about Lincoln Electric, its products and services, visit the
Company's Web site at http://www.lincolnelectric.com/. The
Company's expectations and beliefs concerning the future contained
in this news release are forward-looking statements within the
meaning of the Private Securities Litigation Reform Act of 1995.
These statements reflect management's current expectations and
involve a number of risks and uncertainties. Actual results may
differ materially from such statements due to a variety of factors
that could adversely affect the Company's operating results. The
factors include, but are not limited to: the effectiveness of
operating initiatives; currency exchange and interest rates;
adverse outcome of pending or potential litigation; possible
acquisitions; market risks and price fluctuations related to the
purchase of commodities and energy; global regulatory complexity;
and the possible effects of international terrorism and hostilities
on the Company or its customers, suppliers and the economy in
general. A conference call to discuss 2006 second quarter financial
results is scheduled for today, Tuesday, July 25, 2006, at 11:00
a.m. ET. An audio webcast of the call is accessible through the
Investor page on the Company's Web site at
http://www.lincolnelectric.com/. Lincoln Electric Holdings, Inc.
Financial Highlights (amounts in thousands, except per share data)
(Unaudited) Consolidated Three Months Ended June 30, Change
Statements of Income % of % of 2006 Sales 2005 Sales $ % Net Sales
$502,510 100.0% $405,902 100.0% $96,608 23.8% Cost of Goods Sold
356,043 70.9% 291,951 71.9% 64,092 22.0% Gross Profit 146,467 29.1%
113,951 28.1% 32,516 28.5% SG&A Expenses 83,436 16.6% 71,919
17.7% 11,517 16.0% Rationalization Charges 1,292 0.2% - 0.0% 1,292
NA Operating Income 61,739 12.3% 42,032 10.4% 19,707 46.9% Interest
Income 1,400 0.3% 891 0.2% 509 57.1% Equity Earnings in Affiliates
2,160 0.4% 1,030 0.2% 1,130 109.7% Other Income 176 0.0% 995 0.2%
(819) (82.3%) Interest Expense (2,438) (0.5%) (2,186) (0.5%) (252)
11.5% Income Before Income Taxes 63,037 12.5% 42,762 10.5% 20,275
47.4% Income Taxes 20,418 4.0% 10,650 2.6% 9,768 91.7% Net Income
(1) $42,619 8.5% $32,112 7.9% $10,507 32.7% Basic Earnings Per
Share $1.00 $0.77 $0.23 29.9% Diluted Earnings Per Share $0.99
$0.77 $0.22 28.6% Weighted Average Shares (Basic) 42,514 41,477
Weighted Average Shares (Diluted) 43,008 41,845 (1) 2006 net income
includes charges related to European rationalization actions of
$1,292 ($1,292 after-tax). 2005 net income reflects a favorable tax
benefit of $1,807 related to a change in Ohio tax law. Lincoln
Electric Holdings, Inc. Financial Highlights (amounts in thousands,
except per share data) (Unaudited) Consolidated Six Months Ended
June 30, Change Statements of Income % of % of 2006 Sales 2005
Sales $ % Net Sales $970,904 100.0% $768,805 100.0% $202,099 26.3%
Cost of Goods Sold 694,371 71.5% 556,576 72.4% 137,795 24.8% Gross
Profit 276,533 28.5% 212,229 27.6% 64,304 30.3% SG&A Expenses
160,107 16.5% 138,821 18.0% 21,286 15.3% Rationalization Charges
2,341 0.2% 1,250 0.2% 1,091 87.3% Operating Income 114,085 11.8%
72,158 9.4% 41,927 58.1% Interest Income 2,594 0.2% 1,660 0.2% 934
56.3% Equity Earnings in Affiliates 2,524 0.2% 1,564 0.2% 960 61.4%
Other Income 549 0.1% 1,466 0.2% (917) (62.6%) Interest Expense
(4,839) (0.5%) (3,868) (0.5%) (971) 25.1% Income Before Income
Taxes 114,913 11.8% 72,980 9.5% 41,933 57.5% Income Taxes 35,545
3.6% 18,628 2.4% 16,917 90.8% Net Income (1) $79,368 8.2% $54,352
7.1% $25,016 46.0% Basic Earnings Per Share $1.87 $1.31 $0.56 42.7%
Diluted Earnings Per Share $1.85 $1.30 $0.55 42.3% Weighted Average
Shares (Basic) 42,397 41,577 Weighted Average Shares (Diluted)
42,874 41,966 (1) 2006 net income includes charges related to
European rationalization actions of $2,341 ($2,341 after-tax). 2005
net income includes charges related to European rationalization
actions of $1,250 ($848 after-tax) and a favorable tax benefit of
$1,807 related to a change in Ohio tax law. Lincoln Electric
Holdings, Inc. Financial Highlights (amounts in thousands, except
per share data) (Unaudited) Balance Sheet Highlights Selected
Consolidated Balance Sheet Data June 30, December 31, 2006 2005
Cash and Cash Equivalents $125,427 $108,007 Total Current Assets
821,118 676,634 Net Property, Plant and Equipment 354,385 340,533
Total Assets 1,323,808 1,161,161 Total Current Liabilities 404,709
293,642 Short-Term Debt 45,115 8,163 Long-Term Debt 111,940 157,853
Total Shareholders' Equity 743,822 652,294 Net Operating Working
Capital June 30, December 31, 2006 2005 Trade Accounts Receivable
$304,161 $242,093 Inventory 331,043 275,745 Trade Accounts Payable
152,754 121,917 Net Working Capital $482,450 $395,921 Average
Operating Working Capital % to Net Sales 31.3% 31.3% Invested
Capital June 30, December 31, 2006 2005 Short-Term Debt $45,115
$8,163 Long-Term Debt 111,940 157,853 Total Debt 157,055 166,016
Equity 743,822 652,294 Total $900,877 $818,310 Total
Debt/Capitalization 17.4% 20.3% Return on Invested Capital 19.3%
17.7% Lincoln Electric Holdings, Inc. Financial Highlights (amounts
in thousands, except per share data) (Unaudited) Consolidated Six
Months Ended June 30, Statements of Cash Flows 2006 2005 Operating
Activities: Net Income $79,368 $54,352 Adjustments to Reconcile Net
Income to Net Cash Provided by Operating Activities:
Rationalization Charges 2,341 1,250 Depreciation and Amortization
22,985 20,866 Equity Earnings of Affiliates, net (1,591) (1,564)
Other Non-Cash Items, net 2,478 2,663 Changes in Operating Assets
and Liabilities: Increase in Accounts Receivable (55,800) (22,539)
Increase in Inventories (49,428) (25,055) Increase in Accounts
Payable 27,824 15,575 Contributions to Pension Plans (16,397)
(21,466) Increase in Accrued Pensions 8,637 7,319 Net change in
Other Current Assets and Liabilities 38,740 32,606 Net change in
Other Long-Term Assets and Liabilities (1,827) (2,166) Net Cash
Provided by Operating Activities 57,330 61,841 1 Investing
Activities: Capital Expenditures (32,261) (21,435) Acquisitions of
businesses, net of cash acquired (95) (70,704) Proceeds from Sales
of Fixed Assets 641 846 Sales of Marketable Securities, net -
50,500 Net Cash Used by Investing Activities (31,715) (40,793)
Financing Activities: Net change in Borrowings (7,477) (11,009)
Proceeds from Exercise of Stock Options 8,952 7,592 Tax Benefit
from the Exercise of Stock Options 3,051 - Purchase of Shares for
Treasury - (12,804) Cash Dividends Paid to Shareholders (16,077)
(14,985) Net Cash Used by Financing Activities (11,551) (31,206)
Effect of Exchange Rate Changes on Cash and Cash Equivalents 3,356
(2,277) Increase in Cash and Cash Equivalents 17,420 (12,435) Cash
and Cash Equivalents at Beginning of Year 108,007 92,819 Cash and
Cash Equivalents at End of Period $125,427 $80,384 Cash Dividends
Paid Per Share $0.38 $0.36 DATASOURCE: Lincoln Electric Holdings,
Inc. CONTACT: Roy L. Morrow of Lincoln Electric Holdings, Inc.,
+1-216-383-4893, or Web site: http://www.lincolnelectric.com/
Copyright
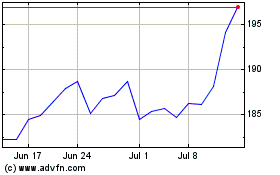
Lincoln Electric (NASDAQ:LECO)
Historical Stock Chart
From Jul 2024 to Jul 2024

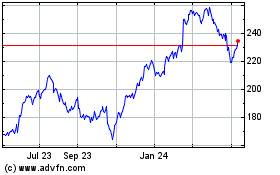
Lincoln Electric (NASDAQ:LECO)
Historical Stock Chart
From Jul 2023 to Jul 2024
