Lam Research Corporation (Nasdaq:LRCX) today announced earnings for
the quarter ended June 26, 2005. Revenue for the period was $353.8
million, and net income was $66.5 million, or $0.47 per diluted
share, compared to revenue of $349.3 million and net income of
$59.5 million, or $0.41 per diluted share, for the March 2005
quarter. Gross margin was $175.9 million and operating expenses
were $93.3 million for the June 2005 quarter compared to gross
margin of $174.6 million and operating expenses of $95.9 million
for the March 2005 quarter. The Company believes the presentation
of ongoing results, which excludes certain special items, is useful
for analyzing ongoing business trends. In the June 2005 quarter,
there were no significant differences between the ongoing results
and the results under U.S. Generally Accepted Accounting Principles
(GAAP). The March 2005 quarter ongoing presentation removed the
effects of a tax refund, which was recorded in selling, general and
administrative expenses as well as additional liabilities for
unoccupied facilities included in prior restructuring plans. Tables
presenting reconciliations of ongoing performance to results under
U.S. GAAP are included at the end of this press release and on the
Company's web site. Ongoing gross margin for the June 2005 quarter
was 49.7 percent of revenue compared to 50.0 percent of revenue in
the March 2005 quarter. In the period, ongoing operating expenses
increased as planned to $93.3 million from $89.7 million in March
2005, primarily due to accelerated R&D investments. Other
income increased due to higher interest income and foreign currency
gains. Ongoing net income increased to $66.5 million, or $0.47 per
diluted share, in the June 2005 quarter compared with ongoing net
income of $64.1 million, or $0.44 per diluted share, for the March
2005 quarter. New orders recorded in backlog remained flat
sequentially at $315 million. The geographic distribution of new
orders as well as revenue during the June quarter is shown in the
following table: -0- *T Region New Orders Revenue -------------
---------- ------- North America 9% 16% Europe 12% 17% Japan 28%
14% Korea 16% 21% Asia Pacific 35% 32% *T Cash, short-term
investments and restricted cash balances increased to $894.3
million at the end of June, and cash flows from operations were
$134 million during the quarter. Deferred revenue and deferred
profit balances were $150.5 million and $89.7 million,
respectively. At the end of the period, unshipped orders in backlog
were approximately $351 million, and the anticipated future revenue
value of orders shipped from backlog to Japanese customers that are
not recorded as deferred revenue was approximately $53 million. "We
are pleased with the results for this quarter," stated Steve
Newberry, president and chief executive officer for Lam. "We
continue to execute to our market share and profitability
objectives, despite what has remained a challenging industry
environment. "We have made significant strides during the June
quarter in advancing our position at leading-edge applications
among our global customer base. Customers are selecting Lam based
on our extensive production experience and our expertise with new
and more challenging integration processes. Our commitment to
providing superior products and services plays an important role in
our customers' continuous efforts to increase productivity and
yield on their leading-edge devices. "We delivered another quarter
marked by strong cash generation and market share success. I
commend the entire team here at Lam for delivering value for our
customers and shareholders," Newberry concluded. Statements made in
this press release which are not statements of historical fact are
forward-looking statements and are subject to the safe harbor
provisions created by the Private Securities Litigation Reform Act
of 1995. Such forward-looking statements relate, but are not
limited, to our future financial performance, our future plans for
products and services, our ability to execute to market share and
profitability objectives, and our future ability to develop and
produce leading-edge applications and expertise that meet our
customers' productivity and yield objectives. Some factors that may
affect these forward-looking statements include: changing business
conditions in the semiconductor industry and our plans for reacting
to those changes, changing customer demands, our competitors'
development of new technologies that could affect our market share,
the success of our research and development programs, and our
ability to develop and retain personnel with expertise needed for
our success and valued by our customers. These forward-looking
statements are based on current expectations and are subject to
uncertainties and changes in condition, significance, value and
effect as well as other risks detailed in documents filed with the
Securities and Exchange Commission, including specifically the
reports on Form 10-K for the year ended June 27, 2004, and the Form
10-Q for the quarter ended March 27, 2005, which could cause actual
results to vary from expectations. The Company undertakes no
obligation to update the information or statements made in this
press release. Lam Research Corporation is a major supplier of
wafer fabrication equipment and services to the world's
semiconductor industry. Lam's common stock trades on the Nasdaq
National Market under the symbol LRCX. The Company's World Wide Web
address is http://www.lamrc.com. Consolidated Financial Tables
Follow -0- *T LAM RESEARCH CORPORATION CONDENSED CONSOLIDATED
STATEMENTS OF OPERATIONS (in thousands, except per share data and
percentages) Three Months Ended Twelve Months Ended
----------------------------------- --------------------- June 26,
March 27, June 27, June 26, June 27, 2005 2005 2004 2005 2004
----------- ----------- ----------- ----------- ---------
(unaudited) (unaudited) (unaudited) (unaudited) (1) Total revenue
$353,767 $349,337 $329,572 $1,502,453 $935,946 Cost of goods sold
177,908 174,767 170,369 738,361 506,548 Cost of goods sold -
restruc- turing recoveries - - - - (1,651) ----------- -----------
----------- ----------- --------- Total cost of goods sold 177,908
174,767 170,369 738,361 504,897 Gross margin 175,859 174,570
159,203 764,092 431,049 Gross margin as a percent of revenue 49.7%
50.0% 48.3% 50.9% 46.1% Research and develop- ment 49,474 47,226
49,961 194,115 170,479 Selling, general and admini- strative 43,854
34,518 40,711 164,774 146,063 Restruc- turing charges, net - 14,201
- 14,201 8,327 ----------- ----------- ----------- -----------
--------- Total operat- ing expenses 93,328 95,945 90,672 373,090
324,869 Operating income 82,531 78,625 68,531 391,002 106,180 Other
income, net 6,171 643 1,676 8,120 4,470 ----------- -----------
----------- ----------- --------- Income before income taxes 88,702
79,268 70,207 399,122 110,650 Income tax expense 22,176 19,817
17,552 99,781 27,662 ----------- ----------- -----------
----------- --------- Net income $66,526 $59,451 $52,655 $299,341
$82,988 =========== =========== =========== =========== =========
Net income per share: Basic $0.48 $0.42 $0.39 $2.17 $0.63
=========== =========== =========== =========== =========
Diluted(2) $0.47 $0.41 $0.38 $2.10 $0.59 =========== ===========
=========== =========== ========= Number of shares used in per
share calcu- lations: Basic 138,208 139,967 134,414 137,727 131,776
=========== =========== =========== =========== =========
Diluted(2) 142,518 144,756 139,820 142,417 144,928 ===========
=========== =========== =========== ========= (1) Derived from
audited financial statements. (2) Diluted net income per share for
the twelve months ended June 27, 2004 includes the assumed
conversion of convertible 4% notes. Accordingly, interest expense,
net of taxes, of $3.2 million must be added back to net income for
computing diluted earnings per share. LAM RESEARCH CORPORATION
CONDENSED CONSOLIDATED BALANCE SHEETS (in thousands) June 26, March
27, June 27, 2005 2005 2004 (unaudited) (unaudited) (1) -----------
----------- ----------- Assets: Cash, cash equivalents and short-
term investments $809,253 $726,292 $429,472 Accounts receivable,
net 232,005 257,496 245,508 Inventories 110,051 120,353 108,249
Other current assets 93,527 79,739 113,159 ----------- -----------
----------- Total current assets 1,244,836 1,183,880 896,388
Property and equipment, net 41,082 43,167 42,444 Restricted cash
85,038 112,468 112,468 Other assets 77,859 143,506 147,326
----------- ----------- ----------- Total assets $1,448,815
$1,483,021 $1,198,626 =========== =========== ===========
Liabilities and stockholders' equity: Current liabilities $379,133
$375,352 $376,606 ----------- ----------- ----------- Other
long-term liabilities $2,786 $3,318 $9,554 Stockholders' equity
1,066,896 1,104,351 812,466 ----------- ----------- -----------
Total liabilities and stockholders' equity $1,448,815 $1,483,021
$1,198,626 =========== =========== =========== (1) Derived from
audited financial statements. Reconciliation of U.S. GAAP Net
Income to Ongoing Net Income (in thousands, except per share data
and percentages) Three Months Ended ----------------------------
June 26, March 27, 2005 2005 -------------- ------------- U.S. GAAP
net income $66,526 $59,451 Pre-tax net tax refund - operating
expenses - (7,962) Pre-tax net restructuring charges - operating
expenses - 14,201 Tax benefit on net restructuring charges and net
tax refund - (1,560) -------------- ------------- Ongoing net
income $66,526 $64,130 ============== ============= Ongoing net
income per diluted share $0.47 $0.44 ============== =============
Number of shares used for diluted per share calculation 142,518
144,756 Income tax rate 25% 25% Reconciliation of U.S. GAAP Gross
Margin, Operating Expenses and Operating Income to Ongoing Gross
Margin, Operating Expenses and Operating Income (in thousands)
Three Months Ended ---------------------------- June 26, March 27,
2005 2005 -------------- ------------- U.S. GAAP gross margin
$175,859 $174,570 Restructuring recoveries - cost of goods sold - -
-------------- ------------- Ongoing gross margin $175,859 $174,570
U.S. GAAP operating expenses $93,328 $95,945 Net tax refund -
operating expenses - 7,962 Net restructuring charges - operating
expenses - (14,201) -------------- ------------- Ongoing operating
expenses $93,328 $89,706 -------------- ------------- Ongoing
operating income $82,531 $84,864 ============== ============= *T
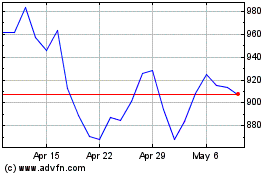
Lam Research (NASDAQ:LRCX)
Historical Stock Chart
From Jun 2024 to Jul 2024

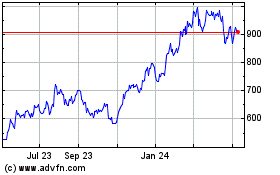
Lam Research (NASDAQ:LRCX)
Historical Stock Chart
From Jul 2023 to Jul 2024
