Berry Petroleum Company (NYSE:BRY) reported a net loss of $52.5
million, or $0.98 per diluted share, for the first quarter of 2011.
Oil and gas revenues were $187 million during the quarter and
discretionary cash flow totaled $85 million.
Net income for the quarter was impacted by a non-cash loss on
hedges and other items. In total, for the first quarter of 2011,
these items decreased net income by approximately $74.7 million, or
$1.35 per diluted share for an adjusted first quarter net income of
$22.2 million, or $0.41 per diluted share.
For the first quarter of 2011 and fourth quarter of 2010,
average net production in BOE per day was as follows:
First Quarter Ended Fourth Quarter
Ended March 31 December 31 2011
Production 2010 Production Oil (Bbls) 22,648
66 % 22,679 66 % Natural Gas (BOE)
11,757 34 %
11,805 34 % Total BOE per
day 34,405 100 % 34,484 100 %
Robert F. Heinemann, president and chief executive officer,
said, “During the first quarter, Berry executed on its 2011 capital
program drilling a total of 125 wells with two rigs in the
diatomite and four rigs in the Permian. We began injecting steam
into our new diatomite wells late during the first quarter and
field-wide production has begun to respond in line with our
expectations. We remain on track to reach 5,000 BOE/D by mid-year
2011. We have also entered into agreements to purchase
approximately 6,000 additional net acres in the Wolfberry for
approximately $123 million. This acquisition will increase our
total inventory to approximately 470 wells on 40-acre spacing after
this year. We now plan to run five rigs in the Permian for the
balance of the year and expect our 2011 capital will increase to
between $400 million and $450 million at current prices and expect
our total average production for 2011 to be between 37,500 BOE/D
and 39,500 BOE/D. Strong commodity prices and a narrow differential
to WTI in California contributed to an excellent operating margin
of $38 per BOE during the first quarter. Late in the first quarter,
California crude oil began to trade at a premium to WTI and this
premium is about $5 per barrel today. We should see the full impact
of this premium in our operating margins during the second
quarter.”
Operational Update
Michael Duginski, executive vice president and chief operating
officer, stated, “Berry drilled approximately 75 wells on our
diatomite property in the first quarter. In addition to injecting
steam in these new wells, we have reestablished continuous
operations and have increased steam injection throughout the field
to over 40,000 BSPD. Production and reservoir temperatures are
responding as expected. Current diatomite production is 3,000
BOE/D, up from an average of 2,250 BOE/D in the first quarter. We
have submitted documentation to the California Division of Oil, Gas
and Geothermal Resources and continue to expect approval of our
development project in the second quarter. In the Permian, we
drilled 14 wells during the quarter and results continue to be in
line with our expectations. Production in the Permian increased by
35% during the quarter and averaged approximately 3,000 BOE/D.”
Financial Update
David Wolf, executive vice president and chief financial
officer, stated, “We completed our credit facility borrowing base
redetermination in April and raised our borrowing base from $875
million to $1.4 billion. While we did not increase lender
commitments, the increased borrowing base gives us the flexibility
to increase our liquidity by adding commitments as needed in the
future. In addition to the increased borrowing base we reduced the
pricing on our facility to be in line with the current market,
extended the maturity by six months and added the flexibility to
refinance our 2016 notes. Liquidity under our credit facility at
the end of the first quarter was $633 million. Our per barrel
results for the first quarter were generally in line with guidance
with higher operating costs being impacted by a legal settlement
accrual and increased workover activity during the quarter and our
general and administrative expenses reflecting the impact of annual
compensation awards.”
2011 Guidance
For 2011 the Company is issuing the following per BOE
guidance:
Anticipated Three Months range in 2011 3/31/11
Operating costs-oil and gas production $ 16.50 - 18.50 $ 18.43
Production taxes 2.00 - 2.50 2.39 DD&A 16.00 - 18.00 16.83
G&A 3.75 - 4.25 5.26 Interest expense 5.25 – 6.25
5.06 Total $ 43.50 - 49.50 $ 47.97
Explanation and Reconciliation of
Non-GAAP Financial Measures
Discretionary Cash Flow ($
millions)
Three Months Ended 3/31/11 12/31/10 Net cash
provided by operating activities
$
100.4
$ 48.7 Add back: Net increase (decrease) in current assets 14.7 7.4
Add back: Net decrease (increase) in current liabilities including
book overdraft (30.2 ) 17.7 Add back: Unwind of interest rate swaps
- 10.8 Discretionary cash flow $ 84.9 $ 84.6
Reconciliation of First Quarter Net
Income ($ millions)
Three Months Ended 3/31/11 Adjusted net earnings $
22.2 After tax adjustments: Non-cash hedge losses (74.6 ) Legal
Settlement Accruals (0.7 ) Acquisition related items 0.6
Net loss, as reported $ (52.5 )
Reconciliation of First Quarter
Operating Margin Per BOE
Three Months Ended 3/31/11 Average Sales Price $
59.01 Operating costs 18.43 Production taxes
2.39 Operating Margin $ 38.19
Teleconference Call
An earnings conference call will be held Thursday, April 28,
2011 at 10:00 a.m. Eastern Time (8:00 a.m. Mountain Time). Dial
800-260-8140 to participate, using passcode 33881600. International
callers may dial 617-614-3672. For a digital replay available until
April 28, 2011 dial 888-286-8010 passcode 79887394. Listen live or
via replay on the web at www.bry.com.
About Berry Petroleum Company
Berry Petroleum Company is a publicly traded independent oil and
gas production and exploitation company with operations in
California, Colorado, Texas and Utah. The Company uses its web site
as a channel of distribution of material company information.
Financial and other material information regarding the Company is
routinely posted on and accessible at
http://www.bry.com/index.php?page=investor.
Safe harbor under the “Private Securities Litigation Reform
Act of 1995”
Any statements in this news release that are not historical
facts are forward-looking statements that involve risks and
uncertainties. Words such as “estimate,” “expect,” “would,” “will,”
“target,” “goal,” and forms of those words and others indicate
forward-looking statements. These statements include but are not
limited to forward-looking statements about acquisitions and the
expectations of plans, strategies, objectives and anticipated
financial and operating results of the Company, including the
Company’s drilling program, production, hedging activities, capital
expenditure levels and other guidance included in this press
release. These statements are based on certain assumptions made by
the Company based on management’s experience and perception of
historical trends, current conditions, anticipated future
developments and other factors believed to be appropriate. Such
statements are subject to a number of assumptions, risks and
uncertainties, many of which are beyond the control of the Company,
which may cause actual results to differ materially from those
implied or expressed by the forward-looking statements. Important
factors which could affect actual results are discussed in the
Company’s filings with the Securities and Exchange Commission,
including its Annual Report on Form 10-K under the headings “Risk
Factors” and “Management’s Discussion and Analysis of Financial
Condition and Results of Operations.”
CONDENSED INCOME STATEMENTS (In thousands, except per
share data) (unaudited)
Three Months
3/31/11 12/31/10 Revenues
Sales of oil and gas
$ 187,389 $ 168,605 Sales of
electricity
6,412 7,427 Gas marketing
3,685 3,968
Interest and other, net
128
980 Total
197,614 180,980
Expenses Operating costs – oil & gas
57,083
49,949 Operating costs – electricity
6,113 6,566 Production
taxes
7,391 6,515 Depreciation, depletion & amortization
- oil & gas
52,109 50,456 Depreciation, depletion &
amortization - electricity
501 818 Gas marketing
3,516 3,687 General and administrative
16,291 14,457
Realized and unrealized loss on derivatives, net
127,516
62,330 Interest
15,655 17,168 Extinguishment of debt
- 572 Bargain purchase gain
(1,046 ) - Dry
hole, abandonment, impairment & exploration
113 89 Total
285,242
212,607 Earnings (loss) before income
taxes
(87,628 ) (31,627 ) Income tax (benefit)
provision
(35,131 )
(10,481 ) Net (loss)
earnings
$ (52,497
) $ (21,146
) Basic (loss) earnings per share
$ (0.98
) $ (0.40
) Diluted (loss) earnings per share
$ (0.98
) $ (0.40
) Cash dividends per share
$
0.075 $ 0.075
CONDENSED BALANCE SHEETS
(In thousands) (unaudited)
3/31/11
12/31/10 Assets Current assets
$
189,258 $ 142,866 Property, buildings & equipment, net
2,725,567 2,655,792 Derivative instruments
1,562
2,054 Other assets
35,742
37,904 $
2,952,129 $ 2,838,616
Liabilities & Shareholders’ Equity Current liabilities
$
339,357 $ 270,651 Deferred income taxes
322,990
329,207 Long-term debt
1,144,624 1,108,965 Derivative
instruments
87,035 33,526 Other long-term liabilities
73,751 71,714 Shareholders’ equity
984,372 1,024,553
$ 2,952,129 $
2,838,616 CONDENSED STATEMENTS OF
CASH FLOWS (In thousands) (unaudited)
Three
Months 3/31/11
12/31/10 Cash flows from operating activities: Net
(loss) earnings
$ (52,497 ) $ (21,146 )
Depreciation, depletion & amortization (DD&A)
52,610
51,274 Gain on purchase of oil and natural gas properties
(1,047 ) - Extinguishment of debt
- 572
Amortization of debt issuance costs and net discount
2,099
2098 Dry hole & impairment
- 1 Unrealized loss on
derivatives
124,459 51,609 Stock-based compensation
3,052 2,252 Deferred income taxes
(44,321 )
(12,834 ) Other, net
680 (12 ) Cash paid for abandonment
(103 ) (2 ) Change in book overdraft
4,736
(7,781 ) Net changes in operating assets and liabilities
10,766 (17,314
) Net cash provided by operating activities
100,434 48,717 Cash flows from investing activities
Capital Expenditures
(130,672 ) (79,184 ) Property
acquisitions
(2,413 ) (179,892 ) Capitalized Interest
(10,392 )
(7,919 ) Net cash used in investing
activities
(143,477 ) (266,995 ) Net cash
provided by financing activities
42,845
218,502 Net increase
(decrease) in cash and cash equivalents
(198 ) 224
Cash and cash equivalents at beg of year
278 54 Cash
and cash equivalents at end of period
$
80 $ 278
COMPARATIVE OPERATING STATISTICS
(unaudited)
Three Months
3/31/11 12/31/10
Change Oil and gas: Heavy Oil Production
(Bbl/D)
16,226 16,548 Light Oil Production (Bbl/D)
6,422 6,131
Total Oil Production (Bbl/D)
22,648 22,679 Natural Gas
Production (Mcf/D)
70,542
70,828 Total (BOE/D)
34,405 34,484
Per BOE: Average realized sales price
$ 60.26
$ 53.55 13 % Average sales price including cash derivative
settlements
$ 59.01 $ 53.75 10 % Oil, per Bbl:
Average WTI price
$ 94.60 $ 85.20 11 % Price
sensitive royalties
(3.57 ) (3.37 ) Gravity
differential and other
(5.68 ) (9.16 ) Crude oil
derivatives non cash amortization
(7.06
) (3.22 ) Oil
revenue
78.29 69.45 13 % Add: Crude oil derivatives non cash
amortization
7.06 3.22 Crude Oil derivative cash settlements
(10.24 )
(4.35 ) Average realized oil price
$ 75.11 $ 68.32 10 % Natural gas price:
Average Henry Hub price per MMBtu
$ 4.11 $ 3.80 8 %
Conversion to Mcf
0.21 0.19 Natural gas derivatives non cash
amortization
(0.01 ) 0.05 Location, quality
differentials and other
(0.09
) (0.14 )
Natural gas revenue per Mcf
4.22 3.90 8 % Less: Natural gas
derivatives non cash amortization
0.01 (0.05 ) Natural gas
derivative cash settlements
0.41
0.50 Average realized natural gas price
per Mcf
4.64 4.35 7 % Operating costs
$
18.43 $ 15.73 17 % Production taxes
2.39 2.05 17
% Total operating costs
20.82 17.78 17 % DD&A -
oil and gas
16.83 15.89 6 % General & administrative
expenses
5.26 4.55 16 % Interest expense
$
5.06 $ 5.41 -6 %
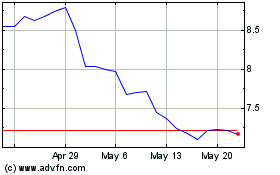
Berry (NASDAQ:BRY)
Historical Stock Chart
From May 2024 to Jun 2024

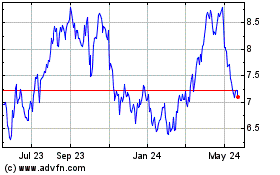
Berry (NASDAQ:BRY)
Historical Stock Chart
From Jun 2023 to Jun 2024
