Asure Software, Inc. (NASDAQ: ASUR), a leading provider of
workforce management software, today announced financial results
for the fiscal second quarter 2010, ended December 31, 2009. The
Fiscal second quarter is a short period consisting of the two
months of November and December, 2009. As of January 1, 2010, Asure
switched to calendar year reporting and its next fiscal quarter
will close on March 31, 2010.
Q2 Highlights:
--  Revenue growth of $0.2M, 14%, over November/December 2008; or $0.3M,
    20%, excluding the divested Visual Asset Manager (VAM) product revenue
    in November/December 2008. Revenue Growth was driven by hardware sales
    in both product lines, $0.2M, as well as growth in NetSimplicity's SaaS
    offering.
--  EBITDA of $0.3M
      --  EBITDA is defined as operating income (earnings) before interest
          expense, income taxes, depreciation & amortization
--  Operating Income of $49K; or $0.02 per share, compared to a loss of
    ($0.9M) ($0.29) per share (split-adjusted), in November & December
    2008; and previously published quarterly losses of ($1.5M)
    ($0.48)/share (split-adjusted), and ($5.3M) ($1.69)/share
    (split-adjusted), in fiscal Q1'10 and fiscal Q4'09 respectively.
    Operating income is comprised of the following components:
      --  Austin HQ excess lease impact, ($105K)
      --  Net onetime items, $264K
      --  Core business lines margin, ($110K)
--  Operating Expenses were reduced by 49%, or ($1.1M) compared to
    November/December 2008 largely due to both headcount & rate per head
    efficiencies ($0.3M), the net effect of one-time items, (0.3M), as well
    as other cost reductions. One-time items were driven by the
    renegotiation of certain outstanding payables deemed excessive by
    current management.
Pat Goepel, Asure's Chief Executive Officer, remarked: "After
two recent difficult quarters, and almost 2 and a half years of
unprofitable results, we are beginning to make progress on turning
this business around. I am pleased with the results of the short
period of fiscal Q2'10 and confirm that our upcoming calendar Q1,
2010 outlook is expected to be on target with our previous
estimates. We are targeting positive EBITDA and potentially
breakeven operating income, excluding the negative impact of the
Austin headquarters lease arrangement."
Asure's newly appointed Chief Financial Officer, David Scoglio,
added: "We have substantially reduced overhead and are carefully
investing in areas that will support our revenue plan in the coming
first quarter of the calendar year 2010. These investments will
include strategic augmentation of our sales force and enhancements
to our products' features and functionality. This strategy, a keen
focus on maintaining current levels of fixed expenses and our
momentum of 72% repetitive revenue from the current period should
propel us forward to achieving our profitability goals of this
calendar year 2010, in spite of a projected $1M in full year excess
lease expense ($1.5M cash). Also notable, as we attain
profitability, we have significant Net Operating Losses carry
forwards at our disposal for up to 20 years, which we hope to
utilize to create shareholder value."
Pat Goepel continued, "In the short period of November &
December 2009, Asure incurred $0.1M of expenses associated with its
Austin lease. As discussed previously, Asure is actively pursuing
options to improve this arrangement, which would only help provide
transparency into the increasingly successful core businesses of
Asure Software, Inc. Asure's Board of Directors and management team
are committed to growing this business by 20% year over year and
achieving levels of 20% EBITDA by calendar year end 2010."
Conference Call Details
Asure Software, Inc. has scheduled a conference call for
Wednesday, February 10, 2010 at 11:00 a.m. ET (10:00 a.m. CT) to
discuss its most recent financial results and outlook.
Participating in the call will be Pat Goepel, Chief Executive
Officer. To take part, please dial 800-299-7089 ten minutes before
the conference call begins, ask for the Asure Software event and
use passcode 16877542. International callers should dial
617-801-9714 and reference the same passcode, 16877542.
Investors, analysts, media and the general public will also have
the opportunity to listen to the conference call in listen-only
mode via the Internet by visiting the investor relations page of
Asure's web site at www.asuresoftware.com. To monitor the live
call, please visit the web site at least 15 minutes early to
register, download and install any necessary audio software. For
those who cannot listen to the live broadcast, an archived replay
will be available shortly after the call on the investor relations
page of the Company's web site at www.asuresoftware.com
About Asure Software, Inc.
Headquartered in Austin, Texas, Asure Software empowers small to
mid-size organizations and divisions of large enterprises to
operate more efficiently, increase worker productivity and reduce
costs through a comprehensive suite of on-demand workforce
management software and services. Asure's market-leading suite
includes products that optimize workforce time and attendance
tracking, benefits enrollment and tracking, pay stubs and W2
documentation, and room scheduling and resource management. With
additional offices in Warwick, Rhode Island, Vancouver, British
Columbia, and Mumbai, India, Asure serves 3,500 customers around
the world. For more information, please visit
www.asuresoftware.com.
"Safe Harbor" Statement under the Private Securities Litigation
Reform Act of 1995: Statements in this press release regarding
Asure's business which are not historical facts are
"forward-looking statements" that involve risks and uncertainties.
Such risks and uncertainties, which include those associated with
continued listing of the Company's securities on the NASDAQ Capital
Market, could cause actual results to differ from those contained
in the forward-looking statements.
                         ASURE SOFTWARE, INC.
                 CONDENSED CONSOLIDATED BALANCE SHEETS
             (Amounts in thousands, except per share data)


                                                 December 31,   JULY 31,
                                                     2009         2009
                                                 (UNAUDITED)
ASSETS
Current Assets:
  Cash and equivalents                             $   2,263    $   4,375
  Short-term investments                                   0        5,339
  Accounts receivable, net of allowance for
   doubtful accounts of $34 and $20 at December 31,
   2009 and July 31, 2009, respectively                1,526        1,207
  Inventory                                               49            3
  Prepaid expenses and other current assets              213          143
                                                   ----------   ----------
     Total Current Assets                               4,051       11,067

Property and equipment, net                               581          672
Intangible assets, net                                  3,623        3,949
                                                   ----------   ----------
           Total Assets                            $    8,255   $   15,688
                                                   ==========   ==========

LIABILITIES AND STOCKHOLDERS' EQUITY
Current Liabilities:
  Accounts payable                                 $    1,039   $    6,294
  Accrued compensation and benefits                        79          278
  Lease impairment and advance                            562          899
  Other accrued liabilities                               411          541
  Deferred revenue                                      1,744        1,897
                                                   ----------   ----------
     Total Current Liabilities                          3,835        9,909

Long-Term Liabilities:
  Deferred revenue                                        134          119
  Lease impairment and advance                            196          250
  Other long-term obligations                             212          206
                                                   ----------   ----------
      Total Long-Term Liabilities                         542          575

Stockholders' Equity:
  Preferred stock, $.01 par value; 1,500 shares
   authorized; none issued or outstanding                  --           --
  Common stock, $.01 par value; 6,500 shares
   authorized; 3,375 and 3,290 shares issued;
   3,162 and 3,112 shares outstanding at
   December 31, 2009 and July 31, 2009,
   respectively                                           334          329
  Treasury stock at cost, 213 and 179 shares at
   December 31, 2009 and July 31, 2009,
   respectively                                        (4,907)      (4,815)
  Additional paid-in capital                          270,925      270,738
  Accumulated deficit                                (262,404)    (260,947)
  Accumulated other comprehensive income                  (70)        (101)
                                                   ----------   ----------
      Total Stockholders' Equity                        3,878        5,204
                                                   ----------   ----------
           Total Liabilities and Stockholders'
            Equity                                 $    8,255   $   15,688
                                                   ==========   ==========


                         ASURE SOFTWARE, INC.
           CONDENSED CONSOLIDATED STATEMENTS OF OPERATIONS
            (Amounts in thousands, except per share data)


                                   FOR THE                 FOR THE
                              TWO MONTHS ENDED       FIVE MONTHS ENDED
                                 DECEMBER 31,            DECEMBER 31,
                               2009        2008        2009        2008
                            ----------  ----------  ----------  ----------
                                  (UNAUDITED)             (UNAUDITED)

Revenues                    $    1,679  $    1,467  $    4,000  $    4,259
Cost of Sales                     (435)       (294)       (914)       (858)
                            ----------  ----------  ----------  ----------
    Gross Margin                 1,244       1,173       3,086       3,401

OPERATING EXPENSES:
    Selling, general and
     administrative                797       1,857       3,537       5,036
    Research and development       264         343         676         904
    Amortization of
     intangible assets             100          99         249         248
                            ----------  ----------  ----------  ----------
      Total Operating
       Expenses                  1,161       2,299       4,462       6,188

INCOME (LOSS) FROM
 OPERATIONS                         83      (1,126)     (1,376)     (2,787)

OTHER INCOME AND (EXPENSES):
    Interest income                  2          25           9          80
    Foreign currency
     translation                   (15)        (19)        (46)        102
    Gain on sale of assets           0         250           0         250
    Interest expense and
     other                          (8)        (17)        (20)        (27)
                            ----------  ----------  ----------  ----------
      Total Other Income           (21)       (239)        (57)        405

INCOME (LOSS) FROM
 OPERATIONS, BEFORE INCOME
 TAXES                              62        (887)     (1,433)     (2,382)
Provision for income taxes         (13)          0         (25)        (25)
                            ----------  ----------  ----------  ----------
NET INCOME (LOSS)           $       49  $     (887) $   (1,458) $   (2,407)
                            ==========  ==========  ==========  ==========

BASIC AND DILUTED LOSS
 PER SHARE:
    Net income (loss) per
     share - basic          $     0.02  $    (0.29) $    (0.46) $    (0.77)
    Net income (loss) per
     share - diluted        $     0.02  $    (0.29) $    (0.46) $    (0.77)

WEIGHTED AVERAGE SHARES
 OUTSTANDING:
    Basic                        3,156       3,111       3,141       3,111
    Diluted                      3,162       3,111       3,141       3,111
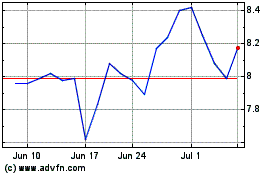
Asure Software (NASDAQ:ASUR)
Historical Stock Chart
From May 2024 to Jun 2024

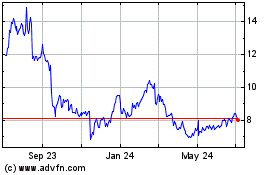
Asure Software (NASDAQ:ASUR)
Historical Stock Chart
From Jun 2023 to Jun 2024
